
Neural Networks Bias Mitigation
Through Fuzzy Logic and Saliency Maps
Sahar Shah
a
, Davide E. Ciucci
b
, Sara L. Manzoni
c
and Italo F. Zoppis
d
Department of Informatics, System and Communication, University of Milano-Bicocca, Viale Sarca 336, Milano, Italy
Keywords:
Bias Mitigation, Neural Networks, Decision-Making, Saliency Maps, Fuzzy Logic.
Abstract:
Mitigating biases in neural networks is crucial to reduce or eliminate the predictive model’s unfair responses,
which may arise from unbalanced training, defective architectures, or even social prejudices embedded in the
data. This study proposes a novel and fully differentiable framework for mitigating neural network bias using
Saliency Maps and Fuzzy Logic. We focus our analysis on a simulation study for recommendation systems,
where neural networks are crucial in classifying job applicants based on relevant and sensitive attributes.
Leveraging the interpretability of a set of Fuzzy implications and the importance of features attributed by
Saliency Maps, our approach penalizes models when they overly rely on biased predictions during training.
In this way, we ensure that bias mitigation occurs within the gradient-based optimization process, allowing
efficient model training and evaluation.
1 INTRODUCTION
Bias in machine learning remains a significant chal-
lenge, particularly in decision-making systems that
involve sensitive features such as gender, race, or dis-
ability status. Recent research has shown that mod-
els trained on biased data can perpetuate or even ex-
acerbate social prejudice, leading to unfair predic-
tions (Kamiran et al., 2010). Various strategies have
been proposed to address this problem, including pre-
processing, in-processing, and post-processing meth-
ods.
Pre-processing methods involve removing bias
from the dataset before it is used for training (Ghosh
et al., 2023). Common techniques include adjusting
the importance of data samples to ensure a balanced
representation between sensitive groups (Kamiran
and Calders, 2012) or editing feature distributions to
reduce disparate impacts without compromising the
utility of data (Feldman et al., 2015).
In-processing approaches focus on modifying the
learning algorithm to incorporate fairness constraints
during training (Iosifidis and Ntoutsi, 2019). For ex-
ample, Kamiran et al. (2010) modify the splitting cri-
a
https://orcid.org/0009-0001-5588-8823
b
https://orcid.org/0000-0002-8083-7809
c
https://orcid.org/0000-0002-6406-536X
d
https://orcid.org/0000-0001-7312-7123
terion of decision trees to consider the impact of the
split on the protected attribute. Similarly, Kamishima
et al. (2012) introduces a regularized technique to
reduce the effect of indirect prejudice (measured as
the mutual information between sensitive features and
class labels). Furthermore, constraints, such as de-
mographic parity or equalized odds, are directly inte-
grated into the optimization objective in Zafar et al.
(2017). Recent work on adversarial networks has also
focused on minimizing predictive disparities between
sensitive groups (Zhang et al., 2018).
Post-processing methods adjust predictions with-
out altering the model or data. For example, Hardt
et al. (2016) modify predictions to satisfy the fair-
ness criteria, such as equalized odds, while (Pleiss
et al., 2017) balances accuracy and fairness through
calibrated prediction adjustments.
Although there has been extensive work on bias
mitigation, the explicit integration of eXplainable
Artificial Intelligence (XAI) techniques for bias re-
duction has been less explored particularly for in-
processing methods (Tjoa and Guan, 2020). In this
paper, we focus on such an integration aiming not
only to enhance explainability (according to XAI) but
also to allow the model to adjust dynamically pre-
defined, human-understandable fairness constraints.
This capability is critical, especially in high-risk ap-
plications such as medical diagnostics, where human
intervention is essential.
Shah, S., Ciucci, D. E., Manzoni, S. L. and Zoppis, I. F.
Neural Networks Bias Mitigation Through Fuzzy Logic and Saliency Maps.
DOI: 10.5220/0013366800003890
In Proceedings of the 17th International Conference on Agents and Artificial Intelligence (ICAART 2025) - Volume 3, pages 1343-1351
ISBN: 978-989-758-737-5; ISSN: 2184-433X
Copyright © 2025 by Paper published under CC license (CC BY-NC-ND 4.0)
1343

The intent is to modify the model’s loss function by
including a regularization term or constraints that ac-
count for discriminatory behavior or fairness criteria.
By leveraging the importance of sensitive features,
as attributed by Saliency Maps, we evaluate human-
predefined rules (i.e., fuzzy antecedents of an implica-
tion). Simultaneously, we quantify the bias for neural
loss regularization by evaluating the output of these
rules (fuzzy consequent). In other words, fuzzy rules
provide humanly understandable and readable expres-
sions of how certain sensitive attributes (race, gender,
and disability status) should or should not influence
the prediction process. Importantly, this approach
will ensure that bias mitigation occurs during gradi-
ent backpropagation, allowing efficient model train-
ing and evaluation.
The paper is organized as follows. Section 2 out-
lines the methods utilized in our analysis; Section 3
describes the numerical experiments conducted along
with the insights obtained, and Section 4 concludes
this paper with a discussion of potential future exten-
sions.
2 MATERIALS AND METHODS
Although our approach is generalizable to other set-
ting and applications, we focus on neural decision-
making for classification of job applicants. A neural
network categorizes applicants into two groups: those
qualified for higher-skilled positions and those qual-
ified for lower-skilled positions. The following sec-
tions outline the methods employed in our approach.
2.1 Saliency Maps
Saliency maps (SM) are part of a broader category
of methods known as attribute methods, which pro-
vide insights into which attributes have the great-
est influence on the corresponding predictive output.
We focus on SM because they are intrinsically dif-
ferentiable, meaning they exploit the gradients of the
model’s predictions f (x) for each input (x), i.e.,
S(x) =
∂ f (x)
∂x
(1)
The differentiability of f (x) allows us to apply
a gradient-based optimization to the neural network
custom loss function. Specifically, the gradients in
Eq. 1 are evaluated and averaged across epochs to
determine the importance of each sensitive feature in
decision-making. To this end, the average sensitivity
of the network responses (with respect to the sensitive
features) is sliced from S(x), and passed to the fuzzy
controller, as described in the next paragraph, to guide
the bias mitigation efforts.
2.2 Fuzzy Controller
A fuzzy logic system (referred to here as a fuzzy con-
troller) refines our approach by incorporating human
knowledge through a set of fuzzy rules. The con-
troller’s main goal is to quantify bias and ensure that
relevant factors for decision-making are adequately
addressed. This task is achieved by carefully tuning
the linguistic terms (fuzzy sets) as specified by hu-
man operators. Furthermore, to effectively integrate
the fuzzy logic and enable gradient backpropagation
(in-processing), we have appropriately applied differ-
entiable functions to approximate the typical fuzzy
operators. We report the applied controller, using a
typical pipeline for the fuzzy system design.
2.2.1 Fuzzification
Let s ∈ [0,1] be the saliency value of any sensitive
feature. To allow differentiation, we define the fol-
lowing Gaussian curves as membership functions for
three fuzzy sets: Low, Moderate, and High.
µ
Low
(s) = exp
−
(s −c
Low
)
2
2σ
2
µ
Moderate
(s) = exp
−
(s −c
Moderate
)
2
2σ
2
(2)
µ
High
(s) = exp
−
(s −c
High
)
2
2σ
2
Here c
Low
= 0,c
Moderate
= 0.5,c
High
= 1 represent the
Gaussian centers, while σ denotes the standard devia-
tion.
2.2.2 Fuzzy Rules Definition
Given a pair of saliency values s
1
,s
2
∈ [0,1], and an
output variable y (representing bias), our rules follow
a typical ”if-then” implication with the format:
R
j
: IF s
1
is A
j1
AND s
2
is A
j2
THEN y is B
j
(3)
In Eq. 3 A
j1
and A
j2
represent a pair of fuzzy sets
in rule R
j
, y denotes the output variable (bias), and
B
j
is the output fuzzy set with Gaussian membership
function (similarly to Eq. 2), respectively with center
in c
Out Low
,c
Out Moderate
,c
Out High
.
All rules applied in this study are reported in Tab.
1. To ensure a conservative and interpretable fuzzy in-
ference process, the rules are consistent with a fuzzy
ICAART 2025 - 17th International Conference on Agents and Artificial Intelligence
1344

partial ordering, i.e., the fuzzy sets representing lin-
guistic terms (e.g., Low, Moderate, High) are ordered
based on their membership dominance (Zadeh, 1971),
establishing a natural hierarchy such that:
Low < Moderate < High. (4)
Equation 4 reflects a progression in intensity (or
magnitude), and ensures that the output adheres to
the principle of being the smallest fuzzy set consistent
with the defined order. This conservative approach
prevents overestimation in the inference process by
assigning the outputs that are minimal in terms of
the defined hierarchy, preserving interpretability and
caution.
2.2.3 Rule Evaluation and Aggregation
Each rule (Eq. 3) is evaluated by applying a Product-
Over-Sum softmin function, defined as
softmin(µ
A
j,1
(s
1
),µ
A
j,2
(s
2
)) =
µ
A
j,1
(s
1
) ·µ
A
j,2
(s
2
)
µ
A
j,1
(s
1
) + µ
A
j,2
(s
2
)
(5)
for any pair of fuzzy sets A
j1
, A
j2
. Eq. 5 approximates
the minimum firing strength, α
j
, for the rule R
j
across
the antecedents, thus providing smooth transitions be-
tween values. Importantly, since Eq. 5 depends on the
sums and products of differentiable functions (Gaus-
sian curves), it is itself differentiable, making it useful
for gradient-based optimization.
Finally, we aggregate the bias across the rules using
a Weighted Sum (softmax) of each Gaussian output,
thus maintaining the differentiability of the fuzzy op-
erations, i.e.,
µ
agg
(y) = softmax(µ
B
1
(y),µ
B
2
(y),...,µ
B
n
(y))
=
m
∑
i=1
α
i
·e
−
(y−c
i
)
2
2σ
2
(6)
2.2.4 Defuzzification
The defuzzification converts the fuzzy output back
into a quantitative measure which serves, in this case,
as a quantitative measure of the detected bias. The
well-known weighted average method (centroid) is
considered, i.e.,
y
∗
=
R
y ·µ
agg
(y)dy
R
µ
agg
(y)dy
(7)
When the Gaussian curves share the same deviation,
then Eq. 7 simplifies to a weighted average of Gaus-
sian centers (c
Low
, c
Moderate
, and c
High
), over the sum
of the activation weights,
y
∗
≈
∑
i
α
i
·c
i
∑
i
α
i
(8)
where c
i
are the centers of the output Gaussian mem-
bership (i.e., Low, Moderate, High), and α
i
are the
rule activations.
To derive Eq. 8, for our application, it suffices
to note that according to Eq. 6, we can expand the
numerator of y
∗
as
Z
y ·µ
agg
(y)dy =
Z
y ·
m
∑
i=1
α
i
·e
−
(y−c
i
)
2
2σ
2
dy (9)
Then, bringing the sum outside the integral,
Z
y ·µ
agg
(y)dy =
m
∑
i=1
α
i
Z
y ·e
−
(y−c
i
)
2
2σ
2
dy (10)
Each integral
R
y ·e
−
(y−c
i
)
2
2σ
2
dy represents the expected
value of y for a Gaussian curve centered at c
i
, or
equivalently the expected value of a Gaussian distri-
bution with parameters (c
i
,σ), scaled by
√
2πσ
2
, i.e.,
Z
y ·e
−
(y−c
i
)
2
2σ
2
dy = c
i
√
2πσ
2
(11)
Thus, the numerator becomes,
m
∑
i=1
α
i
·c
i
√
2πσ
2
(12)
Similarly, by extending the denominator in Eq. 8, we
get
Z
µ
agg
(y)dy =
Z
m
∑
i=1
α
i
·e
−
(y−c
i
)
2
2σ
2
dy (13)
bringing out the sum outside the integral,
Z
µ
agg
(y)dy =
m
∑
i=1
α
i
Z
e
−
(y−c
i
)
2
2σ
2
dy =
m
∑
i=1
α
i
·
√
2πσ
2
(14)
Finally, simplifying common terms in Eq. 12, and
14 we result with Eq. 8. The crisp value y
∗
is then
incorporated into the overall loss to mitigate biased
predictions.
2.3 Neural Network
The Neural Network is relatively simple: a feed-
forward architecture that generates biased decisions
only. Essentially, the model will be required to re-
spond to sensitive and relevant input to determine
Neural Networks Bias Mitigation Through Fuzzy Logic and Saliency Maps
1345

Table 1: Fuzzy rules used to determine bias levels based on saliency map values.
Fuzzy Rules Descriptions
R
1
IF Saliency of Race is High AND Saliency of Gender is Medium THEN Bias is High
R
2
IF Saliency of Race is Medium AND Saliency of Gender is Low THEN Bias is Medium
R
3
IF Saliency of Race is Low AND Saliency of Gender is High THEN Bias is High
R
4
IF Saliency of Gender is High AND Saliency of Disability is Medium THEN Bias is High
R
5
IF Saliency of Gender is Medium AND Saliency of Disability is Low THEN Bias is Medium
R
6
IF Saliency of Gender is Low AND Saliency of Disability is High THEN Bias is High
R
7
IF Saliency of Disability is High AND Saliency of Race is Medium THEN Bias is High
R
8
IF Saliency of Disability is Medium AND Saliency of Race is Low THEN Bias is Medium
R
9
IF Saliency of Disability is Low AND Saliency of Race is High THEN Bias is High
R
10
IF Saliency of Race is Low AND Saliency of Gender is Low AND Saliency of Disability is Low
THEN Bias is Low
which of the two jobs assigned classes a candi-
date belongs to (i.e., either higher-skilled or lower-
skilled class). As mentioned previously, we follow
in-processing approaches: the core mechanism of
our predictions is a loss function, L = L
CE
+ λy
∗
,
that combined L
CE
, implemented as a typical binary
cross-entropy, with the defuzzified bias y
∗
obtained in
Eq. 8 .
This regularization should penalize during training
the model when the antecedents of a fuzzy implica-
tion is met (i.e., when the saliency map shows the
model overly relies on biased features, as returned by
the fuzzy controller).
2.4 Data Set
We implemented a data generation mechanism that
explicitly introduces bias through an unfair filter con-
dition to discriminate against a specific demographic
group. We define the following two sets of features in
the simulated data.
• Sensitive features include Race, Gender, and Dis-
ability status. These are data attributes that require
special protection due to their nature, and any bias
introduced here could result in prejudice towards
a group of applicants.
• Relevant features reflect the subject’s Skills, Ex-
perience, and Education. These are legitimate fac-
tors for a fair job assignment and represent the
quality levels in applicant profiles.
The generation process (reported in Tab. 1) corre-
lates relevant features (mean score) with skillful job
labels for every profile, and penalizes those profiles
that match the discriminatory filter, reducing the job
label assigned. The resulting label finally provides a
job class.
Algorithm 1: Job Class Assignment.
Require:
Profile x (Sensitive & Relevant Features)
Sensitive Filter:
e.g., Race = 1, Gender = 0, Disability = 1
Ensure: Job class assignment (JClass)
score ← skill + exp + edu ▷ Fair correlation
score ← (score −score
min
)/(score
max
−score
min
)
jLab ← ⌊6 ×score⌋ + 1 ▷ Mapping to integer
if x matches the filter then ▷ Penalization
jLab = jLab −2
jLab = max(jLab,0) ▷ ensure jLab ≥ 0
end if
if 1 ≤ jLab ≤3 then
jClass ← 0 ▷ Lower-Skilled Job assigned
else if 4 ≤ jLab ≤6 then
jClass ← 1 ▷ Higher-Skilled Job assigned
end if
3 NUMERICAL EXPERIMENTS
We conducted a series of numerical experiments to
evaluate the effectiveness of our approach, focusing
mainly on the influence of sensitive features on neu-
ral decision making. To accomplish this goal, we de-
signed our experiments to evaluate and estimate the
mitigation gain through the introduction of a regular-
ization term. In detail, the following three models are
considered.
1. Fuzzy-regularized model. A model based on
fuzzy regularization.
2. Saliency-regularized model. In this case, the reg-
ularization term is obtained by combining (aver-
aging) the importance values assigned to feature
across epochs (Saliency values).
3. Non-regularized model - No regularization is ap-
plied.
All models are simple, fully connected (dense)
feed-forward networks designed for binary classifi-
ICAART 2025 - 17th International Conference on Agents and Artificial Intelligence
1346

cation. They aim to establish a baseline for testing
bias mitigation through regularization while ensur-
ing that the models remain interpretable and efficient.
All models share the following architectures and are
trained with Adam Optimizer.
• Input Layer. Accepts a vector of six features as in-
put: three relevant features (skill, experience, and
education) and three sensitive features (race, gen-
der, and disability status).
• Hidden Layer. A fully connected dense layer
with 10 hidden units, with ReLU (Rectified Lin-
ear Unit).
• Output Layer. A fully connected dense layer with
a single sigmoid output that is interpreted as the
likelihood of the sample belonging to the higher-
skilled job class (class 1). A threshold of 0.5 is
applied to classify samples into class 0 or class 1.
To evaluate generalization and robustness, 10-fold
cross-validation is applied. Training meta-parameters
such as batch size, percentages of training and test-
ing, and learning rate are the same for all the exper-
iments. Each model is trained for a fixed number of
200 epochs in each cross-validation fold. The choice
of 200 epochs is made based on initial experiments,
which suggested that the models achieve stable ac-
curacy and loss convergence; no stop criteria are ap-
plied. For each cross-validation fold, we proceed as
follows:
• The data is partitioned into 90% for training and
10% for validation.
• A new model is initialized and trained from
scratch (for each fold).
• After each fold, the training and validation metrics
are accumulated.
Moreover, Accuracy and Saliency values were
collected for each sensitive and relevant feature for
profiles that match the filter and those that do not.
To better interpret our results, it is important to note
that we are focusing on classification tasks. The pre-
dictions made by our models will be compared to data
obtained through an unfair generation process that as-
signs labels with inherent biases. As a result, com-
paring regularized and non-regularized models (un-
der similar experimental conditions) may show a de-
crease in accuracy for the regularized model. This
decrease may reflect the impact of bias mitigation
efforts, which aim to promote fair decision-making
that differs from the original biased labels assigned
by the unfair data generation mechanism. In our ex-
periments, we directly assessed the impact of regular-
ization on saliency maps. The following paragraphs
provide a detailed report of our analysis and the cor-
responding results.
3.1 Saliency Analysis
We directly assessed the impact of regularization on
saliency maps. In particular, we evaluated the effect
of model type on bias mitigation by estimating the
amount of bias reduction as a dependent variable of
ANOVA models.
To proceed, we initially considered the Null hy-
pothesis that there is no difference in mean saliency
values between sensitive and relevant features of
penalized subjects at a conservative level of 1%
(p-value). The obtained p-value of 0.0139, calculated
using a two-sample t-test to compare accumulated
mean sensitive and mean relevant values from the
non-regularized model (see Tab. 1), was greater
than the conservative threshold; thus returning no
statistical evidence to reject the Null.
Please note that while Algorithm 1 establishes a
linear correlation between relevant features and job
classes (for each profile) and penalizes filtered sub-
jects based on sensitive features, the bias-generating
mechanism, applied here, does not provide statistical
evidence of differing feature importance values when
assigning labels to different job classes, according
to the interpretation of the SM. This aspect offered
a valuable scenario for our estimation: a situation
in which bias perpetuates through neural processes,
where sensitive and relevant features contribute
equally to the unfair decision-making about penal-
ized subjects. In other words, by assuming feature’s
equal contribution to unfair decisions, we reasonably
estimated the amount of bias reduction as explained
by the difference between mean relevant and mean
sensitive feature values in profile matching the filter
when applying regularization.
Following the above considerations, we conducted
an ANOVA with post-hoc test to assess the effect of
model type and estimate the amount of bias reduction
provided by the regularized models. To this aim, we
used the difference between mean relevant and mean
sensitive feature values (referred to as the delta of
saliency in this analysis) as the ANOVA dependent
variable. Delta values were accumulated over folds
for the models considered, and reported in Fig. 1.
Only profiles that match the biased filter are included.
ANOVA in Fig. 2 indicates a statistically significant
effect of the model type on delta values (p < 0.01).
Therefore, we conducted a post hoc test with the fol-
lowing results.
Neural Networks Bias Mitigation Through Fuzzy Logic and Saliency Maps
1347
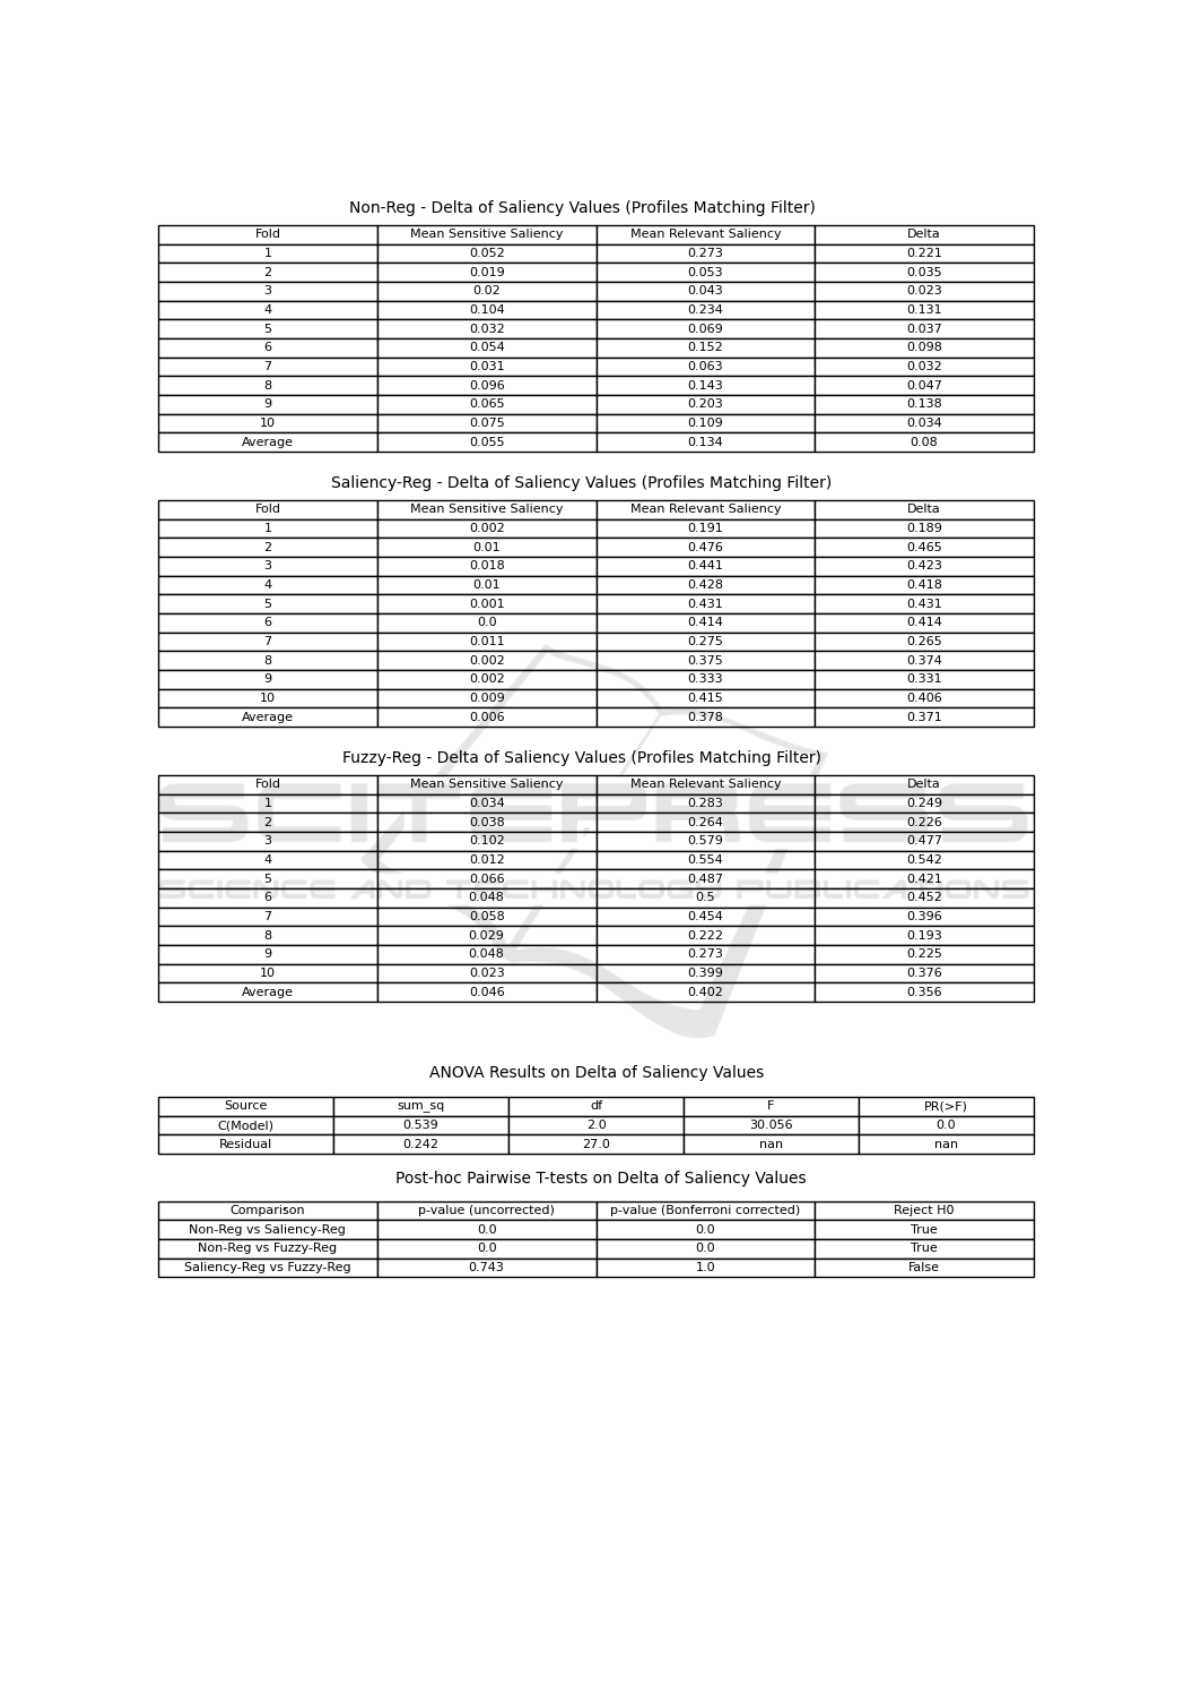
Figure 1: Delta of Saliency for the applied models.
Figure 2: Saliency Analysis: ANOVA with post-hoc test. Delta of Saliency is used as dependent variable of the ANOVA
models.
• There is statistically significant difference in the
delta of saliency values between Non-Reg vs
Saliency-Reg (p = 0.0000).
• There is statistically significant difference in the
delta of saliency values between Non-Reg vs
Fuzzy-Reg (p = 0.0000).
ICAART 2025 - 17th International Conference on Agents and Artificial Intelligence
1348

Figure 3: Delta of saliency across models for profiles matching the filters.
• There is no statistically significant difference in
the delta of saliency values between Saliency-Reg
vs Fuzzy-Reg (p = 1.0000).
Finally, we summarize these results qualitatively
in Fig. 4 by reporting the bar-plot of the importance
of each relevant and sensitive feature (Left column),
for the neural decision making, averaged across vali-
dation folds (only profiles matching the filter are con-
sidered.)
These plots reveals, on average, how much each
model relies on each sensitive and relevant feature
when making predictions, thus highlighting again
how the effect of regularization is distributed across
the 2 groups of features.
3.2 Results
In conclusion, our experiments produced the follow-
ing insights:
• Bias Mitigation Effectiveness: We estimated the
”effect” of mitigation directly focusing on the dif-
ference between relevant and sensitive saliency,
as explained by the saliency maps: higher delta
values are observed when applying regularized
models, thus implying higher mitigation capabil-
ity concerning the non regularized models. No
significant difference in delta is assessed between
saliency and fuzzy-based regularization.
• Consistency Across Folds: The performance
trend across (training vs. validation) folds (ac-
curacy) provides a comprehensive view of each
model’s reliability and robustness under different
data distributions (Fig. 4, right column)
These results demonstrate that in-processing reg-
ularization through the saliency maps and the inte-
grated fuzzy logic allows mitigation of the predictive
model’s bias induced by data distortion. In particular,
the mitigation achieved through regularization em-
phasizes the relationship between relevant and sensi-
tive attributes, which is central to the decision-making
process of this simulation study.
4 CONCLUSIONS
Fuzzy implications combined with saliency maps
offer a promising strategy to make neural predic-
tions more transparent and accountable while simul-
taneously addressing biases embedded in decision-
making. In this paper, we have integrated a fuzzy sys-
tem and saliency maps to penalize models that overly
rely on sensitive features.
Experimental results demonstrate a significant re-
duction in the saliency values of sensitive features
when fuzzy-based and saliency-based regularization
are applied, thereby promoting fairness in decision-
making. While no significant performance differ-
ences have been observed between fuzzy-based (inte-
grated system) and saliency-based regularization, the
integrated system offers additional advantages. It fa-
cilitates neural explainability (as per XAI principles)
and enables the model to adapt pre-defined, human-
understandable fairness constraints. This capability is
particularly crucial in high-risk applications such as
medical diagnostics.
It is important to emphasize that the numerical re-
sults presented here are affected by various factors
that create degrees of freedom in the system. Ele-
ments like the choice of the Gaussian curve, its pa-
rameters, the rules formulated, and the fuzzy opera-
tors used for evaluations contribute to the complex-
ity and variability of the outcomes. Therefore, future
extensions will require experiments to constrain the
system’s degrees of freedom to better understand how
these parameters influence the robustness of the per-
formances obtained.
Neural Networks Bias Mitigation Through Fuzzy Logic and Saliency Maps
1349

Figure 4: Saliency Regularization across feature (Left) and Train vs validation across folders (right).
ICAART 2025 - 17th International Conference on Agents and Artificial Intelligence
1350

ACKNOWLEDGEMENTS
This work was partially supported by the MUR under
the grant “Dipartimenti di Eccellenza 2023-2027” of
the Department of Informatics, Systems and Commu-
nication of the University of Milano-Bicocca, Italy.
REFERENCES
Feldman, M., Friedler, S. A., Moeller, J., Scheidegger,
C., and Venkatasubramanian, S. (2015). Certifying and
removing disparate impact. Proc. of the 21th ACM
SIGKDD, pages 259–268.
Ghosh, B., Basu, D., and Meel, K. S. (2023). ”how bi-
ased are your features?”: Computing fairness influence
functions with global sensitivity analysis. In Proc. of the
2023 ACM Conf. on Fairness, Accountability, and Trans-
parency, pages 138–148.
Hardt, M., Price, E., and Srebro, N. (2016). Equality of
opportunity in supervised learning. Advances in Neural
Information Processing Systems, pages 3315–3323.
Iosifidis, V. and Ntoutsi, E. (2019). Adafair: Cumulative
fairness adaptive boosting. In Proc. of the 28th ACM
international conference on information and knowledge
management, pages 781–790.
Kamiran, F. and Calders, T. (2012). Data preprocess-
ing techniques for classification without discrimination.
Knowledge and Information Systems, 33(1):1–33.
Kamiran, F., Calders, T., and Pechenizkiy, M. (2010). Dis-
crimination aware decision tree learning. In 2010 IEEE
conf. on data mining, pages 869–874. IEEE.
Kamishima, T., Akaho, S., Asoh, H., and Sakuma, J.
(2012). Fairness-aware classifier with prejudice remover
regularizer. In Machine Learning and Knowledge Dis-
covery in Databases: ECML PKDD 2012, Bristol, UK,
September 24-28, 2012. Proceedings, Part II 23, pages
35–50. Springer.
Pleiss, G., Raghunathan, A., Wu, F., Kleinberg, J., and
Weinberger, K. Q. (2017). On fairness and calibra-
tion. Advances in Neural Information Processing Sys-
tems, pages 5680–5689.
Tjoa, E. and Guan, C. (2020). A survey on explainable arti-
ficial intelligence (xai): Toward medical xai. IEEE trans.
on neural networks and learning systems, 32(11):4793–
4813.
Zadeh, L. A. (1971). Similarity relations and fuzzy order-
ings. Information sciences, 3(2):177–200.
Zafar, M. B., Valera, I., Gomez-Rodriguez, M., and Gum-
madi, K. P. (2017). Fairness constraints: Mechanisms
for fair classification. Artificial Intelligence and Statis-
tics, pages 962–970.
Zhang, B. H., Lemoine, B., and Mitchell, M. (2018). Miti-
gating unwanted biases with adversarial learning. Proc.
of the 2018 AAAI/ACM Conference on AI, Ethics, and
Society, pages 335–340.
Neural Networks Bias Mitigation Through Fuzzy Logic and Saliency Maps
1351
