
A Comparative Study of Log-Based Anomaly Detection Methods in
Real-World System Logs
Nadira Anjum Nipa, Nizar Bouguila and Zachary Patterson
Concordia Institute for Information and Systems Engineering, Concordia University, Montreal, Quebec, Canada
Keywords:
Anomaly Detection, Log Analysis, Machine Learning, Deep Learning, Log Parser.
Abstract:
The reliability and security of today’s smart and autonomous systems increasingly rely on effective anomaly
detection capabilities. Logs generated by intelligent devices during runtime offer valuable insights for mon-
itoring and troubleshooting. Nonetheless, the enormous quantity and complexity of logs produced by con-
temporary systems render manual anomaly inspection impractical, error-prone, and laborious. In response to
this, a variety of automated methods for log-based anomaly detection have been developed. However, many
current methods are evaluated in controlled environments with set assumptions and frequently depend on pub-
licly available datasets. In contrast, real-world system logs present greater complexity, lack of labels, and
noise, creating substantial challenges when applying these methods directly in industrial settings. This work
explores and adapts existing machine learning and deep learning techniques for anomaly detection to function
on real-world system logs produced by an intelligent autonomous display device. We conduct a comparative
analysis of these methods, evaluating their effectiveness in detecting anomalies through various metrics and
efficiency measures. Our findings emphasize the most efficient approach for detecting anomalies within this
specific system, enabling proactive maintenance and enhancing overall system reliability. Our work provides
valuable insights and directions for adopting log-based anomaly detection models in future research, particu-
larly in industrial applications.
1 INTRODUCTION
In the current technological environment, the Internet
of Things (IoT) has become essential to various facets
of everyday life, providing an extensive range of ser-
vices. One example of an IoT device is SCiNe (Smart
City Network), a smart, autonomous display created
by Buspas (Bus, 2024), tailored specifically for the
transportation sector. SCiNe operates autonomously,
using a lithium battery and a solar panel and will de-
liver real-time transit information at bus stops. This
involves accurate bus wait times, occupancy informa-
tion, and customer traffic insights to optimize vehi-
cle assignments based on demand (Bus, 2024). For
uninterrupted service and to guarantee customer sat-
isfaction, this IoT device must operate continuously,
around the clock. Even small service disruptions will
affect user experience, making dependable and con-
tinuous operation essential for such a large-scale and
intricate system.
Anomaly detection is essential for promptly iden-
tifying unusual system behavior, which is vital for re-
ducing system downtime and maintaining smooth op-
erations. Anomaly detection offers early warnings of
potential issues, enabling operators to swiftly address
and resolve problems, thereby ensuring uninterrupted
service. System logs serve as one of the most valuable
sources of data for detecting anomalies, as they docu-
ment real-time events and activities occurring within
a system. These logs provide important insights for
identifying anomalies, positioning log-based anomaly
detection as a significant field of study.
Historically, anomaly detection in logs has relied
on manual inspection. Nonetheless, the vast quantity
and intricacy of log events produced each second in
contemporary systems make manual analysis imprac-
tical, prompting the development of automated log
analysis methods.
Many statistical and traditional machine learning
algorithms, such as Decision Tree (Chen et al., 2004),
Principal Component Analysis (Xu et al., 2009), and
Log Clustering (Lin et al., 2016), have been used to
automate the identification of significant incidents or
anomalies in log data. Although these conventional
methods have made notable contributions, they are
hampered by drawbacks such as limited interpretabil-
Nipa, N. A., Bouguila, N. and Patterson, Z.
A Comparative Study of Log-Based Anomaly Detection Methods in Real-World System Logs.
DOI: 10.5220/0013367000003944
In Proceedings of the 10th International Conference on Internet of Things, Big Data and Security (IoTBDS 2025), pages 141-152
ISBN: 978-989-758-750-4; ISSN: 2184-4976
Copyright © 2025 by Paper published under CC license (CC BY-NC-ND 4.0)
141
ity, inflexibility, and the requirement for manual fea-
ture engineering (Le and Zhang, 2022), (Zhang et al.,
2019).
To address these challenges, deep learning tech-
niques such as DeepLog (Du et al., 2017), LogRobust
(Zhang et al., 2019) have been developed, demon-
strating encouraging outcomes. Although advances
have been achieved in the literature, a significant gap
remains in the use of these techniques for industrial
datasets.
The majority of research has focused on pub-
lic datasets that come with predefined conditions,
where data is already labeled, organized, and struc-
tured effectively. Conversely, real-world data intro-
duces further difficulties, including noise, variability,
and unstructured formats, which significantly com-
plicate log-based anomaly detection in industrial sys-
tems. The following points will highlight the specific
challenges posed by real-world data.
1. Log Collection: Without a centralized log ag-
gregation mechanism, log gathering can be labori-
ous and time-consuming. In the absence of auto-
mated systems, logs need to be collected manually
from multiple sources, leading to significant time con-
sumption and a heightened risk of human error. The
arduous and ineffective manual approach of collect-
ing and identifying logs hinders data preparation.
2. Log Structure: The structure of logs in indus-
trial systems exhibits a high degree of heterogeneity
and variability. In contrast to public datasets that usu-
ally adhere to a uniform log format, industrial log
data can differ greatly among various systems, appli-
cations, and components. The log file may include
messages that have varying structures, which compli-
cates the application of standard parsing or analysis
methods.
3. Log Quality: The quality of data in industrial
log systems can be notably compromised by noise and
extraneous information. Logs are produced at a rapid
pace by various applications, resulting in an over-
whelming amount of data, much of which is repet-
itive or lacking in useful information. Furthermore,
logs frequently include extraneous tokens or super-
fluous metadata that do not aid in significant analysis
yet still require processing. Various applications and
services within the same system might employ incon-
sistent logging standards, resulting in the presence of
unnecessary tokens that can obscure valuable infor-
mation and hinder the identification of anomalies or
issues.
The supervised ML methods consist of Logis-
tic Regression (Bodik et al., 2010), Support Vec-
tor Machine (Liang et al., 2007) and Decision Tree
(Chen et al., 2004), whereas the unsupervised meth-
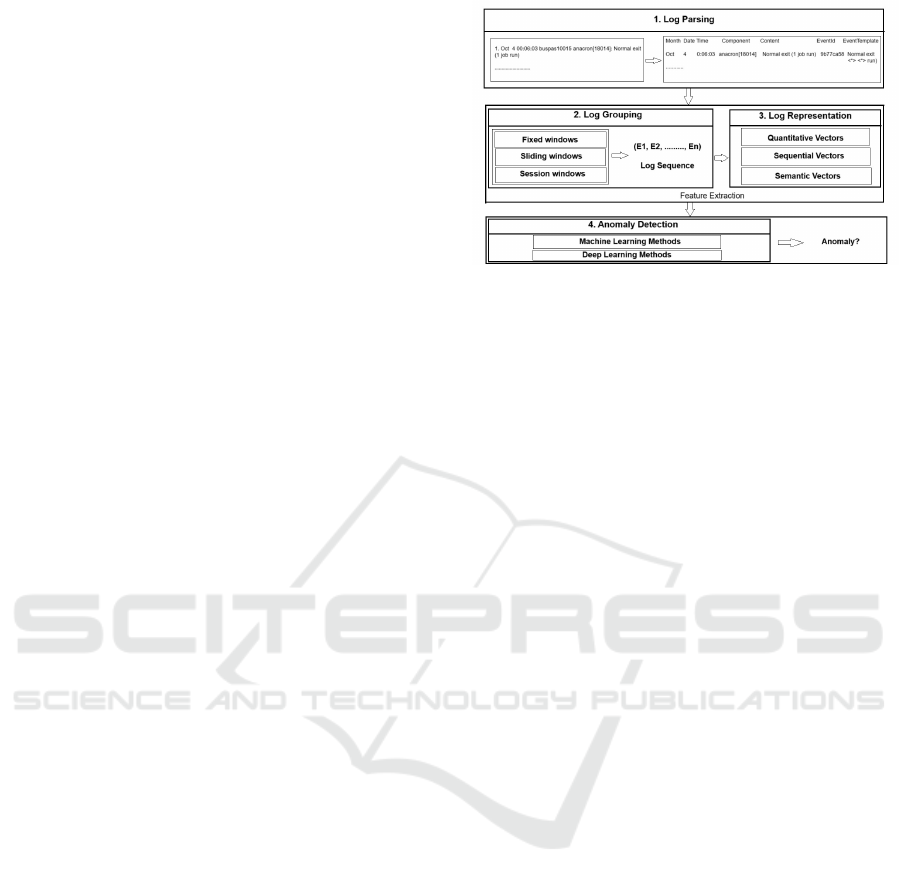
Figure 1: Anomaly Detection Framework (Le and Zhang,
2022).
ods include Principal Component Analysis (Xu et al.,
2009), Isolation Forest (Liu et al., 2008), and Log
Clustering (Lin et al., 2016). We employed DeepLog
(Du et al., 2017), an unsupervised method, and
LogRobust (Zhang et al., 2019), a supervised method,
for deep learning. All methods were adapted using
existing open-source toolkits (He et al., 2016, Chen
et al., 2021, Le and Zhang, 2022) minimizing the need
for reimplementation. A comprehensive analysis was
performed, assessing the accuracy and efficiency of
the methods. We believe that our findings will pro-
vide important insights for researchers and develop-
ers, aiding in the identification of the challenges and
intricacies associated with working with real-world
logs. In summary, this work makes several important
contributions as follows:
1. We modified various established ML and DL
log anomaly detection methods for application to a
practical industrial dataset.
2. A thorough comparative analysis was carried
out to evaluate the performance of these methods
across different experimental conditions.
3. We offer actionable insights and guidelines to
enhance industrial log-based anomaly detection de-
rived from our research.
2 COMMON FRAMEWORK
The procedure for detecting log anomalies generally
involves four essential steps: log parsing, log group-
ing, log representation, and anomaly detection (Le
and Zhang, 2022). This framework is illustrated in
Figure. 1.
2.1 Log Parsing
The first step after collecting logs is log parsing,
which transforms unrefined log messages into struc-
tured format. This entails the automatic segregation
IoTBDS 2025 - 10th International Conference on Internet of Things, Big Data and Security
142

of the fixed, constant element (Log Key) of a log
message from its variable parts. The consistent ele-
ment stays unchanged throughout various log entries,
whereas the variable component changes. The ob-
jective of parsing is to derive log templates by rec-
ognizing patterns and substituting variable segments
with placeholders. For instance, in Figure. 1, the * in
EventTemplate signifies variable components.
A range of automated log parsing techniques
have been developed, leveraging methods like clus-
tering (Shima, 2016, Hamooni et al., 2016), heuristic
(Makanju et al., 2009, He et al., 2017) and longest
common subsequence (Du and Li, 2016). A new log
parsing technique, NuLog (Nedelkoski et al., 2021)
was introduced that employed a self-supervised learn-
ing model and showed enhanced accuracy and effi-
ciency relative to other log parsing methods.
2.2 Log Grouping
Following the parsing process, next step involves
transforming the textual logs into numerical features
suitable for use in anomaly detection methods. Be-
fore this conversion, it is essential to segment the log
data into distinct groups or sequences through vari-
ous techniques. Every group signifies a series of log
events, and from these sequences, feature vectors (or
event count vectors) are generated to construct a fea-
ture matrix. This matrix acts as the input for mod-
els designed to detect anomalies. Logs can be or-
ganized into groups through three main windowing
techniques:
Fixed Window: In this approach, log events are
categorized according to a specified time frame. The
window size can fluctuate from seconds to minutes
or even hours, depending on the specific issue being
addressed. Logs that occur within the same window
are considered a single sequence, ensuring there is no
overlap between consecutive windows.
Sliding Window: In this approach, the logs are
organized in a manner akin to the fixed window, but it
incorporates an extra parameter—step size. The step
size, typically less than the window size, results in
overlap between successive windows, producing ad-
ditional sequences. For instance, a log sequence span-
ning an hour with a step size of five minutes will result
in overlapping windows.
Session Window: In contrast to the earlier two
methods, session windows categorize logs by us-
ing unique identifiers that monitor various execution
paths, facilitating a more organized grouping of re-
lated events. For example, certain public datasets use
node id, block id to identify and group related logs.
2.3 Log Representation
After logs are organized into sequences, they are
transformed into feature vectors for additional anal-
ysis. There are three main types of feature represen-
tations:
Quantitative Vector: This is referred to as the log
count vector, which records the frequency of each log
event within a sequence. For instance, in the sequence
[E1 E2 E3 E2 E1 E2], the resulting vector would be
[2 3 1], with each number indicating the frequency of
each event. This depiction is frequently used in ML
methods.
Sequential Vector: This vector represents the se-
quence of events as they unfold. For instance, the se-
quence [E1 E2 E3 E2 E1 E2] would yield the vector
[1 2 3 2 1 2]. DL methods such as DeepLog (Du et al.,
2017) utilize this method to understand event patterns
according to the sequence of their occurrences.
Semantic Vector: In contrast to quantitative
and sequential vectors, semantic vectors capture the
meaning or context of log events through the use of
language models. This method emphasizes the fun-
damental meaning of log messages instead of their
frequency or sequence. For example, in the sequence
of log events: [E1: ”Module Not Found”, E2: ”No
Override File Found”, E3: ”Error Bad parameters”,
E2: ”No Override File Found”, E1: ”Module Not
Found”], the semantic vector for each event could
look like this:
E1 (”Module Not Found”): [0.57, 0.35, 0.86, ...]
E2 (”No Override File Found”): [0.79, 0.63, 0.45, ...]
E3 (”Error Bad parameters”): [0.91, 0.37, 0.27, ...]
2.4 Anomaly Detection
After extracting the feature vectors, they are input
into ML and DL methods for the purpose of detect-
ing anomalies. ML methods generally detect unusual
log sequences by analyzing log event count vectors.
Conversely, DL methods concentrate on identifying
normal patterns within sequential logs and highlight-
ing anomalies that diverge from these established pat-
terns. While ML methods excel at detecting anoma-
lies in static datasets, DL methods are more adept at
recognizing intricate temporal patterns in logs. By in-
tegrating these techniques, we can efficiently identify
anomalies in extensive and evolving systems.
3 EXISTING METHODS
A range of ML and DL methods have been employed
to identify anomalies in system logs, leveraging both
A Comparative Study of Log-Based Anomaly Detection Methods in Real-World System Logs
143

supervised and unsupervised learning methods. In su-
pervised learning, models are trained using labeled
datasets, whereas unsupervised learning focuses on
training with unlabeled data, with the goal of iden-
tifying anomalies based on patterns without any pre-
defined labels. In this study, we have used both types
of approaches. Here, we present a summary of the
methods applied:
3.1 Supervised ML Methods
We used three supervised methods for anomaly detec-
tion: Logistic Regression (LR), Support Vector Ma-
chine (SVM), and Decision Tree (DT). The effective-
ness of supervised methods is greatly affected by the
quality and availability of the labeled dataset, as they
rely on labeled data for training purposes. Increasing
the amount of labeled data boosts the models’ abil-
ity to learn both typical and atypical patterns, which
in turn enhances their accuracy in identifying anoma-
lies.
Logistic Regression: Logistic Regression is a
commonly used classification algorithm, particularly
effective for binary tasks, especially in anomaly de-
tection. Using a sigmoid function, it determines the
likelihood of an instance being classified into a partic-
ular class. In the process of assessing new instances,
if the probability exceeds a specified threshold (com-
monly set at 0.5), the instance is classified as anoma-
lous; otherwise, it is considered normal.
Support Vector Machine: Support Vector Ma-
chine (SVM) is a supervised classification method
that aims to create an optimal hyperplane to separate
classes in a high-dimensional space. In anomaly de-
tection, the training data comprises event count vec-
tors along with their corresponding labels. If a new
instance is situated below the hyperplane, it is nor-
mal; if it is positioned above, then anomalous.
Decision Tree: A decision tree predicts results by
using a sequence of nodes that divide data according
to the most significant attribute, often using metric
such as information gain (Han et al., 2022). Begin-
ning with the root node, the data is partitioned until
a stopping criterion is reached, like having uniform
class instances. To classify a new instance, one nav-
igates the decision tree from the root to a leaf node,
which indicates the predicted class for that instance.
3.2 Unsupervised ML Methods
As previously mentioned, unsupervised methods are
ideal for real world settings where labeling is fre-
quently impractical. In this study, we used Princi-
pal Component Analysis (PCA), Isolation Forest (IF),
and Log Clustering (LC) to detect anomalies without
pre-labeled data, which allows greater scalability and
flexibility in anomaly detection.
PCA: Principal Component Analysis (PCA) is
a technique for reducing dimensionality that selects
key principal components to capture primary vari-
ations, reducing data to a lower-dimensional space.
Early research (Xu et al., 2009) on PCA for log-based
anomaly detection used event count vectors to iden-
tify patterns. The data was divided into a normal
space (Sn) with leading components and an anomaly
space (Sa) with others. If the calculated projection
length calculated on the anomaly space surpasses a
specified threshold, the log sequence is marked as an
anomaly.
Isolation Forest: Isolation Forest (IF) identi-
fies anomalies by leveraging their rarity, making
them easier to isolate through random partitioning.
This approach constructs a collection of Isolation
Trees (iTrees) where anomalies are identified by their
shorter average path lengths (Liu et al., 2008). In log-
based anomaly detection, each Isolation Forest tree
randomly selects an event count feature and value to
split the data, isolating unique patterns. Instances
with rare patterns show shorter average path lengths
and are isolated faster. To identify anomalies, the iso-
lation score of each instance is evaluated against a set
threshold: instances with lower scores are marked as
anomalies, while those with higher scores are consid-
ered normal.
Log Clustering: LogCluster organizes logs for
anomaly detection in two phases. First it converts log
sequences into event count vectors, categorizing them
as normal or abnormal, with each cluster represented
by a centroid vector stored in a knowledge base. In
the second phase, new vectors are compared to these
centroids. If the nearest centroid is within a thresh-
old distance, the vector joins that cluster; otherwise,
a new cluster is created. Anomalies are identified by
assessing the distance between a latest log sequence
and the corresponding vectors stored in the knowl-
edge base (Lin et al., 2016). If the closest distance
surpasses the threshold, the log sequence is catego-
rized as an anomaly.
3.3 Deep Learning Methods
To take advantage of neural networks for log
anomaly detection, various deep learning techniques
have been used which involves Recurrent Neural
Networks (RNN), Convolutional Neural Networks
(CNN), Transformers, etc. In this research, we
employed two methods: DeepLog and LogRobust.
DeepLog functions as an unsupervised model, identi-
IoTBDS 2025 - 10th International Conference on Internet of Things, Big Data and Security
144

fying patterns in log data to uncover anomalies with-
out requiring labeled inputs, whereas LogRobust is
a supervised model that employs labeled data to en-
hance anomaly detection.
DeepLog: DeepLog is a complex deep learning
model that detects log anomalies using LSTM net-
works and density clustering. The model captures
sequential dependencies between log events by rep-
resenting log messages by their log event indexes.
It functions through a predictive approach, acquiring
knowledge of the typical patterns found in log se-
quences. When a deviation from the established nor-
mal pattern takes place, it signals the occurrence as a
possible anomaly. This method successfully identifies
anomalies by forecasting and recognizing deviations
from anticipated log behaviors.
LogRobust: LogRobust is a supervised classifi-
cation deep neural network model designed to address
the challenges posed by the instability of logs result-
ing from noisy processing and logging systems. Un-
like other models that primarily rely on log counting
vectors for features, LogRobust converts log events
into semantic vectors. In this method a pre-trained
word2vec (Joulin, 2016) model was employed, in-
tegrated with TF-IDF weights to generate represen-
tation vectors for log templates. The semantic vec-
tors are subsequently input into an Attention-based
Bi-LSTM classification model designed to identify
anomalies. This approach has shown promising re-
sults in successfully addressing log instability.
4 EVALUATION STUDY
In this section, we discuss the dataset used, the ex-
periment setup, and the evaluation result of the ma-
chine learning and deep learning methods. We also
present a comparison to a public dataset and assess
each model’s efficiency, highlighting their compara-
tive performance.
4.1 Experiment Design
4.1.1 Log Dataset
The dataset we used in this experiment is composed of
system logs that have been manually extracted from
a SCiNe device. The logs document system activ-
ities, encompassing boot messages, kernel updates,
and hardware events. A total of 30,730 log messages
were gathered during a 14-hour timeframe, represent-
ing the complex pattern of real-world system logs.
Every log entry contains details like the date, time,
device name, and the content of the message.
Table 1: Log Parser Performance.
Log Parser Name
Time Taken
(sec)
# of Event
Templates
LenMa
(Clustering)
40.881 15646
Drain
(Log Structured Heuristics)
3.445 253
AEL
(Log Structured Heuristics)
4.151 252
Spell
(Longest Common Subsequence)
4.263 347
Subsequently, the logs were manually labeled as
either normal or anomalous in collaboration with do-
main experts. The manual labeling ensured that the
labels accurately reflected the operational behavior of
the system. The dataset, however, showed a notable
class imbalance, containing merely 184 anomalous
messages (less than 1% of the dataset), which presents
a fundamental challenge for anomaly detection mod-
els.
This work was specifically designed for the con-
text of the BusPas system, providing a detailed per-
spective that is frequently lacking in large-scale stud-
ies. While based on a limited dataset, this study pro-
vides valuable insights into log-based anomaly detec-
tion methods, highlighting their applicability to more
extensive datasets. Furthermore, the manual labeling
process establishes a solid basis for handling propri-
etary and domain-specific logs, effectively addressing
gaps often present in current large-scale studies.
4.1.2 Experiment Setup
In our experiment, we preprocess the log data and
conduct anomaly detection method as follows:
Log Parsing: We made use of various log pars-
ing techniques to transform the unstructured logs
into structured log templates. We used four parsers:
LenMa, Drain, AEL, and Spell, from the toolkit Log-
Parser (Zhu et al., 2019). Among these, Drain demon-
strated the highest levels of accuracy and efficiency.
The performance of each parser is illustrated in Ta-
ble 1.
Log Grouping and Feature Extraction: We em-
ployed fixed and sliding window techniques for log
grouping in our dataset, as the lack of identifiers ex-
cluded the session window approach. A log sequence,
in this context, denotes a set of log templates that exist
within a defined time frame. The window size varied
from 10 minutes to 1 minute, with step sizes ranging
from 5 to 0.5 minutes, based on the particular experi-
ment.
After grouping the logs, we converted the se-
quences into numerical feature vectors. For each ma-
chine learning model, we generated quantitative vec-
tors (event count vectors), marking a log sequence
A Comparative Study of Log-Based Anomaly Detection Methods in Real-World System Logs
145

Table 2: Log Sequence Summary.
Window Size
10 min 7 min 5 min 3 min 1 min
Total: 84 instances,
53 anomaly, 31 normal
Total: 119 instances,
63 anomaly, 56 normal
Total: 167 instances,
68 anomaly, 99 normal
Total: 278 instances,
70 anomaly, 208 normal
Total: 833 instances,
89 anomaly, 744 normal
Step Size
5 min 3 min 2 min 1 min 0.5 min
Total: 165 instances,
68 anomaly, 97 normal
Total: 276 instances,
71 anomaly, 205 normal
Total: 414 instances,
77 anomaly, 337 normal
Total: 830 instances,
91 anomaly, 739 normal
Total: 1663 instances,
111 anomaly, 1552 normal
as anomalous if any log messages were classified as
abnormal. For DeepLog, log sequences were trans-
formed into sequential vectors by indexing each log
event, while for LogRobust we used the established
method to convert log sequences into semantic vec-
tors.
Table 2 presents the number of sequences pro-
duced for each combination of window and step sizes.
In the fixed window setting with a window size of 5
minutes, a total of 167 log sequences were produced,
with 68 identified as anomalous and 99 classified as
normal. In contrast, using the sliding window ap-
proach with a 5-minute window size and a step size
of 2 minutes, a total of 414 sequences were produced,
which included 77 anomalous sequences and 337 nor-
mal sequences. The increased number of sequences
in the sliding window approach is due to the overlap
between consecutive windows, leading to more com-
prehensive groupings.
Anomaly Detection: During this phase,various
machine learning and deep learning techniques were
trained using the features obtained in the prior step,
each following its specific methodology. The dataset
was split into 80% for training purposes and 20% for
testing purposes. In the case of unsupervised meth-
ods, labels were omitted from the training data, since
these methods do not need labeled data for the learn-
ing process.
All experiments were carried out on a machine
featuring an 11th Gen Intel(R) Core(TM) i7-1185G7
Processor @ 3.00GHz and 16 GB of RAM. The pa-
rameters for each method were meticulously adjusted
to guarantee peak performance. Each model under-
went several iterations, with the most favorable out-
comes being documented.
4.1.3 Evaluation Metrics
We evaluated the accuracy of the method through Pre-
cision, Recall, Specificity, and F-measure, given that
log-based anomaly detection is a binary classification
task. Precision measures the proportion of correctly
identified anomalies compared to the total instances
that the model categorizes as anomalies. Recall evalu-
ates how accurately true anomalies are identified from
the overall count of actual anomalies. Specificity de-
notes the proportion of correctly recognized normal
sequences compared to the overall count of genuine
normal sequences. The F1-score serves as the har-
monic mean of precision and recall, providing a well-
rounded evaluation of model performance.
Precision =
TruePositive
TruePositive + FalsePositive
Recall =
TruePositive
TruePositive + FalseNegative
Speci f icity =
TrueNegative
TrueNegative + FalsePositive
F − measure =
2 ∗ Precison ∗ Recall
Precison + Recall
True Positive (TP) denotes the count of anoma-
lies that the model accurately detects, whereas True
Negative (TN) indicate the normal log sequences that
are accurately recognized as normal. A False Posi-
tive (FP) occurs when the model mistakenly identi-
fies normal log sequences as anomalies, while False
Negatives (FN) refers to the actual anomalies that the
model fails to detect.
4.2 Performance of Anomaly Detection
Methods
In this section, we discuss the performance of ma-
chine learning (ML) and deep learning (DL) models
with respect to their accuracy. The findings are de-
tailed for three supervised machine learning models,
three unsupervised machine learning models, and two
deep learning models, examined across different win-
dow configurations. Every set of models is examined
thoroughly to emphasize their strengths, limitations,
and adaptability to various experimental conditions.
In conclusion, we present a brief overview of the per-
formance trends noted for each category of models.
IoTBDS 2025 - 10th International Conference on Internet of Things, Big Data and Security
146

Table 3: Accuracy of Supervised Methods.
Fixed Window
Model WS 10 min 7 min 5 min 3 min 1 min
LR P 1 1 1 1 1
R 0.636 0.923 0.929 0.857 0.889
S 1 1 1 1 1
F1 0.778 0.96 0.963 0.923 0.941
SVM P 1 1 1 1 1
R 0.909 0.923 0.929 1 0.944
S 1 1 1 1 1
F1 0.952 0.96 0.963 1 0.971
DT P 1 1 1 1 1
R 0.909 0.923 0.929 1 0.889
S 1 1 1 1 1
F1 0.952 0.96 0.963 1 0.941
Sliding Window
Model
WS,
SS
10 min,
5 min
7 min,
3 min
5 min,
2 min
3 min,
1 min
1 min,
0.5 min
LR P 1 1 1 1 1
R 0.929 0.867 0.813 0.895 0.957
S 1 1 1 1 1
F1 0.963 0.929 0.897 0.944 0.978
SVM P 1 1 1 1 1
R 0.929 0.8 0.938 0.947 0.957
S 1 1 1 1 1
F1 0.963 0.889 0.968 0.973 0.978
DT P 1 1 1 1 1
R 0.929 0.8 0.875 0.947 0.913
S 1 1 1 1 1
F1 0.963 0.889 0.933 0.973 0.955
4.2.1 Accuracy of Supervised ML Methods
In supervised methods, while splitting the dataset
we balanced positive and negative samples to mini-
mize bias and enhance the models’ ability to iden-
tify both normal and anomalous logs. All three
methods—Logistic Regression, SVM, and Deci-
sion Tree—exhibited perfect precision and specificity
across both fixed and sliding windows, with no false
positives in any configuration. However, recall varied
based on the type and size of the window. Results are
shown in Table 3.
In fixed windows, Logistic Regression (LR)
shows improved recall as the window size decreases,
indicating that smaller windows capture more anoma-
lies. SVM performs reliably but experiences a slight
decline in recall with larger windows (e.g., 10 and
7 minutes). However, it improves with smaller win-
dows, enhancing both recall and F1 scores. The De-
cision Tree (DT) behaves similarly to SVM but has
slightly lower recall with larger windows. It excels at
a 3-minute window, achieving perfect test results.
Sliding windows increase the number of in-
stances by overlapping consecutive windows, enhanc-
ing models’ ability to detect patterns and anomalies.
However, the step size is critical for accurate detec-
tion. LR and SVM consistently perform well, par-
ticularly with smaller windows and step sizes in de-
tailed and imbalanced data. In contrast, Decision
Tree shows variability in recall and F1 scores, fac-
ing more challenges in generalization compared to
LR and SVM. As window and step sizes decrease,
all models improve, but LR and SVM exhibit greater
robustness in handling imbalanced datasets and iden-
tifying anomalies.
In summary, LR and SVM demonstrated impres-
sive adaptability across different experimental con-
ditions, successfully handling imbalanced data and
variations in window and step sizes with significant
consistency. Although there are challenges with gen-
eralization, DT’s remarkable performance in limited
anomaly detection situations highlights its potential
for targeted applications. The trends suggest that se-
lecting the optimal windowing strategy and step size
is crucial for improving the performance of super-
vised machine learning models in log-based anomaly
detection.
4.2.2 Accuracy of Unsupervised ML Methods
For unsupervised methods fixed and sliding window
techniques were used with the same parameters as
those applied in supervised methods. Although unsu-
pervised methods do not required labels for training,
we employed our labeled dataset during testing to as-
sess their performance.
PCA achieves perfect precision and specificity
with fixed windows, avoiding false positives, but
missing many true anomalies due to low recall. Isola-
tion Forest (IF) maintains high precision and speci-
ficity across most window sizes but struggles with
smaller windows, leading to more false positives and
reduced recall. In contrast, LogClustering (LC) offers
a better balance between precision and recall, partic-
ularly excelling with smaller window sizes. Although
its precision and specificity are slightly lower than
PCA and Isolation Forest, LogClustering achieves the
highest F1 scores with shorter windows, demonstrat-
ing better adaptability in a detailed fixed window con-
text.
In sliding windows, PCA shows improved recall
with smaller window and step sizes, achieving a re-
call of 0.9 with a 5-minute window and 2-minute
step, though precision drops. Isolation Forest main-
tains high precision, particularly in larger windows,
but its recall is limited, while performance declines in
smaller settings. LogClustering displays more vari-
ability; it achieves high recall in some configura-
tions (e.g., W=7, S=3) but had lower precision. This
suggests LogClustering is more effective at detecting
anomalies, but with increased false positives in de-
tailed configurations. Table 4 represents the results.
In summary, PCA demonstrates strong precision
and specificity, while it faces challenges in identify-
A Comparative Study of Log-Based Anomaly Detection Methods in Real-World System Logs
147

Table 4: Accuracy of Unsupervised Methods.
Fixed Window
Model WS 10 min 7 min 5 min 3 min 1 min
PCA P 1 1 1 1 1
R 0.286 0.25 0.222 0.222 0.25
S 1 1 1 1 1
F1 0.444 0.4 0.364 0.364 0.4
IF P 1 1 1 1 0.25
R 0.286 0.25 0.222 0.222 0.083
S 1 1 1 1 0.981
F1 0.444 0.4 0.364 0.364 0.125
LC P 0.333 0.364 0.333 0.25 0.083
R 0.571 0.5 0.667 0.778 0.583
S 0.2 0.563 0.52 0.553 0.503
F1 0.421 0.421 0.444 0.378 0.145
Sliding Window
Model
WS,
SS
10 min,
5 min
7 min,
3 min
5 min,
2 min
3 min,
1 min
1 min,
0.5 min
PCA P 1 1 0.161 1 0.333
R 0.222 0.182 0.909 0.25 0.308
S 1 1 0.278 1 0.975
F1 0.364 0.308 0.274 0.4 0.32
IF P 1 1 1 0.333 0.2
R 0.222 0.182 0.182 0.083 0.23
S 1 1 1 0.987 0.966
F1 0.364 0.308 0.308 0.133 0.222
LC P 0.375 0.32 0.2 0.071 0.073
R 0.667 0.727 0.636 0.5 0.462
S 0.583 0.622 0.625 0.494 0.763
F1 0.48 0.444 0.311 0.125 0.126
ing true anomalies. Isolation Forest excels with larger
windows but struggles with intricate configurations.
LogClustering strikes an impressive balance, demon-
strating excellence in recall and F1 scores, although
it requires meticulous tuning to reduce false positives.
These trends highlight the importance of choosing the
right method according to the particular needs of the
anomaly detection task, including an appropriate bal-
ance between precision and recall.
4.2.3 Accuracy of DL Methods
DeepLog shows reliable recall and F1-scores in larger
fixed windows (10-minute and 7-minute), empha-
sizing its ability to capture long-term dependencies.
Nonetheless, its performance diminishes in smaller
windows, revealing constraints in managing intricate
patterns, although it attains greater specificity in these
instances. This indicates that DeepLog is more appro-
priate for situations that demand a wider contextual
comprehension instead of detailed anomaly detection.
In comparison, LogRobust consistently surpasses
DeepLog in all fixed window settings, attaining flaw-
less recall, precision, and specificity at the 5-minute
window. This emphasizes LogRobust’s flexibility
with different window sizes and its capability to man-
age imbalanced datasets efficiently.
In sliding windows, DeepLog enhances specificity
and F1-score with a 7-minute window and a 5-minute
Table 5: Accuracy of Deep Learning Methods.
Fixed Window
Model WS 10 min 7 min 5 min 3 min
DeepLog P 0.75 0.727 0.6 0.692
R 0.857 1 0.75 1
S 0.8 0.812 0.84 0.913
F1 0.8 0.842 0.667 0.818
LogRobust P 0.778 0.889 1 0.75
R 1 1 1 1
S 0.8 0.938 1 0.935
F1 0.875 0.941 1 0.857
Sliding Window
Model
WS,
SS
10 min,
5 min
7 min,
3 min
5 min,
2 min
3 min,
1 min
DeepLog P 0.667 0.75 0.75 0.355
R 0.923 1 0.273 0.393
S 0.684 0.833 0.966 0.851
F1 0.774 0.857 0.4 0.373
LogRobust P 0.867 0.9 1 1
R 1 1 1 0.964
S 0.895 0.944 1 1
F1 0.927 0.947 1 0.982
step size, yet its effectiveness declines with smaller
window configurations, highlighting difficulties in de-
tecting overlapping anomalies. Conversely, LogRo-
bust demonstrates outstanding performance in sliding
window configurations, exceeding its fixed window
capabilities and exhibiting remarkable recall and pre-
cision across various step sizes. The adaptability of
LogRobust establishes it as a dependable approach for
identifying anomalies in both fixed and sliding config-
urations, especially in thorough analyses.
In summary, although DeepLog demonstrates ad-
vantages in extensive windows and wider contexts,
LogRobust stands out as the more resilient and flex-
ible model, achieving better outcomes across diverse
experimental scenarios. The results highlight the sig-
nificance of choosing deep learning methods tailored
to the particular needs of anomaly detection tasks.
The results are presented in Table 5.
4.3 Comparison with Public Dataset
We evaluated the accuracy of each method used
on our small-scale dataset against their performance
on the publicly available HDFS dataset (Xu et al.,
2009). The HDFS dataset is composed of 575,061
log blocks, with 16,838 blocks (2.9%) identified as
anomalous (Du et al., 2017). The benchmark re-
sults for these methods were obtained using the HDFS
dataset, employing a session windowing approach for
log grouping. To facilitate a meaningful comparison,
we showcased the optimal results of each method on
our small dataset, utilizing specific window types and
sizes, as illustrated in Table 6 . This comparison un-
covers several important insights:
IoTBDS 2025 - 10th International Conference on Internet of Things, Big Data and Security
148
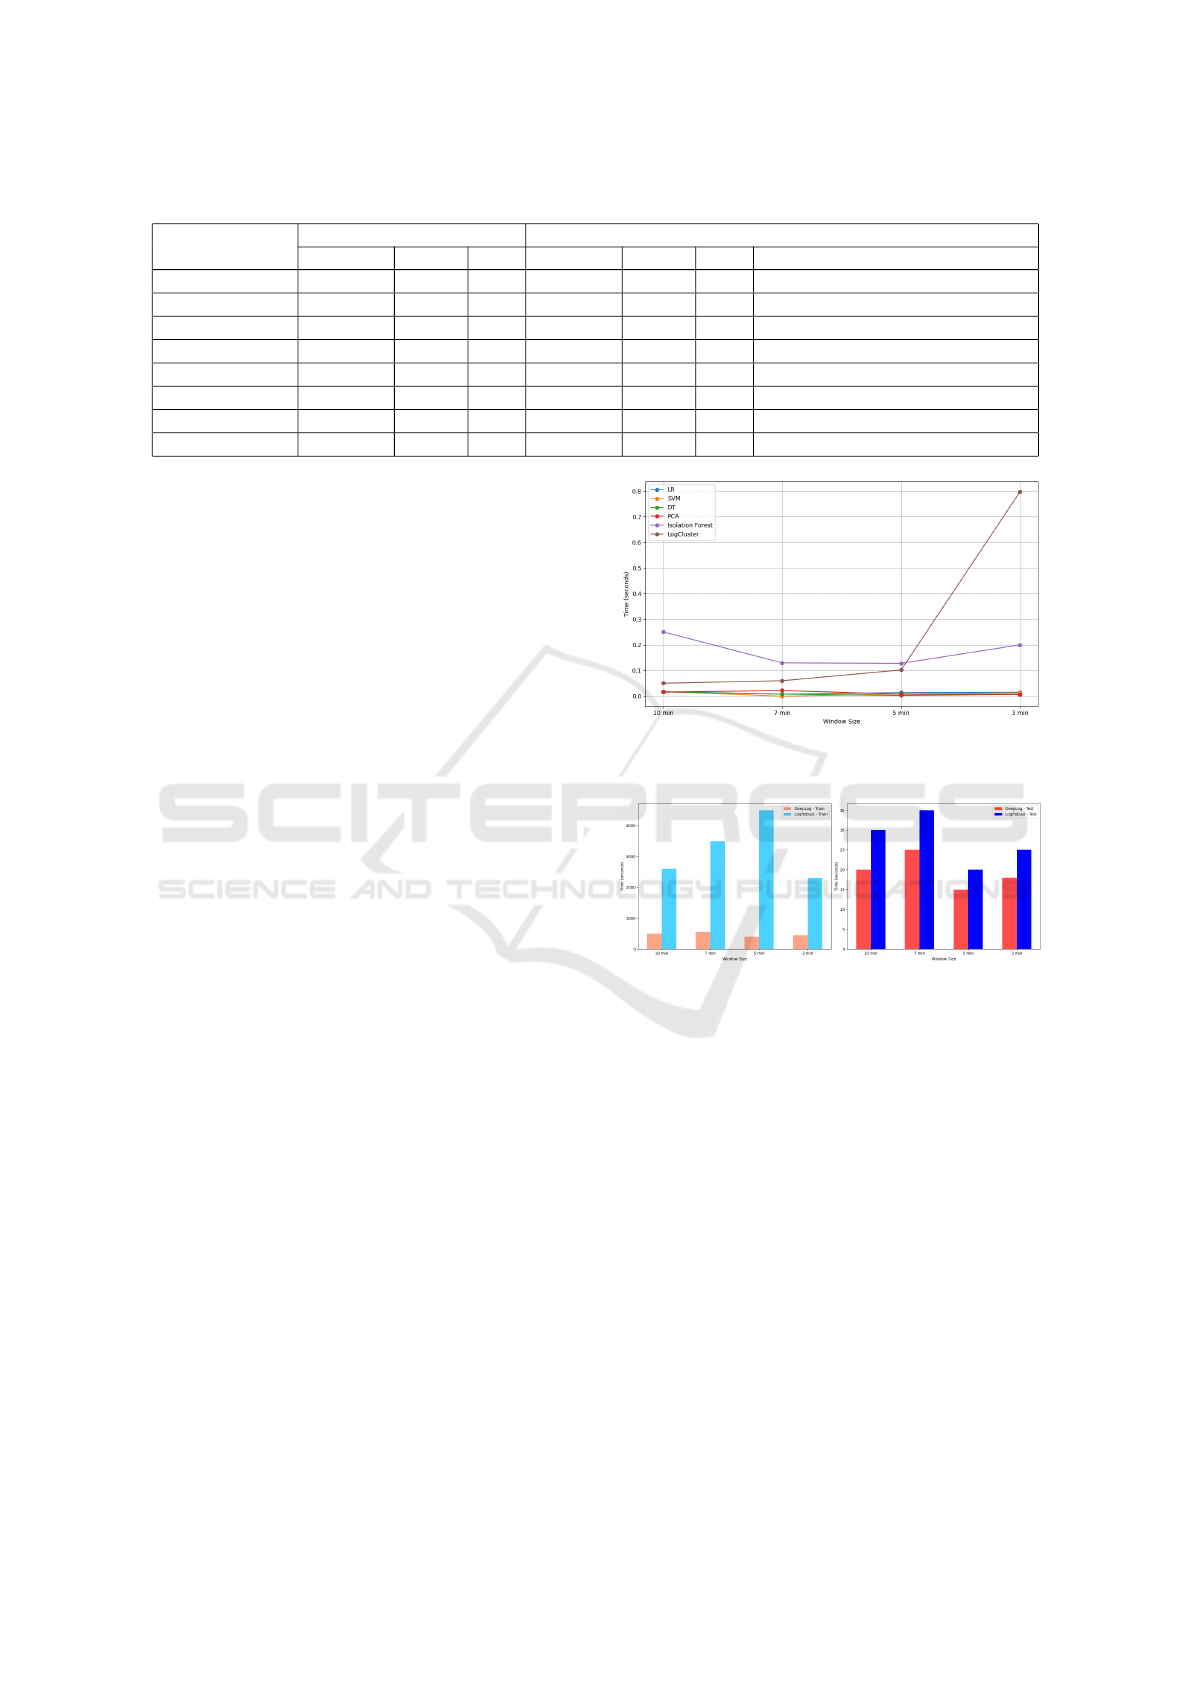
Table 6: Comparison with Public Dataset.
Model HDFS Dataset Private Dataset
Precision Recall F1 Precision Recall F1 Window Type
LR 0.95 1 0.98 1 0.96 0.98 Sliding (WS: 1 min, SS: 0.5 min)
Decision Tree 1 0.99 1 1 0.95 0.97 Sliding (WS: 3 min, SS: 1 min)
SVM 0.95 1 0.98 1 1 1 Fixed (WS: 3 min)
PCA 0.98 0.67 0.79 1 0.29 0.44 Fixed (WS: 10 min)
Isolation Forest 0.83 0.78 0.8 1 0.29 0.44 Fixed (Window Size: 10 min)
LogClustering 0.87 0.74 0.8 0.32 0.73 0.44 Sliding (WS: 7 min, SS: 3 min)
DeepLog 0.95 0.96 0.96 0.9 1 0.95 Sliding (WS: 7 min, SS: 3 min)
LogRobust 0.98 1 0.99 1 1 1 Fixed (WS: 5 min)
The outcomes of supervised methods applied to
our limited dataset are remarkably close to, and in
some cases better than, the benchmark results on the
HDFS dataset. This emphasizes the capability of
a properly labeled dataset, regardless of its size, to
achieve similar accuracy.
In contrast, the performance of unsupervised mod-
els was notably lower when compared to the HDFS
dataset. This indicates that unsupervised methods
need a more extensive dataset to successfully catego-
rize data and detect anomalies, as their effectiveness
is significantly dependent on the presence of varied
patterns and an adequate amount of data.
Both deep learning methods excelled on our small
dataset, showcasing impressive accuracy even with
the restricted data size. This suggests that deep
learning models, especially those utilizing sequential
and semantic patterns, can adjust well to small-scale
datasets while maintaining performance levels.
This study further confirms that log-based
anomaly detection methods can be adapted to datasets
of different sizes, opening up possibilities for their use
in both small-scale and large-scale systems.
4.4 Efficiency of Anomaly Detection
Methods
Efficiency measures how quickly a model can per-
form anomaly detection. We assess this efficiency by
tracking the running time required for the anomaly
detector during both the training and testing phases.
Figure 2 shows that supervised machine learning
methods maintain low processing times across differ-
ent window sizes, with Decision Tree (DT) being the
fastest. This indicates that supervised methods are ef-
ficient and stable despite changes in window size. In
contrast, most unsupervised methods have longer pro-
cessing times, although PCA performs comparably
to the supervised methods. Isolation Forest has the
longest processing time overall, while LogClustering
slows down significantly with smaller window sizes,
Figure 2: Running time of ML methods with varying win-
dow size.
Figure 3: Efficiency of Deep Learning methods.
highlighting the greater computational demands of
these methods, especially with larger log sequences.
In deep learning, DeepLog demonstrates impres-
sive training times, achieving the shortest duration in
the 5-minute window and maintaining efficient test-
ing capabilities. In contrast, LogRobust has sig-
nificantly longer training times, especially in the 5-
minute window, but outperforms DeepLog in testing
speed. While DeepLog is more efficient in training,
LogRobust may offer advantages for specific perfor-
mance needs, particularly for faster inference during
testing. Figure 3 illustrates these results.
5 DISCUSSION
This study provides a comparative evaluation of su-
pervised, unsupervised, and deep learning techniques
A Comparative Study of Log-Based Anomaly Detection Methods in Real-World System Logs
149

for log-based anomaly detection using real-world
data. Although the findings offer valuable insights,
certain aspects require further discussion, particularly
regarding dataset limitations, comparative evaluation,
and model efficiency. This section discusses the lim-
itations of our study and suggests possible directions
for future research.
Addressing Dataset Constraints: One primary
limitation of this study is the relatively small dataset,
which could affect the generalizability of the results
to larger systems. Our comparison with the publicly
available datasets shows that the performance trends
in our dataset are consistent with those found in larger
datasets. This indicates that our findings, despite be-
ing derived from a restricted dataset, continue to be
relevant and insightful. Moreover, our dataset cap-
tures real-world limitations such as the lack of labeled
data and unstructured log formats, making it relevant
for practical applications. In the future, we will focus
on broadening the scope of our study by integrating
more extensive datasets that feature a larger volume
and diversity of log messages.
Comparative Evaluation of Methods: Our anal-
ysis shows the key trade-offs between different
anomaly detection methods. Supervised methods
such as logistic regression, SVM, and Decision Tree
demonstrated impressive accuracy when there was ac-
cess to labeled data; however, they tend to be less ef-
fective in real-world scenarios where labeled anoma-
lies are limited. Unsupervised methods such as PCA
and Isolation Forest identified anomalies without the
need for labeled data, yet they exhibited variability in
both precision and recall, especially when employing
various windowing techniques. Deep learning mod-
els (LogRobust) achieved the optimal precision-recall
balance, though they demanded significant computa-
tional resources and extended training time.
The findings indicate that the selection of method
is contingent upon the particular needs of the system.
For scenarios that require real-time detection, conven-
tional machine learning models, such as SVM and
Decision Tree, provide quick and reliable options. In
situations where there are limited labeled data, unsu-
pervised methods such as LogClustering can be em-
ployed, although they necessitate careful parameter
tuning to minimize false positives. Deep learning
models like LogRobust provide exceptional perfor-
mance, yet they might be better suited for batch pro-
cessing or environments with ample computational
resources.
Timeliness and Efficiency of Approaches: Ef-
ficiency plays a vital role in anomaly detection, es-
pecially in the context of real-time applications. Our
evaluation indicates that Decision Tree and SVM de-
mand considerably less processing time, making them
appropriate for real-time anomaly detection. Con-
versely, deep learning models, especially LogRobust,
requires extended training periods yet, provide en-
hanced accuracy. The findings indicate that in in-
dustrial environments, lightweight ML models might
be more suitable for real-time monitoring, while deep
learning techniques offer enhanced accuracy for de-
tecting anomalies in historical log analysis.
Future Work: Future research will aim to
broaden the dataset and integrate semi-supervised
learning methods to lessen the reliance on manual la-
beling, thus enhancing efficiency. Furthermore, the
integration of various feature representations, such as
the combination of sequential and semantic vectors,
could enhance detection performance even more by
capturing more complex data patterns. We also plan
to investigate additional techniques like invariant min-
ing (Lou et al., 2010), LogAnomaly (Meng et al.,
2019), and CNN (Lu et al., 2018) to assess model ef-
fectiveness across a broader range of methods. Addi-
tionally, we aim to deploy the most effective method
for real-world anomaly detection.
In summary, this study provides a foundation for
understanding the trade-offs among various anomaly
detection methods and offers valuable insights into
their relevance for real-world log analysis. The find-
ings highlight the significance of choosing models
that align with system constraints, computational ef-
ficiency, and the availability of data.
6 RELATED WORK
Log-based anomaly detection (Nandi et al., 2016, Bao
et al., 2018, He et al., 2018, Nedelkoski et al., 2020,
Wang et al., 2020) has experienced notable progress
in multiple areas, such as distributed systems, cloud
environments, and so on. The exploration within this
domain has encompassed conventional log mining,
machine learning, and, more recently, deep learning
methodologies. The main approaches for log-based
anomaly detection can be classified into supervised
learning, unsupervised learning, and deep learning
techniques.
Techniques of supervised learning have frequently
been used in the detection of log anomalies. For in-
stance, decision trees (Chen et al., 2004) have been
used to pinpoint anomalies in extensive internet-based
settings, while SVM (Liang et al., 2007) classifiers
have been employed to uncover failures within event
logs. Regression-based methods have been investi-
gated for analyzing cloud resource logs and identify-
ing abnormalities (He et al., 2018).
IoTBDS 2025 - 10th International Conference on Internet of Things, Big Data and Security
150

Unsupervised techniques do not rely on labeled
data, which enhances their flexibility in handling real-
world datasets. For example, the Isolation Forest (Liu
et al., 2008) utilizes isolation principles to identify
outliers, whereas PCA (Xu et al., 2009) was one of the
initial techniques developed for extracting system is-
sues from console logs. Invariant Mining (Lou et al.,
2010) is a significant approach that identifies linear
associations among log events derived from log event
count vectors, facilitating effective anomaly detec-
tion. The control flow graphs serve to represent a sys-
tem’s typical execution paths, with anomalies being
flagged when transition probabilities or sequences di-
verge from these learned models (Nandi et al., 2016).
The emergence of deep learning has brought sev-
eral novel methods for detecting anomalies based on
log data. The DeepLog (Du et al., 2017) model
uses LSTM models to forecast anomalies in log se-
quences by recognizing key patterns. It uses LSTM
in an unsupervised manner to predict the next log
event. LogAnomaly (Meng et al., 2019) improves
log stability by merging sequential and quantitative
patterns and semantic information. A probabilistic la-
bel estimation technique, integrated with an attention-
based GRU neural network, was developed to ad-
dress label scarcity (Yang et al., 2021). Additionally,
other approaches, such as CNN-based anomaly de-
tection (Lu et al., 2018), Transformer-based architec-
tures (Nedelkoski et al., 2020), LSTM-based GANs
(Xia et al., 2021), and BERT (Guo et al., 2021), have
also been explored for their effectiveness in anomaly
detection.
7 CONCLUSIONS
Logs are crucial for ensuring the reliability and secu-
rity of modern devices, but their volume and complex-
ity pose significant challenges for anomaly detection.
Most existing research relies on public datasets and
static environments, limiting insights into real-world
effectiveness. Our paper provides a comparative anal-
ysis of machine learning and deep learning techniques
for log-based anomaly detection using a real-world
dataset. We assess the performance of these methods
through various metrics and analyze computational
efficiency. Our findings reveal that performance is
heavily influenced by window settings, with super-
vised methods like SVM and LogRobust achieving
the highest accuracy, making SVM the most efficient
overall.
ACKNOWLEDGEMENTS
This research was conducted in collaboration with
BusPas Inc. and Mitacs Accelerate Program, and we
sincerely appreciate their support in providing access
to data and resources. We would also like to thank
Wissem Maazoun and his team for their valuable in-
sights and assistance throughout this study.
REFERENCES
([Accessed: 28 October 2024]). Real-world applications for
remarkable innovations [Use Cases]. https://buspas.
com/.
Bao, L., Li, Q., Lu, P., Lu, J., Ruan, T., and Zhang, K.
(2018). Execution anomaly detection in large-scale
systems through console log analysis. Journal of Sys-
tems and Software, 143:172–186.
Bodik, P., Goldszmidt, M., Fox, A., Woodard, D. B., and
Andersen, H. (2010). Fingerprinting the datacenter:
automated classification of performance crises. In
Proceedings of the 5th European conference on Com-
puter systems, pages 111–124.
Chen, M., Zheng, A. X., Lloyd, J., Jordan, M. I., and
Brewer, E. (2004). Failure diagnosis using deci-
sion trees. In International Conference on Autonomic
Computing, 2004. Proceedings., pages 36–43. IEEE.
Chen, Z., Liu, J., Gu, W., Su, Y., and Lyu, M. R.
(2021). Experience report: Deep learning-based sys-
tem log analysis for anomaly detection. arXiv preprint
arXiv:2107.05908.
Du, M. and Li, F. (2016). Spell: Streaming parsing of
system event logs. In 2016 IEEE 16th International
Conference on Data Mining (ICDM), pages 859–864.
IEEE.
Du, M., Li, F., Zheng, G., and Srikumar, V. (2017).
Deeplog: Anomaly detection and diagnosis from sys-
tem logs through deep learning. In Proceedings of the
2017 ACM SIGSAC conference on computer and com-
munications security, pages 1285–1298.
Guo, H., Yuan, S., and Wu, X. (2021). Logbert: Log
anomaly detection via bert. In 2021 international joint
conference on neural networks (IJCNN), pages 1–8.
IEEE.
Hamooni, H., Debnath, B., Xu, J., Zhang, H., Jiang, G.,
and Mueen, A. (2016). Logmine: Fast pattern recog-
nition for log analytics. In Proceedings of the 25th
ACM international on conference on information and
knowledge management, pages 1573–1582.
Han, J., Pei, J., and Tong, H. (2022). Data mining: concepts
and techniques. Morgan kaufmann.
He, P., Zhu, J., Zheng, Z., and Lyu, M. R. (2017). Drain: An
online log parsing approach with fixed depth tree. In
2017 IEEE international conference on web services
(ICWS), pages 33–40. IEEE.
He, S., Lin, Q., Lou, J.-G., Zhang, H., Lyu, M. R., and
Zhang, D. (2018). Identifying impactful service sys-
tem problems via log analysis. In Proceedings of the
A Comparative Study of Log-Based Anomaly Detection Methods in Real-World System Logs
151

2018 26th ACM joint meeting on European software
engineering conference and symposium on the foun-
dations of software engineering, pages 60–70.
He, S., Zhu, J., He, P., and Lyu, M. R. (2016). Experi-
ence report: System log analysis for anomaly detec-
tion. In 2016 IEEE 27th international symposium on
software reliability engineering (ISSRE), pages 207–
218. IEEE.
Joulin, A. (2016). Fasttext. zip: Compressing text classifi-
cation models. arXiv preprint arXiv:1612.03651.
Le, V.-H. and Zhang, H. (2022). Log-based anomaly detec-
tion with deep learning: How far are we? In Proceed-
ings of the 44th international conference on software
engineering, pages 1356–1367.
Liang, Y., Zhang, Y., Xiong, H., and Sahoo, R. (2007). Fail-
ure prediction in ibm bluegene/l event logs. In Sev-
enth IEEE International Conference on Data Mining
(ICDM 2007), pages 583–588. IEEE.
Lin, Q., Zhang, H., Lou, J.-G., Zhang, Y., and Chen, X.
(2016). Log clustering based problem identification
for online service systems. In Proceedings of the
38th International Conference on Software Engineer-
ing Companion, pages 102–111.
Liu, F. T., Ting, K. M., and Zhou, Z.-H. (2008). Isolation
forest. In 2008 eighth ieee international conference
on data mining, pages 413–422. IEEE.
Lou, J.-G., Fu, Q., Yang, S., Xu, Y., and Li, J. (2010). Min-
ing invariants from console logs for system problem
detection. In 2010 USENIX Annual Technical Confer-
ence (USENIX ATC 10).
Lu, S., Wei, X., Li, Y., and Wang, L. (2018). Detect-
ing anomaly in big data system logs using convolu-
tional neural network. In 2018 IEEE 16th Intl Conf
on Dependable, Autonomic and Secure Computing,
16th Intl Conf on Pervasive Intelligence and Comput-
ing, 4th Intl Conf on Big Data Intelligence and Com-
puting and Cyber Science and Technology Congress
(DASC/PiCom/DataCom/CyberSciTech), pages 151–
158. IEEE.
Makanju, A. A., Zincir-Heywood, A. N., and Milios, E. E.
(2009). Clustering event logs using iterative partition-
ing. In Proceedings of the 15th ACM SIGKDD inter-
national conference on Knowledge discovery and data
mining, pages 1255–1264.
Meng, W., Liu, Y., Zhu, Y., Zhang, S., Pei, D., Liu, Y.,
Chen, Y., Zhang, R., Tao, S., Sun, P., et al. (2019).
Loganomaly: Unsupervised detection of sequential
and quantitative anomalies in unstructured logs. In
IJCAI, volume 19, pages 4739–4745.
Nandi, A., Mandal, A., Atreja, S., Dasgupta, G. B., and
Bhattacharya, S. (2016). Anomaly detection using
program control flow graph mining from execution
logs. In Proceedings of the 22nd ACM SIGKDD inter-
national conference on knowledge discovery and data
mining, pages 215–224.
Nedelkoski, S., Bogatinovski, J., Acker, A., Cardoso, J.,
and Kao, O. (2020). Self-attentive classification-based
anomaly detection in unstructured logs. In 2020 IEEE
International Conference on Data Mining (ICDM),
pages 1196–1201. IEEE.
Nedelkoski, S., Bogatinovski, J., Acker, A., Cardoso, J.,
and Kao, O. (2021). Self-supervised log parsing.
In Machine Learning and Knowledge Discovery in
Databases: Applied Data Science Track: European
Conference, ECML PKDD 2020, Ghent, Belgium,
September 14–18, 2020, Proceedings, Part IV, pages
122–138. Springer.
Shima, K. (2016). Length matters: Clustering system
log messages using length of words. arXiv preprint
arXiv:1611.03213.
Wang, J., Tang, Y., He, S., Zhao, C., Sharma, P. K., Alfarraj,
O., and Tolba, A. (2020). Logevent2vec: Logevent-to-
vector based anomaly detection for large-scale logs in
internet of things. Sensors, 20(9):2451.
Xia, B., Bai, Y., Yin, J., Li, Y., and Xu, J. (2021). Loggan: a
log-level generative adversarial network for anomaly
detection using permutation event modeling. Informa-
tion Systems Frontiers, 23:285–298.
Xu, W., Huang, L., Fox, A., Patterson, D., and Jordan,
M. I. (2009). Detecting large-scale system problems
by mining console logs. In Proceedings of the ACM
SIGOPS 22nd symposium on Operating systems prin-
ciples, pages 117–132.
Yang, L., Chen, J., Wang, Z., Wang, W., Jiang, J., Dong,
X., and Zhang, W. (2021). Semi-supervised log-based
anomaly detection via probabilistic label estimation.
In 2021 IEEE/ACM 43rd International Conference
on Software Engineering (ICSE), pages 1448–1460.
IEEE.
Zhang, X., Xu, Y., Lin, Q., Qiao, B., Zhang, H., Dang, Y.,
Xie, C., Yang, X., Cheng, Q., Li, Z., et al. (2019).
Robust log-based anomaly detection on unstable log
data. In Proceedings of the 2019 27th ACM joint meet-
ing on European software engineering conference and
symposium on the foundations of software engineer-
ing, pages 807–817.
Zhu, J., He, S., Liu, J., He, P., Xie, Q., Zheng, Z., and Lyu,
M. R. (2019). Tools and benchmarks for automated
log parsing. In 2019 IEEE/ACM 41st International
Conference on Software Engineering: Software En-
gineering in Practice (ICSE-SEIP), pages 121–130.
IEEE.
IoTBDS 2025 - 10th International Conference on Internet of Things, Big Data and Security
152
