
Anomalous IoT Behavior Detection by LSTM-Based Power Waveform
Prediction
Ryusei Eda and Nozomu Togawa
a
Department of Computer Science and Communications Engineering, Waseda University, Japan
Keywords:
Hardware Trojan, Power Analysis, Anomalous Behavior Detection, LSTM.
Abstract:
Internet of Things (IoT) devices have very rapidly spread out in recent years. In IoT devices where applications
run on operating system (OS), the power consumption of the OS and the power consumption of the applications
overlap, resulting in complex power waveform. Previous methods need to explicitly extract the application
power waveform from the multiple signal sources in the measured power waveform, which often fail to detect
anomalous behaviors. In this paper, we propose a method to detect anomalous behaviors by using LSTM (Long
Short Term Memory). The proposed method learns power waveform containing multiple signal sources and
compares the predicted waveform and the actual one. Then, we can successfully detect anomalous behaviors,
even though the measured power waveform is composed of multiple signal sources. Experimental results show
that anomalous behavior can be successfully detected from an IoT device built with Raspberry Pi4.
1 INTRODUCTION
In recent years, the rapid spread of IoT devices has in-
creased the demand for integrated circuits (ICs) with
more advanced and complex functions. As a result,
IC design and manufacturing processes are separated,
and the manufacturing process is often being out-
sourced in order to produce hardware devices inex-
pensively and efficiently. This has increased the risk
of a malicious third party in the supply chain inserting
hardware Trojans (Bhunia et al., 2014).
Hardware Trojans are circuits added to a hardware
device against the intention of the designer, caus-
ing anomalous behavior such as information leak-
age and/or performance degradation (Bhunia et al.,
2014). The use of components manufactured by third-
party vendors enables inexpensive and efficient de-
vice manufacturing, but third-party components are
at risk of having hardware Trojans. The hardware de-
sign and manufacturing can be divided into several
processes, including specification, design, and manu-
facturing, but it is pointed out that there is a risk of
hardware Trojans being inserted in all processes in-
volving third-party vendors (Francq and Frick, 2015).
It is an important issue how to detect hardware Tro-
jans. There are two ways for detecting hardware Tro-
jans: one is to detect them at the design stage (Jin and
a
https://orcid.org/0000-0003-3400-3587
Makris, 2008; Islam et al., 2013; Oya et al., 2015;
HaddadPajouh et al., 2018), and the other is to de-
tect them after manufacturing (Agrawal et al., 2007;
Chakraborty et al., 2009; Wang et al., 2013; Bhasin
et al., 2013; Zaza et al., 2020). However, not all hard-
ware Trojans can be detected at the design stage be-
cause it is not always possible to obtain design infor-
mation. Detecting anomalous behaviors of IoT de-
vices after manufacturing is important.
In order to detect anomalous behaviors of IoT
devices after manufacturing, there is one effective
method: side-channel analysis. Anomalous behaviors
are detected by analyzing side-channel information,
such as power consumption, based on the assumption
that anomalous behaviors like hardware Trojans can
affect side-channel information. There have been pro-
posed several methods to detect anomalous behavior
by measuring the power consumption as side-channel
information and based on the duration time of an ap-
plication program running and the amount of power
consumption (Hasegawa et al., 2018; Takasaki et al.,
2021a; Takasaki et al., 2021b). Based on the method
in (Hasegawa et al., 2018), the extended version is
proposed in (Takasaki et al., 2021b) to detect anoma-
lous behaviors by applying it to IoT devices with
steady-state power waveform.
The previous method (Takasaki et al., 2021a) sub-
tracts the power consumed regularly by the operat-
ing system (OS) and hardware (called steady-state
Eda, R. and Togawa, N.
Anomalous IoT Behavior Detection by LSTM-Based Power Waveform Prediction.
DOI: 10.5220/0013368900003944
Paper published under CC license (CC BY-NC-ND 4.0)
In Proceedings of the 10th International Conference on Internet of Things, Big Data and Security (IoTBDS 2025), pages 345-352
ISBN: 978-989-758-750-4; ISSN: 2184-4976
Proceedings Copyright © 2025 by SCITEPRESS – Science and Technology Publications, Lda.
345
power waveform) from the measured power wave-
form, and extracts and analyzes only the power con-
sumed by the application program (called application
power waveform), and detects anomalous behavior.
However, LSTM cannot well predict the steady-state
power waveform, included in the total power wave-
form and thus we cannot efficiently extract the ap-
plication power waveform sometimes. In addition,
this method partitions the application power wave-
form into sections, each of which corresponds to a
small operation, and does not consider a sequence of
these sections. Hence, inter-section anomalous be-
havior cannot be detected.
In this paper, we propose a method to detect
anomalous behavior from power waveforms includ-
ing the steady-state power waveform based on the dif-
ference between the waveform predicted by LSTM
and actual one. The proposed method firstly smooths
and normalizes the power waveforms measured from
IoT device. Then, it extracts fixed-length power
waveforms in a sliding window manner and trains
them using LSTM. The trained LSTM predicts the
power waveform of the IoT device. By taking the
difference between the predicted power waveform
and the actual one, we detect anomalous behaviors
by extracting the outliers of the difference using the
Hotelling theory (Hotelling, 1992). The proposed
method was applied to the IoT device built with Rasp-
berry Pi4. As a result, we can successfully detect the
anomalous behaviors.
The rest of this paper is organized as follows:
Section 2 summarizes several related works on IoT
device anomalous behavior detection and defines an
IoT device model; Section 3 describes the proposed
anomalous behavior detection method by LSTM-
based power waveform prediction; Section 4 explains
the experimented IoT device and Section 5 demon-
strates the experimental results; Section 6 concludes
the paper with several concluding remarks.
2 RELATED WORKS AND IoT
DEVICE MODEL
In this section, we introduce related researches on IoT
device anomalous behavior detection and define the
power consumption of the hardware device targeted
in this paper. Then, we discuss the challenges for de-
tecting anomalous behavior for the IoT device with
steady-state power waveform.
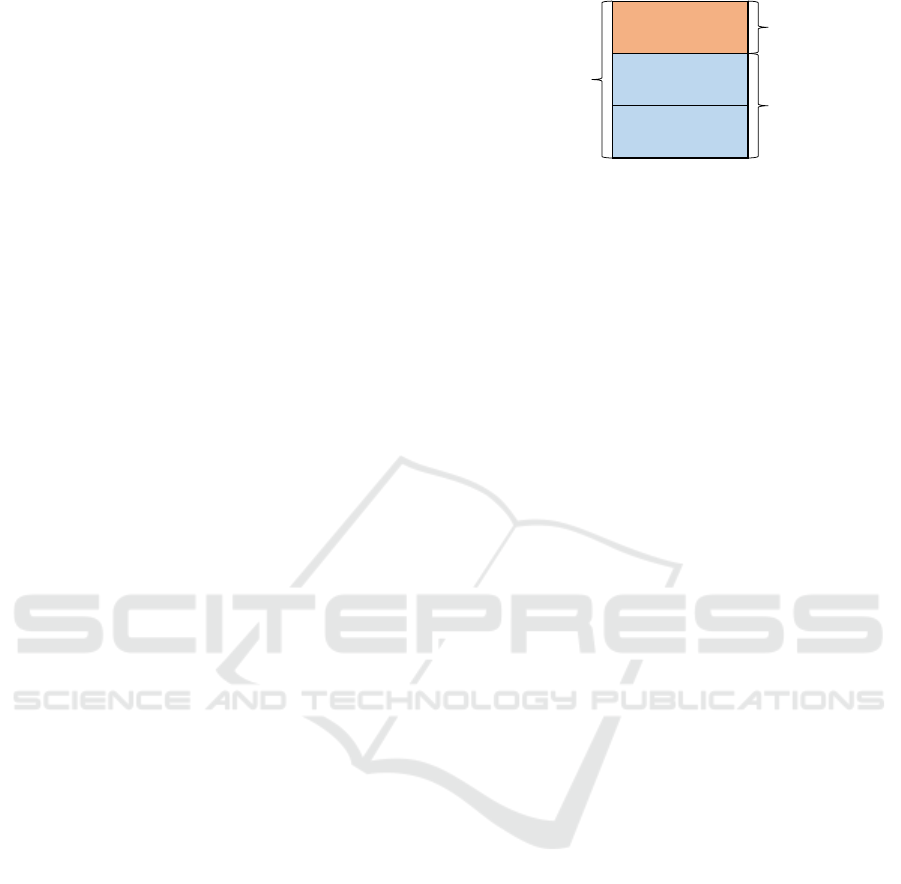
Application
OS
Hardware
𝑃
!""
𝑃
#$%!&'
𝑃
$($!)
Figure 1: Power consumption model of the IoT devices.
2.1 Related Works
Side-channel analysis is one of the effective methods
for detecting anomalous behavior of IoT devices. In
side-channel analysis, all components are assumed to
affect side-channel information such as power con-
sumption, delay, and electromagnetic waves, and
anomalous behavior of IoT devices is detected by an-
alyzing the changes of them. Side-channel analysis
is effective in detecting anomalous behavior in that it
can detect anomalous behavior without affecting the
output of the circuit and can be applied to microcon-
trollers and the software running on them (Wang et al.,
2013; Hasegawa et al., 2018; Takasaki et al., 2021b).
Wang et al. detect anomalous behavior of IoT de-
vices by comparing the power consumption of both
the model without anomalies (golden model) and the
target model (Wang et al., 2013). While their method
has good detection accuracy, it costs much money
and time to prepare the golden model. Hasegawa et
al. do not use a golden model and detect anomalous
behaviors based on the duration time of an application
program and power consumption (Hasegawa et al.,
2018). However, its detection accuracy cannot be-
come high enough sometimes.
Takasaki et al. (Takasaki et al., 2021a) subtracts
the steady-state power waveform from the measured
power and extracts only the application power wave-
form. LSTM is used to estimate the steady-state
power waveform. Since the input to the LSTM in-
cludes the data estimated previously, errors accumu-
late as the LSTM prediction proceeds. In addition, the
application power waveform is partitioned into sec-
tions, each of which corresponds to a small operation,
and the operation sequence is not taken into account.
Hence, inter-section anomalous behavior cannot be
detected.
2.2 IoT Device Model
In this paper, we assume a Raspberry Pi4 as an IoT
device and target it for anomalous behavior detection.
Figure 1 shows the power consumption model. As
stated in (Martinez et al., 2015), the power consump-
tion of the Raspberry Pi4 can be divided into three
IoTBDS 2025 - 10th International Conference on Internet of Things, Big Data and Security
346

parts: application part, OS part, and hardware part.
We assume that the effect of anomalous behavior
appears in the application power waveform. Let P
app
denote the power consumed by the application pro-
gram. The OS and hardware periodically perform rel-
atively small operations, and the power consumed by
them is called the steady-state power and is denoted
by P
steady
. Then, the total power due to P
app
and P
steady
is denoted by P
total
. P
total
can be represented by is a
time-series power data, which is defined P
total
= {p
i
}.
where p
i
represents the power value at time t
i
. Based
on the above, the application power waveform P
app
can be expressed as below:
P
app
= P
total
− P
steady
(1)
2.3 Challenges for Anomalous Behavior
Detection for IoT Devices with
Steady-State Power
In detecting anomalous behavior of IoT devices in-
cluding steady-state power waveform, anomalous be-
haviors have been so far detected by extracting the
application power waveform from a complex total
power waveform.
For example, the previous methods remove
the steady-state power waveform from the total
power waveform by averaging the measured steady-
state power waveform or by estimating it using
LSTM (Hasegawa et al., 2018; Takasaki et al.,
2021b). However, the steady-state power waveform
may not be removed accurately, in which case correct
anomalous behavior detection results cannot be ob-
tained. In addition, no method has been proposed to
remove effective steady-state power waveform.
The proposed method, on the other hand, does not
remove the steady-state power waveform, but instead
employs the strategy to effectively use LSTM to learn
the total power waveform to detect anomalous behav-
ior.
3 DETECTION OF ANOMALOUS
BEHAVIOR BY LSTM-BASED
POWER WAVEFORM
PREDICTION
In this section, we propose a method for detecting
anomalous behavior from power waveforms of IoT
devices by LSTM-based power waveform prediction.
The detailed flow is shown below:
Step 1 (Measure the Power Waveforms):
As a first step, we measure the power waveform run-
ning the target application programs on the IoT de-
vice. The measured power waveform P
′
total
is time-
series data. When the measured power value at time
t
i
is p
′
i
, P
′
total
= {p
′
i
}.
Step 2 (Smooth the Power Waveforms):
Measured power waveform is affected by noise and
contains fluctuations. Smoothing removes such noise
and fluctuations and makes it easier to capture the
shape characteristics of the measured power wave-
forms. The proposed method uses the KZ fil-
ter (Koopmans, 1995) as a smoothing method and ap-
plies a simple moving average twice. In this way, the
power waveform P
′
total
obtained in Step 1 is smoothed
and normalized. P
total
shows the smoothed and nor-
malized power waveform obtained in Step 2.
Step 3 (Training and Waveform Prediction for
LSTM):
In Step 3, we explain a method for predicting power
waveform using LSTM.
In LSTM, the input/output data are set as follows:
f [Hz]: Sampling frequency of the power data.
n
in
: The number of LSTM inputs.
n
out
: The number of LSTM outputs.
t
in
[s]: The length of time corresponding to n
in
.
t
out
[s]: The length of time corresponding to n
out
.
n
in
and n
out
can be re-written by
n
in
= f × t
in
(2)
n
out
= f × t
out
(3)
Step 3.1 (Training of LSTM):
In Step 3.1, total power waveform P
total
is learned by
LSTM.
LSTM is a type of recurrent neural net-
work (RNN) that can learn long term dependen-
cies such as time-series data (Al-Selwi et al., 2024).
Let p
i
be the power value at time t
i
of P
total
.
x
i
= (p
i
, p
i+1
,..., p
i+n
in
−1
) of length n
in
is the input
and y
i
= (p
i+n
in
, p
i+n
in
+1
,..., p
i+n
in
+n
out
−1
) of length
n
out
is the training data. The training data is prepared
by incrementing i by 1, and learned by LSTM. We use
MSE (Mean Squared Error) (Wang and Bovik, 2009)
for the loss function and train the LSTM so that the
output of the LSTM is the same as the training data. In
this way, when x
i
is input, the LSTM outputs a power
Anomalous IoT Behavior Detection by LSTM-Based Power Waveform Prediction
347
𝑖
𝑖 + 𝑛
!"
𝑖 + 𝑛
!"
+ 𝑛
#$%
𝑛
!"
𝑛
#$%
𝑖
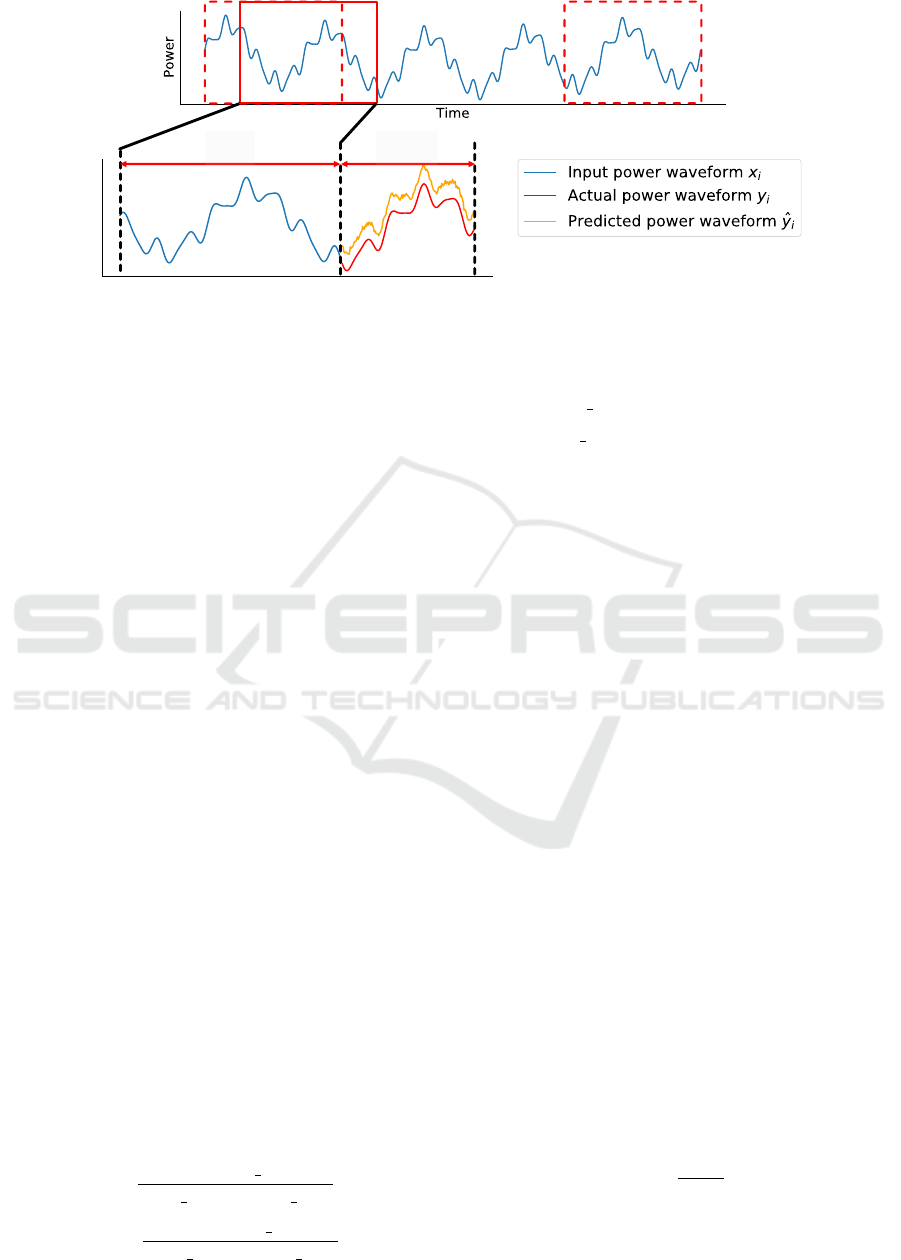
Figure 2: Waveform prediction by LSTM.
waveform close to y
i
. n
in
is the period for the dom-
inant frequency of the power waveform (Ermshaus
et al., 2023). n
out
is set to n
in
/2.
Since IoT devices usually repeat the same behav-
ior, LSTM is expected to learn their behavior patterns.
Since the proposed method does not use the golden
model, there is a possibility that anomalous behaviors
are contained in the training data, but it is difficult to
learn such patterns since hardware Trojans are only
activated under rare conditions (Salmani et al., 2012).
Step 3.2 (Waveform Prediction by LSTM):
In Step 3.2, the proposed method predicts the total
power waveform in a sliding window manner of the
target device using LSTM, which is depicted in Fig-
ure 2.
The partial waveform of length n
in
is extracted
from total power waveform and used as the in-
put of LSTM. Then, LSTM takes this partial
waveform x
i
= (p
i
, p
i+1
,..., p
i+n
in
−1
) of length n
in
and predicts the subsequent partial waveform
ˆy
i
= ( ˆp
i.i+n
in
,... ˆp
i.i+n
in
+n
out
−1
) of length n
out
, which
must be similar to the training data y
i
.
Step 4 (Normalization of Waveforms and
Calculation of Differences):
In Step 3, LSTM learns and predicts the total power
waveforms of the target device. In Step 4, the pre-
dicted power waveform ˆy
i
is compared with the actual
power waveform y
i
to detect anomalous behavior.
Let ˜p
i
be the normalized power value at time i for
p
i
and
˜
ˆp
i. j
be the normalized power value at time j
for ˆp
i. j
. Then they are calculated by:
˜p
i
=
p
i
− norm min
i
norm max
i
− norm min
i
(4)
˜
ˆp
i. j
=
ˆp
i. j
− norm min
i
norm max
i
− norm min
i
(5)
where
norm min
i
= min(min(y
i
),min( ˆy
i
)) (6)
norm max
i
= max(max(y
i
),max( ˆy
i
)) (7)
After normalizing y
i
and ˆy
i
to
˜y
i
= ( ˜p
i+n
in
,... ˜p
i+n
in
+n
out
−1
) and
˜
ˆy
i
=
(
˜
ˆp
i.i+n
in
,...
˜
ˆp
i.i+n
in
+n
out
−1
), respectively, the dif-
ferences between them for all partial waveforms
extracted from total power waveforms are calculated
to obtain Di f f = {d
1
,d
2
,...,d
k
} where k is the total
number of partial power waveforms. d
i
is calculated
using Equation (8).
d
i
=
n
in
+n
out
−1
∑
l=n
in
˜
ˆp
i.i+l
− ˜p
i+l
(8)
If extracted partial waveforms that do not contain
any anomalous behavior, the predicted waveform ˆy
i
and the actual power waveform y
i
must be almost
the same and d
i
be small. On the other hand, it
contains anomalous behavior, d
i
becomes larger be-
cause LSTM has not learned the waveform pattern of
anomalous behavior.
Step 5 (Detecting Anomalous Behavior)
In Step 5, anomaly scores for partial waveforms are
calculated using Di f f obtained in Step 4, and anoma-
lous behaviors are detected by the Hotelling theory.
Hotelling theory is a method to detect outliers in
samples by calculating the anomaly score from the
sample mean and variance. To detect outliers using
the Hotelling theory, it is necessary to calculate the
anomaly score using d
i
for all partial waveforms. Let
a
i
be the anomaly score. Then, it is calculated below:
a
i
=
d
i
− µ
σ
2
(9)
µ is the mean of Di f f and σ
2
is the variance of Di f f .
Hotelling theory assumes that the distribution of data
IoTBDS 2025 - 10th International Conference on Internet of Things, Big Data and Security
348
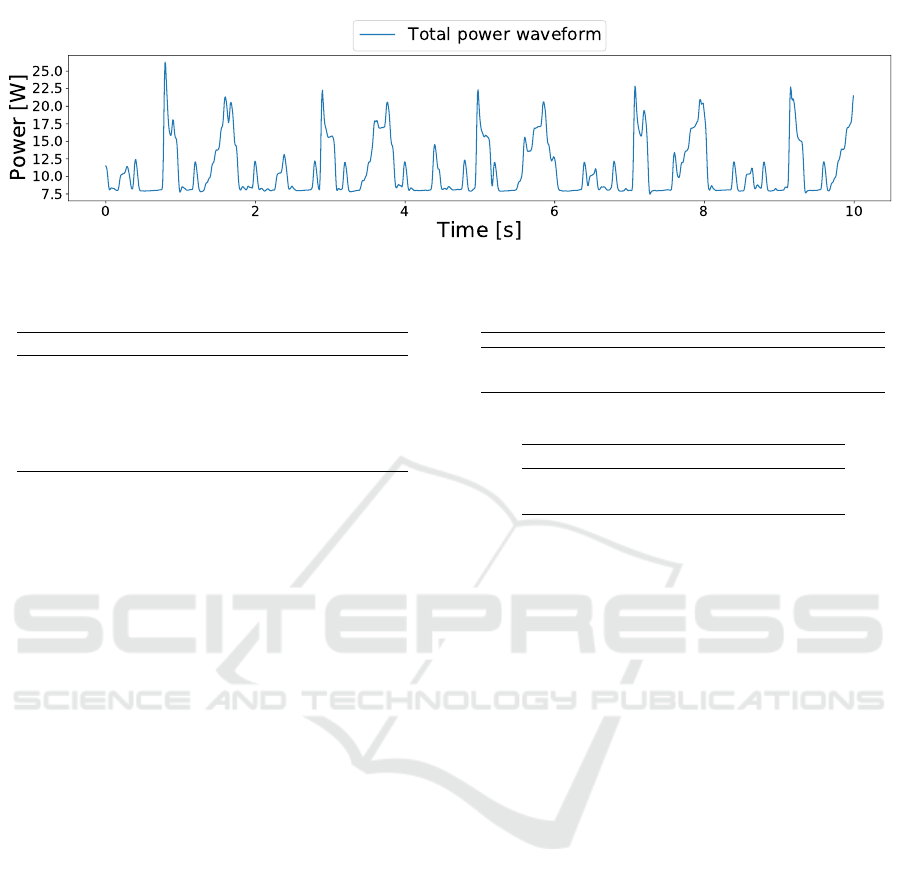
Figure 3: Total power waveform.
Table 1: Python libraries.
Library Role Version
tensorflow Machine learning 2.3.0
Numpy Data processing 1.18.1
Pandas Data processing 1.1.5
scikit-learn Anomaly detection 0.24.2
scipy Statistical processing 1.4.1
follows a normal distribution, and the anomaly score
calculated by Equation (9) follows a chi-square distri-
bution with one degree of freedom.
Outliers are detected by determining the probabil-
ity of occurrence of each anomaly. In the proposed
method, the significance level is set to 1%, the thresh-
old is the anomaly score that occurs with a probabil-
ity of 1%, and an anomalous behavior is considered to
exist in the partial waveform where the anomaly score
larger than the threshold.
4 EXPERIMENTED IoT DEVICE
In this paper, we implemented an application on a
Raspberry Pi4 model B as the target IoT device that
performs two different operations below:
Normal Operation: Takes a picture and encrypts the
image. Then, it turns the motor.
Anomalous Operation: Takes a picture and turns
the motor without encrypting the image.
The application program running on Raspberry
Pi4 repeats the operations above. In the normal oper-
ation, it takes a picture and encrypts a picture. Then,
it turns the motor connected to it. The anomalous op-
eration skips encryption process. The anomalous op-
eration may be rarely run on the device, instead of the
normal operation.
Table 2: Measuring devices.
Devices Type Role
Oscilloscope Tektronix MSO64B Measure a current and voltage
Current probe Tektronix TCP0030A Measure a current
Power supply KEITHLEY 2280S-32-6 Supply power to IoT device
Table 3: Input/output shapes of LSTM.
Layer Input shape Output shape
LSTM 1 × n
in
200
Dense 200 1 × n
out
5 EVALUATION RESULTS
In this section, we measure the power waveform of
Raspberry Pi4 during its operation, and evaluate its
effectiveness in detecting anomalous behavior using
the flow shown in Section 3.
5.1 Experimental Environment
The proposed method was implemented in Python
3.6.9 on the computer with a CPU of Intel Xeon Gold
6230R and the 1.5TB memory and evaluated through
experimental evaluations. Table 1 and Table 2 sum-
marize the Python libraries and the measuring devices
that we used, respectively.
5.2 Extraction of Power Waveform and
Training of LSTM
First, we measured the power waveform of the en-
tire IoT device (Step 1). The sampling frequency f
was 125kHz for 10 seconds, and 76 power wave-
forms were obtained in total. The measured data are
extracted every 1000 samples and thus every power
waveform is assumed to have 1250 power data (length
1250). Out of 76 measured power waveforms, one
power waveform contains the anomalous behavior.
Next, we smoothed the power waveforms (Step 2).
A KZ filter was used for smoothing. The window size
Anomalous IoT Behavior Detection by LSTM-Based Power Waveform Prediction
349
With anomalous behavior
Normal operation
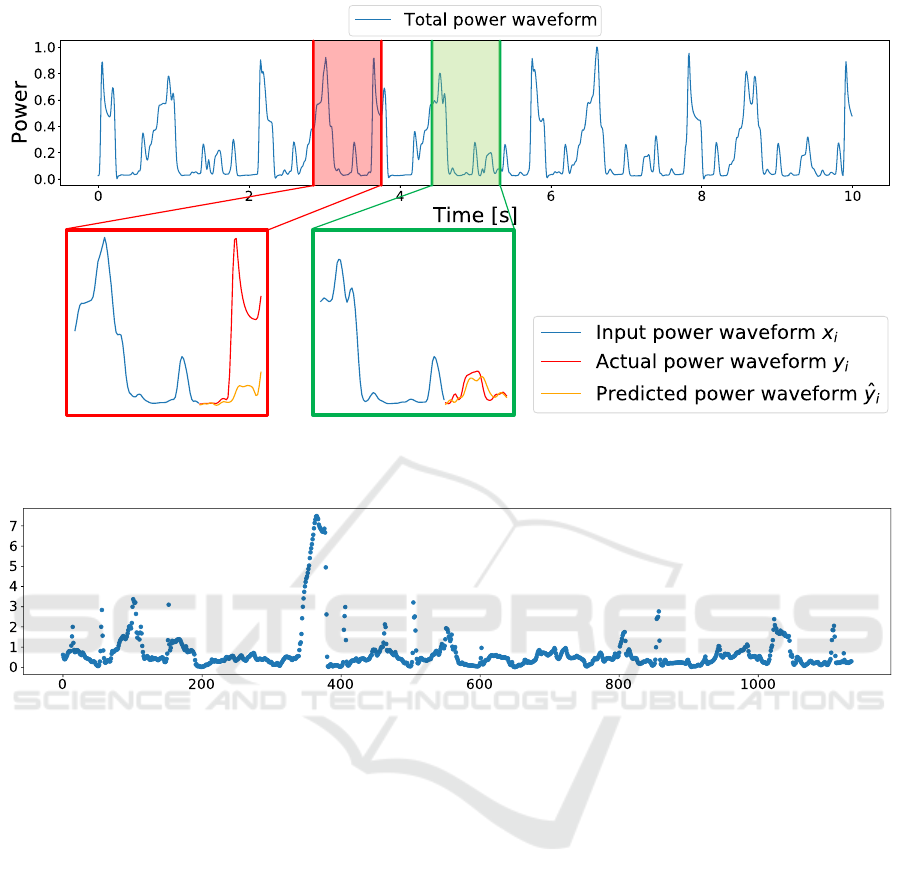
Figure 4: Total power waveform containing anomalous behavior and the results of waveform prediction by LSTM.
Figure 5: Difference between the partial waveform predicted by LSTM and the actual waveform in Di f f .
of the KZ filter used for smoothing was W = 3000 for
the first time and W = 3000 for the second time. Fig-
ure 3 shows an example of the total power waveform
which is not contains anomalous behavior.
Of the 76 trained power waveform data, 59 were
used for training and the remaining 19 were used for
validation, and the power waveforms were learned
by LSTM (Step 3.1). Table 3 shows a construc-
tion of LSTM and the parameters were n
in
= 76 and
n
out
= 38. The input/output shape of LSTM is shown
in Table 3. The number of epoch was set to 50. With
the above parameters, LSTM learned the power wave-
forms of the target device.
5.3 Results of Waveform Prediction by
LSTM
In this section, we show the results of prediction by
LSTM. Figure 4 shows the total power waveform
which contains anomalous behavior (red section) and
partial waveforms with the result of LSTM prediction.
The trained LSTM predicted the waveforms fol-
lowing the input partial waveform (Step 3.2). Firstly,
we pick up the green section in the total power wave-
form of Figure 4. The green section includes no
anomalous behavior. The blue line in the green sec-
tion shows the input partial power waveform x
i
and
the red line shows the actual power waveform y
i
, fol-
lowing the input x
i
. The orange line shows the wave-
form predicted by LSTM. In the green section, the
red line and the orange line are nearly the same. On
the other hand, we pick up the red section in Fig-
ure 4, which includes the anomalous behavior. In the
same way, the red line shows the actual power wave-
form while the orange line shows the predicted on by
LSTM. These two lines do not match well, indicating
that the anomalous behavior exists. The LSTM pre-
dicted that small power consumption due to encryp-
tion should follow the input x
i
, but the anomalous be-
havior skips it, resulting in a larger difference between
the two waveforms.
IoTBDS 2025 - 10th International Conference on Internet of Things, Big Data and Security
350
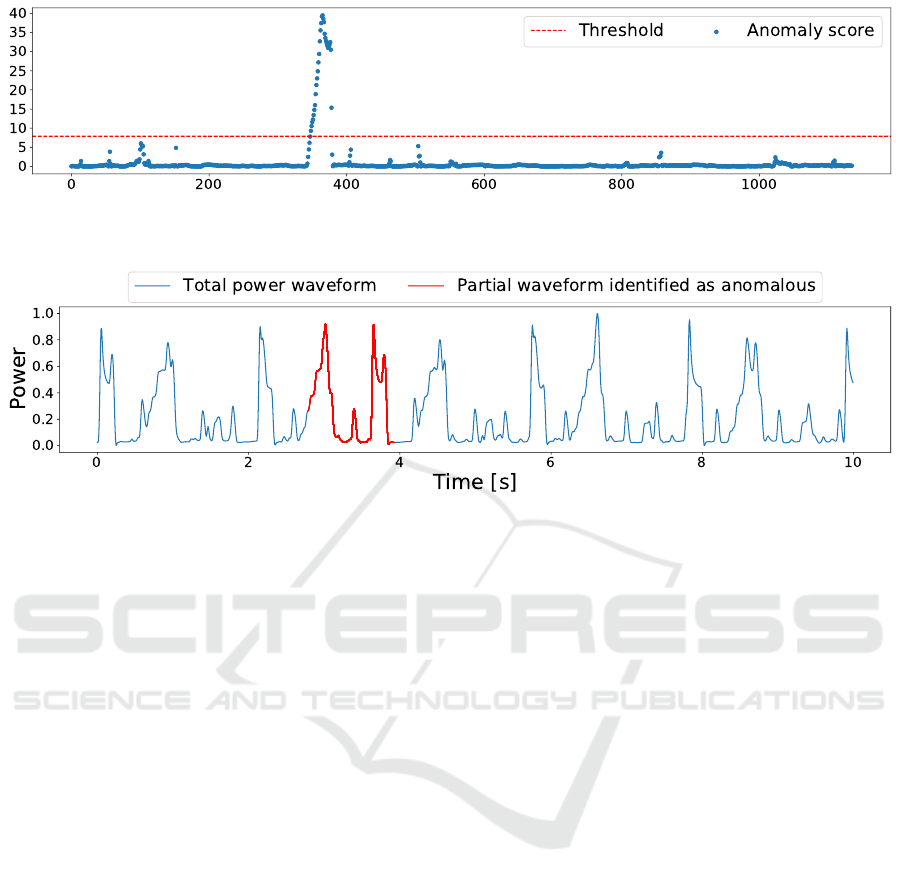
Figure 6: Anomaly score based on the prediction of waveforms for every partial power waveform.
Figure 7: Result of anomaly detection.
5.4 Normalization of Waveforms and
Results of Anomalous Behavior
Detection
After prediction by LSTM, we calculate the differ-
ence between the actual waveform and the waveform
predicted by LSTM for each partial power waveform.
In order to avoid underestimation or overestima-
tion of the difference, we normalize partial wave-
form y
i
and ˆy
i
using Equation (4) and Equation (5).
Then, we calculate the difference between the wave-
form predicted by LSTM ˆy
i
and the actual wave-
form y
i
using Equation (8) (Step 4). d
i
in each par-
tial power waveform is shown in Figure 5. From Fig-
ure 5, we can see that d
i
is locally larger in certain
areas. In order to objectively evaluate whether the
partial waveforms which has larger d
i
values contain
anomalous behaviors or not, outliers of d
i
are detected
using Hotelling theory.
Anomaly score is calculated to use Di f f and
Equation (9) (Step 5). The result is shown in Fig-
ure 6. The anomaly score of 7.9 is obtained, where
the anomaly occurs with a probability of 1%. The red
dotted in Figure 6 shows the anomaly score of 7.9.
The result of detecting anomalous behavior is
shown in Figure 7. It can be seen that the section
indicated as anomalous behavior in Figure 4 is identi-
fied as anomalous behavior. Therefore, the proposed
method succeeded in detecting anomalous behavior.
6 CONCLUSION
In this paper, we proposed an anomalous behavior de-
tection method for IoT devices based on the differ-
ence between LSTM prediction and total power wave-
forms and evaluated the effectiveness by applying the
method to an IoT device built with Raspberry Pi4. Ex-
perimental results showed that the proposed method
successfully detected an anomalous behavior on IoT
device and indicates that the proposed method is ef-
fective as an anomaly detection method.
In the future, we will modify the machine learn-
ing structure and optimize hyper-parameters (hyper-
parameter tuning) to improve accuracy.
ACKNOWLEDGEMENT
The results of this research were obtained through a
contract research project (08101) sponsored by the
National Institute of Information and Communica-
tions Technology (NICT).
REFERENCES
Agrawal, D., Baktir, S., Karakoyunlu, D., Rohatgi, P., and
Sunar, B. (2007). Trojan detection using ic finger-
printing. In Proc. 2007 IEEE Symposium on Security
and Privacy (SP’07), pages 296–310.
Anomalous IoT Behavior Detection by LSTM-Based Power Waveform Prediction
351

Al-Selwi, S. M., Hassan, M. F., Abdulkadir, S. J., Muneer,
A., Sumiea, E. H., Alqushaibi, A., and Ragab, M. G.
(2024). Rnn-lstm: From applications to modeling
techniques and beyond—systematic review. Journal
of King Saud University-Computer and Information
Sciences, page 102068.
Bhasin, S., Danger, J.-L., Guilley, S., Ngo, X. T., and
Sauvage, L. (2013). Hardware trojan horses in cryp-
tographic ip cores. In Proc 2013 Workshop on Fault
Diagnosis and Tolerance in Cryptography, pages 15–
29.
Bhunia, S., Hsiao, M. S., Banga, M., and Narasimhan,
S. (2014). Hardware trojan attacks: Threat analy-
sis and countermeasures. Proceedings of the IEEE,
102(8):1229–1247.
Chakraborty, R. S., Wolff, F., Paul, S., Papachristou, C.,
and Bhunia, S. (2009). Mero: A statistical approach
for hardware trojan detection. In Proc. International
Workshop on Cryptographic Hardware and Embed-
ded Systems, pages 396–410.
Ermshaus, A., Sch
¨
afer, P., and Leser, U. (2023). Window
size selection in unsupervised time series analytics: A
review and benchmark. In Proceedings of Interna-
tional Workshop on Advanced Analytics and Learning
on Temporal Data, pages 83–101. Springer.
Francq, J. and Frick, F. (2015). Introduction to hardware
trojan detection methods. In Proc. 2015 Design, Au-
tomation & Test in Europe Conference & Exhibition
(DATE), pages 770–775.
HaddadPajouh, H., Dehghantanha, A., Khayami, R., and
Choo, K.-K. R. (2018). A deep recurrent neural net-
work based approach for internet of things malware
threat hunting. Future Generation Computer Systems,
85:88–96.
Hasegawa, K., Yanagisawa, M., and Togawa, N. (2018).
Detecting the existence of malfunctions in micro-
controllers utilizing power analysis. In Proc. 2018
IEEE 24th International Symposium on On-Line Test-
ing And Robust System Design (IOLTS), pages 97–
102.
Hotelling, H. (1992). The generalization of Student’s ratio.
Springer.
Islam, R., Tian, R., Batten, L. M., and Versteeg, S. (2013).
Classification of malware based on integrated static
and dynamic features. Journal of Network and Com-
puter Applications, 36(2):646–656.
Jin, Y. and Makris, Y. (2008). Hardware trojan detection
using path delay fingerprint. In Proc. 2008 IEEE In-
ternational workshop on hardware-oriented security
and trust, pages 51–57.
Koopmans, L. H. (1995). The spectral analysis of time se-
ries.
Martinez, B., Monton, M., Vilajosana, I., and Prades, J. D.
(2015). The power of models: Modeling power con-
sumption for iot devices. IEEE Sensors Journal,
15(10):5777–5789.
Oya, M., Shi, Y., Yanagisawa, M., and Togawa, N. (2015).
A score-based classification method for identifying
hardware-trojans at gate-level netlists. In Proc. 2015
Design, Automation & Test in Europe Conference &
Exhibition (DATE), pages 465–470.
Salmani, H., Tehranipoor, M., and Plusquellic, J. (2012). A
novel technique for improving hardware trojan detec-
tion and reducing trojan activation time. IEEE Trans-
actions on Very Large Scale Integration (VLSI) Sys-
tems, 20(1):112–125.
Takasaki, K., Kida, R., and Togawa, N. (2021a). An anoma-
lous behavior detection method based on power anal-
ysis utilizing steady state power waveform predicted
by lstm. In Proc 2021 IEEE 27th International Sym-
posium on On-Line Testing and Robust System Design
(IOLTS), pages 1–7.
Takasaki, K., Kida, R., and Togawa, N. (2021b). An
anomalous behavior detection method utilizing ex-
tracted application-specific power behaviors. IEICE
Transactions on Fundamentals of Electronics, Com-
munications and Computer Sciences, 104(11):1555–
1565.
Wang, L., Xie, H., and Luo, H. (2013). Malicious circuitry
detection using transient power analysis for ic secu-
rity. In Proc. 2013 International Conference on Qual-
ity, Reliability, Risk, Maintenance, and Safety Engi-
neering (QR2MSE), pages 1164–1167.
Wang, Z. and Bovik, A. C. (2009). Mean squared error:
Love it or leave it? a new look at signal fidelity mea-
sures. IEEE signal processing magazine, 26(1):98–
117.
Zaza, A. M., Kharroub, S. K., and Abualsaud, K. (2020).
Lightweight iot malware detection solution using cnn
classification. In 2020 IEEE 3rd 5G World Forum
(5GWF), pages 212–217. IEEE.
IoTBDS 2025 - 10th International Conference on Internet of Things, Big Data and Security
352
