
Stratum Corneum Light Confinement: Monte Carlo Verification
Leah DeVos
1
, Gennadi Saiko
2a
and Alexandre Douplik
2,3 b
1
Department of Engineering, Toronto Metropolitan University, Toronto, Canada
2
Department of Physics, Toronto Metropolitan University, Toronto, Canada
3
iBest, Keenan Research Centre of the LKS Knowledge Institute, St. Michael's Hospital, Canada
Keywords: Refractive Index, Turbid Tissues, Light Propagation.
Abstract: Significance: The epidermis, the outermost layer of the skin, plays a crucial role in protecting the body from
UV radiation, chemical substances, and physical trauma. Its top layer, the stratum corneum (SC), consists of
dead skin cells with low water content (~20%), creating a refractive index gradient between the SC and
underlying tissue. This gradient traps light within the SC layer, but its impact on light propagation in tissues
remains largely unexplored. Aim: The study investigates how refractive index variations in the skin influence
light propagation in tissues. Approach: Monte Carlo (MC) light transport simulations were performed in
media with and without refractive index mismatches. Results: Light confinement in the SC increases the
fluence rate by 12-35% compared to underlying tissue, particularly when the underlying tissue has low diffuse
reflectance. This effect is most pronounced when the SC thickness exceeds the reduced scattering length
(~150-600 μm for visible light). Such thicknesses occur in glabrous skin (palms, soles) and thickened areas
like calluses and corns. Conclusions: By comparing MC simulations, we attribute this light confinement to
the SC's high refractive index due to its low water content. This stratum corneum light confinement (SCLC)
phenomenon may lead to an inaccurate estimation of light distribution, resulting in errors in some skin
diagnostic parameters measured via diffuse reflection, such as water and total hemoglobin content, and blood
oxygenation.
1 INTRODUCTION
The epidermis is the outermost layer of the skin, and
it plays a crucial role in protecting the body from
external insults such as UV radiation, chemical
substances, and physical trauma. The epidermis can
be subdivided into two sublayers: non-living and
living epidermis. The non-living epidermis (~20 μm
thick) consists of only dead squamous cells, which are
highly keratinized with a high lipid (~20%) and
protein (60%) content and a relatively low (~20%)
water content (Bashkatov, 2011). In terms of water
content, the stratum corneum radically differs from
the underlying skin layers, which have much higher
water content—the typical water content in these live
skin layers is 70%.
Due to the significant difference in refractive
index between proteins/lipids and water, skin tissues
can be stratified into two layers: stratum corneum
a
https://orcid.org/0000-0002-5697-7609
b
https://orcid.org/0000-0001-9948-9472
with the higher refractive index (n = 1.467) and all
other underlying tissue with lower refractive index
(n = 1.383).
The low water content of stratum corneum has
significant implications on water content imaging
(Saiko, 2023a), particularly for thickened areas (corns
and calluses). While the light propagation in
multilayer skin models has been studied analytically
(Sergeeva, 2024; Phillips, 2009; Liemert, 2017),
numerically (Chang, 2023; Sadeghi, 2022;
Yudovsky, 2011; Grossweiner, 1992, Dehghani,
2003), and experimentally (Farrell, 2001), the effect
of refractive index gradient on skin optics has not
been adequately explored so far, which may have
certain implications for actively developing optical
medical devices and consumer health fields. In a
recent development, Saiko (Saiko, 2023b) developed
an analytical approach to account for the refractive
index gradient and predicted the light confinement in
the stratum corneum.
DeVos, L., Saiko, G. and Douplik, A.
Stratum Corneum Light Confinement: Monte Carlo Verification.
DOI: 10.5220/0013369700003911
Paper published under CC license (CC BY-NC-ND 4.0)
In Proceedings of the 18th International Joint Conference on Biomedical Engineering Systems and Technologies (BIOSTEC 2025) - Volume 1, pages 397-402
ISBN: 978-989-758-731-3; ISSN: 2184-4305
Proceedings Copyright © 2025 by SCITEPRESS – Science and Technology Publications, Lda.
397

The current work aims to elucidate the impact of
a significant gradient of water content and,
consequently, the gradient of the refractive index of
the skin layers in tissues, which can help more
accurately describe the light propagation in tissues. In
this study, we validate the model predictions (Saiko,
2023b) with established Monte Carlo simulations of
light propagation (specifically the gpumcml program
(Alerstamet, 2010)).
2 METHODS
2.1 Tissue Model
We have performed Monte Carlo simulations of light
transport in a two-layer model (the stratum corneum
and underlying tissue) to elucidate the peculiarities of
light propagation in the proposed model.
2.1.1 Index of Refraction
The refractive indexes of tissue structure elements,
such as the fibrils, the interstitial medium, nuclei,
cytoplasm, organelles, and the tissue itself, can be
derived using the law of Gladstone and Dale, which
states that the resulting value represents an average of
the refractive indices of the components related to
their volume fractions. Water content varies in
different skin layers. To account for the impact of
water content on the refraction index, a simple
approach was proposed by (Troy, 2001), which
assumes that the tissue consists of protein and water.
If proteins have a refractive index of 1.5, we get the
following expression, which is a generalized version
of (Troy, 2001), which used water content, c
w
=0.7,
𝑛
=
(
1−𝑐
)
1.5 + 𝑐
𝑛
(1)
Water's refractive index in the spectrum's visible
range (380 - 700 nm) can be estimated as 1.333 (Hale,
1973). However, its wavelength-dependent
approximations can be used to account for the
dependence on the light wavelength if necessary. Due
to the significant difference in refractive index
between proteins and water, tissues can be stratified
into two layers: stratum corneum with a higher
refractive index and all other underlying tissue with a
lower refractive index. They will be denoted by
subindexes 1 and 2, respectively. Subindex 0 will
correspond to the surrounding medium (air). Note
that while stratum corneum has a high lipid content,
it does not change our assumptions, as lipids also
have a high refractive index. We have calculated the
refractive index for tissue layers using Eq.1. We
considered two scenarios: c
w
=0.7 (n=1.383) and c
w
=0.2 (n=1.467).
2.1.2 Underlying Tissue Optical Parameters
As we are interested primarily in the effect of
refractive index gradient, we have selected three sets
of underlying tissue parameters to emulate the low,
medium, and high reflectance R (approximately 0.1,
0.3, and 0.5, respectively). The (μ
a
, μ
s
) values were
set to (17cm
-1
, 80cm
-1
), (9cm
-1
, 180cm
-1
), and (5cm
1
,
275cm
-1
), respectively. The anisotropy factor, g, was
set to 0.7.
2.1.3 Stratum Corneum Layer Thickness
We selected seven stratum corneum (SC) layer
thickness values to emulate a broad range of
physiological conditions: d= 20, 50, 100, 200, 500,
1000, and 2000μm.
2.1.4 Stratum Corneum Optical Parameters
We have selected one scenario for the absorption
coefficient in stratum corneum: μ
a
= 5cm
1
, which
corresponds approximately to flesh absorption at
400nm. We selected three values for the reduced
coefficient of scattering: 60, 30, and 15 cm
-1
. To
emulate the effect of different wavelengths (their
relative size compared with the scatterer size), we
have considered three values for scattering
anisotropy: g = 0, 0.4, and 0.8. Thus, we generated
three values of (μ
s
, g) for each respective μ'
s
. As we
expect that the observed phenomena will depend on
the SC layer thickness in comparison with the
scattering transport length and reduced scattering
transport length, we selected parameters d, μs, and g
to cover all possible relationships between SC layer
thickness and the scattering transport length and
reduced scattering transport length.
2.2 Monte Carlo Simulations
Using the GPU MCML Monte Carlo software
(Alerstamet, 2010), we simulated light propagation in
a two-layer model to validate the results of the
analytical prediction. The primary model is the semi-
infinite tissue (d
2
=6mm, n
2
=1.383) covered with the
stratum corneum layer (n
1
=1.467) with thicknesses
described in the 2.1.3 section. In total, 3x3x3x7=189
scenarios were simulated.
To elucidate the impact of the refractive index
gradient, we have also simulated a scenario without a
water content gradient (matched SC/underlying tissue
BIOIMAGING 2025 - 12th International Conference on Bioimaging
398

boundary). Namely, we set n
1
=n
2
=1.383 (matched
SC/underlying tissue boundary) for the same value of
the SC absorption coefficient (μ
a
= 5cm
-
1). In total,
3x3x3x7=189 scenarios were simulated and were
used as a baseline.
Overall, we simulated 2x3x3x3x7=378 scenarios.
From the Monte Carlo simulations, we obtained
diffuse reflectance R
d
and the dependence of flux
intensity on the depth Φ(z). We used 10
8
photons for
each simulation. Resolutions in vertical and lateral
directions were set to 10μm and 100μm, respectively.
3 RESULTS
We have calculated the fluence rate around the
SC/underlying tissue interface (20μm above and
1mm in the underlying tissue). Examples of the light
distributions are depicted in Fig. 1.
To characterize the fluence rate behavior at the
interface and below the interface in the underlying
tissue, we have calculated the jump in the light
intensity over the SC/underlying tissue interface and
the slope of the fluence rate in the underlying tissue
just below the interface (termed as "gap"). The gap
was defined as,
𝑔𝑎𝑝 = (𝐼
−𝐼
)/𝐼
(2)
Here, I
+
and I
-
are light flux just above (I
+
) and
just below (I-) the SC/underlying tissue interface.
In Fig. 2, one can see the dependence of the gap
on the SC thickness for all (μs', g) scenarios for
matched (dashed lines) and mismatched (solid lines)
boundaries for μ
a
=5cm
-1
. Panels are arranged with
increasing g (horizontally) and μ
s
' (vertically).
As predicted by the analytical model, mismatched
boundaries demonstrate a very significant effect on
the gap. From Fig. 2, one can see that the gap is
approximately 5x larger in the case of the mismatched
boundary where n
1
= 1.467 for the stratum corneum
and n
2
= 1.383 for the underlying tissue (see, for
example, panel 3c, where for R=0.1, the gap is on the
scale 0.02 vs. 0.15 for 20μm thickness).
One can see that the gap dependences on R and g
are quite significant. As expected, lower reflectance
of the underlying tissue, R, translates into more
significant gaps. Also, for realistic anisotropy factors
(g is around 0.7 in biological tissues), the gap
increases with an increase in g. Conversely, the gap
decreases as μ
s
' increases.
4 DISCUSSIONS
Our analysis shows we can expect several noticeable
effects caused by the mismatched boundary between
the stratum corneum and underlying tissues.
In particular, it is known that the light intensity is
amplified under the surface, which can be described
by the ratio of under-the-surface light intensity to the
external light intensity. In the case of a matched
boundary, the ratio will be close to 1+R (forward and
backward fluxes). However, the ratio typically has
higher values (amplification) than predicted by 1+R
for mismatched boundaries. In the proposed two-
layer model, we have an additional amplification. The
light intensity in the SC layer is noticeably higher
than just below the interface with underlying tissues,
as demonstrated by Fig. 1 and 2. This phenomenon
can be attributed to several factors. The first factor is
the higher value of the refractive index of the stratum
corneum. It increases the overall light intensity under
the air/SC interface. However, the light intensity in
the stratum corneum layer is noticeably (10-30%)
higher than in the underlying tissue layer (see Fig. 2).
We have conducted the baseline MC calculations to
investigate this phenomenon for the matched
boundary between SC and underlying tissues. In this
case, the change (gap) is significantly smaller (see
Fig. 2). Thus, we can attribute the effect primarily to
the mismatched boundary between SC and the
underlying tissue and refer to it as the confinement of
light in the stratum corneum layer.
The light confinement in the SC layer is similar
to fiber optics. Total internal reflections of the light
on the interfaces with air and underlying tissues cause
it. In particular, the critical angles on these interfaces
are φ
c,a=
arcsin(1/n
10
) and φ
c,ut
=arcsin(1/n
12
),
respectively. The core differences with fiber optics
are that a) instead of highly transparent media (fiber
optics), we have a highly scattering media, b) instead
of a 1D case (light propagation along an axis in the
optical fiber), we have a 2D case (light propagation in
the x-y plane), and c) critical angles on both surfaces
are not identical. However, a broad range of similar
phenomena should likely be observed. For example,
it should result in a broadening of the point spread
function (PSF), which is caused by the fact that the
SC acts as a light guide in the x-y plane. Also,
similarly to light leakage due to fiber bending, the
same phenomena can be expected to be observed on
curved surfaces like heel skin.
As one can see from Fig. 2, the confinement effect
is more noticeable for low values of the diffuse
reflectance R. It does make sense, as in this case, the
underlying tissue is a less significant source of
Stratum Corneum Light Confinement: Monte Carlo Verification
399
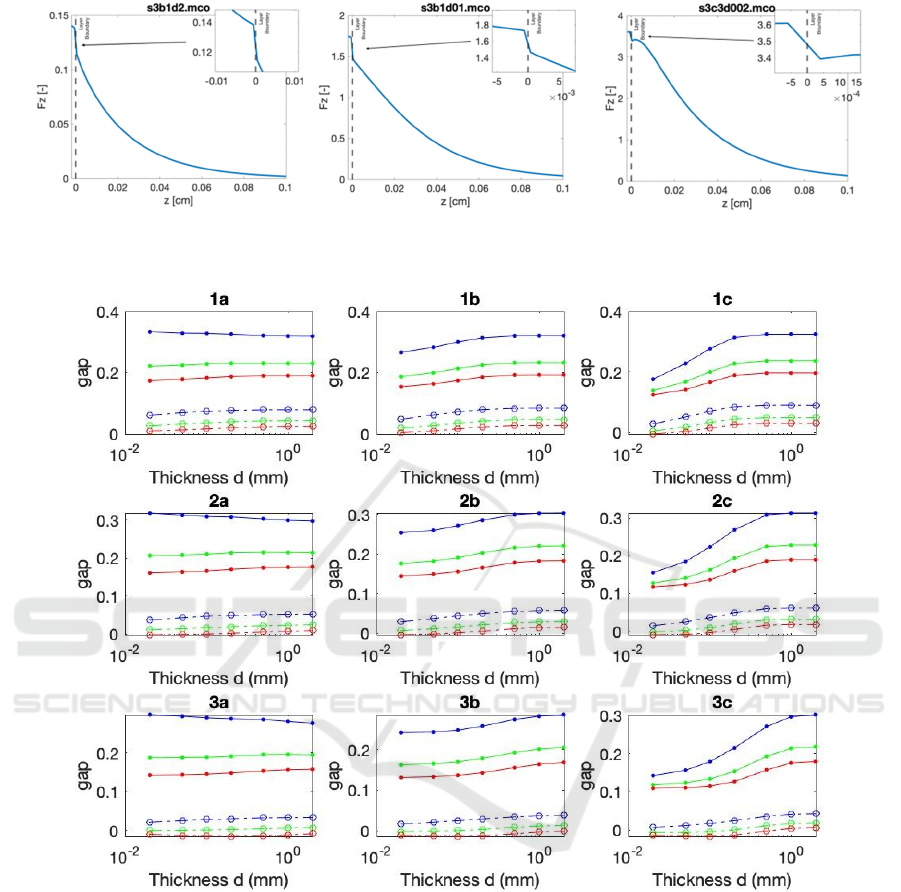
Figure 1: Examples of the fluence rate depth dependence at the SC/underlying tissue interface. (a) with a stratum corneum
thickness of 2000 μm, (b) 100 μm, and (c) 20 μm.
Figure 2: Dependence of the gap on SC thickness d in all (μ
s
', g) scenarios for no mismatch (dashed lines) vs. mismatch (solid
lines) boundary conditions for various underlying tissue reflectance R. R = 0.1 (blue lines), 0.3 (green lines). 0.5 (red lines).
Panels are arranged with increasing g (horizontally) and μ
s
' (vertically).
recycled photons for the stratum corneum layer. Thus,
most recycled photons come from the total internal
reflection on the interfaces between stratum
corneum/air and stratum corneum/underlying tissues.
For high diffuse reflectance, the underlying tissue is
the primary source of recycled photons compared
with relatively weak total internal reflectance on the
stratum corneum/underlying tissues interface. Thus,
the confinement effects (e.g., the additional
amplification) are masked by stronger mechanisms
(photon injection from the underlying tissues).
Also, the effect depends significantly on the
thickness of the stratum corneum layer. In particular,
for small (compared with the distance between
consecutive scatterings) thicknesses, the photons that
enter the stratum corneum from the air pass through
the SC layer without experiencing total internal
reflection. The same applies to the significant part of
photons entering the SC layer from the underlying
tissues. As there is no total internal reflection for
photons entering from the underlying tissue, all
photons from the underlying tissue (other than a
BIOIMAGING 2025 - 12th International Conference on Bioimaging
400

minute fraction of specularly reflected ones) will
enter the SC layer; however, just photons with an
angle of incidence φ>arcsin(1/n
2
) will experience
total internal reflection on the SC/air interface (the
critical angle is 46.3° for n
2
=1.383). All others escape
the SC through the SC/air interface immediately.
However, even a small fraction of photons that
experienced total internal reflection on the air/SC
interface will immediately exit the SC layer on the
SC/underlying tissue interface. Thus, the light
confinement will be minimal. In this case, photons
within the tissue almost do not feel the presence of the
SC layer.
As the SC layer thickness increases, the entering
photons start experiencing scattering events. In this
case, the light becomes homogenized across various
directions in the SC layer. If the thickness is larger
than the reduced scattering length, the photon that
enters the SC layer from any direction will be
homogenized in the SC layer. Thus, the share of
oblique photons, which experience total internal
reflection in the SC layer, will increase. As a result,
the confinement will increase to its maximum value,
as confirmed by Monte Carlo simulations (Fig. 2).
As the reduced scattering coefficient for the SC is
on the scale 15-70 cm
-1
in the visible range of the
spectrum1, the light confinement phenomenon is
maximal in stratum corneum layers with a thickness
of at least 150μm and 600μm in blue and red ranges
of the spectrum, respectively. These values are typical
for the glabrous skin of palms and soles and thickened
epidermis like calluses and corns. These estimations
were confirmed by Monte Carlo simulations (Fig. 2).
However, the effect is almost absent for isotropic
(Rayleigh) scattering, which can be strong for shorter
wavelengths (<500nm).
The predicted phenomena (the stratum corneum
light confinement or SCLC) may have implications
for applications in biospectroscopy and bioimaging.
There are several possible mechanisms. Firstly, it
may impact the sampling/interrogating depth. For
example, one can see that for the small diffuse
reflectance, the contribution of the SC may dominate
in the total reflectance, which may skew certain
measurements. Secondly, it may impact the point
spread function, which, in turn, may impact the
dependence of the reflected light as a function of
source-detector distance in spatially resolved
spectroscopy. For example, current consumer-grade
tissue oxygenation sensors (like Oura ring) can often
be interchangeably deployed on non-glabrous and
glabrous skin, characterized by a much thicker
stratum corneum layer. These phenomena will be
explored in future work, where we plan to use Monte
Carlo simulations of light propagation in tissues to
identify other possible effects of light confinement in
stratum corneum on measurements of water and total
hemoglobin content and blood oxygenation.
5 CONCLUSIONS
Monte Carlo simulations confirmed light
confinement in the stratum corneum layer. The light
in the stratum corneum is confined between two
interfaces: air and underlying tissues. The effect can
be attributed to the high refractive index of the
stratum corneum caused by low water content,
compared with underlying tissues and scattering in
the stratum corneum layer. Light confinement in the
stratum corneum is maximal in cases where the
thickness of the stratum corneum layer is more than
the reduced scattering length. In the visible range of
the spectrum, the light confinement phenomenon is
maximal in stratum corneum layers with a thickness
of at least 150μm (the blue range) and 600 m (the red
range). In addition, the relative effect of light
confinement increases with the decrease of the
underlying tissue reflectance. If unaccounted for, the
stratum corneum light confinement (SCLC)
phenomenon may potentially lead to an inaccurate
estimation of the light distribution, resulting in errors
in some skin diagnostic parameters measured via the
diffuse reflection, such as water and total hemoglobin
content and blood oxygenation.
ACKNOWLEDGEMENTS
The authors acknowledge funding from NSERC
Alliance (A.D), NSERC Personal Discovery an I2I
(A.D. and G. S.), NSERC RTI (A.D.), Toronto
Metropolitan University Health Fund (A.D.), and
Toronto Metropolitan University Faculty of Science
Discovery Accelerator program (G.S.).
REFERENCES
Alerstamet, E. al., (2010) Next-generation acceleration and
code optimization for light transport in turbid media
using GPUs, Biomed. Opt. Express 1, 658-675.
Bashkatov, A.N., Genina, E.A., Tuchin, V.V., (2011)
Optical Properties of Skin, Subcutaneous, and Muscle
Tissues: a Review, J. Inn. Opt. Health Sci, 4(1) 9-38.
Chang, Y., & Gao, W. (2023). Mueller matrix model of
polarized light propagation in layered human skin in
Stratum Corneum Light Confinement: Monte Carlo Verification
401

backscattering configuration. Journal of Applied
Physics, 134(22). https://doi.org/10.1063/5.0171926
Dehghani, H., Brooksby, B., Vishwanath, K., Pogue, B.W.,
and Paulsen, K.D., (2003) The effects of internal
refractive index variation in nearinfrared optical
tomography: a finite element modelling approach,
Physics in Medicine & Biology, 48(16): 2713.
Farrell, T.J. and Patterson, M.S., (2001) Experimental
verification of the effect of refractive index mismatch
on the light fluence in a turbid medium, J Biomed Opt,
6(4): 468-473.
Grossweiner, LI, Karagiannes, JL, Jones, LR, Johnson, PW.
(1992) Reflection and transmission coefficients in
plane-parallel layers with refractive-index mismatch,
Applied optics.; 31(1):106-109.
Hale, G. M., Querry, M. R. (1973) Optical constants of
water in the 200 nm to 200 µm wavelength region,
Appl. Opt., 12, 555-563.
Liemert, A., Reitzle, D. and Kienle, A., (2017) Analytical
solutions of the radiative transport equation for turbid
and fluorescent layered media, Scie Rep, 7(1): 3819.
Phillips, K.G. and Jacques, S.L., (2009) Solution of
transport equations in layered media with refractive
index mismatch using the P Nmethod, JOSA A, 26(10):
2147-2162.
Sadeghi, B., Siahpoush, V., & Nikniazi, A. (2022). A basic
estimation on the light distribution and thermal
behavior of the human skin through transfer matrix
method coupled with Pennes’ bio-heat equation. Waves
in Random and Complex Media, 32(4), 1803–1819.
https://doi.org/10.1080/17455030.2020.1838666
Saiko, G. (2023) Feasibility of Skin Water Content Imaging
Using CMOS Sensors, Sensors, 23, 919.
Saiko, G. (2023) Light confinement in stratum corneum,
arXiv:2309.13146.
Sergeeva, E., Kurakina, D., Turchin, I., & Kirillin, M.
(2024). A refined analytical model for reconstruction
problems in diffuse reflectance spectroscopy. Journal of
Innovative Optical Health Sciences, 17(05), 2342002.
https://doi.org/10.1142/S1793545823420026
Troy, T. L., Thennadil, S. N., (2001) Optical properties of
human skin in the near-infrared wavelength range of
1000 to 2200 nm, J. Biomed. Opt. 6, 167-176
Yudovsky, D. and Durkin, A.J., (2011) Hybrid diffusion
and two-flux approximation for multilayered tissue
light propagation modeling, Applied optics, 50(21):
4237-4245.
BIOIMAGING 2025 - 12th International Conference on Bioimaging
402
