
DeepCellCount: Cell Counting Using Two-Step Deep Learning
Sara Tesfamariam
1
, Isah A. Lawal
1
, Arda Durmaz
2
and Jacob G. Scott
2
1
Department of Applied Data Science, Noroff University College, Kristiansand, Norway
2
Translational Hematology & Oncology Research, Cleveland Clinic, Cleveland, U.S.A.
Keywords:
Cell Segmentation, Cell Counting, Convolutional Neural Network.
Abstract:
This paper addresses the problem of segmenting and counting cells in fluorescent microscopy images. Ac-
curate identification and counting of cells is crucial for automated cell annotation processes in biomedical
laboratories. To address this, we trained two convolutional neural networks using publicly available high-
throughput microscopy cell image sets. One network is trained for cell segmentation and the other for cell
counting. Both models are then used in a two-step image analysis process to identify and count the cells
in a given image. We evaluated the performance of this method on previously unseen cell images, and our
experimental results show that the proposed method achieved an average Mean Absolute Percentage Error
(MAPE) as low as 6.82 on the test images with sparsely populated cells. This performance is comparable to
that obtained with a more complex CellProfiler software on the same dataset.
1 INTRODUCTION
Cell-based experiments involve observing and ana-
lyzing the shapes, positions, and quantities of cells
(Lu et al., 2023). Cell segmentation and counting are
particularly useful in biomedical research, as they al-
low quantifying cultured cells and measuring the ef-
fectiveness of experimental drugs by comparing cell
concentrations before and after the drugs are admin-
istered. The changes are then estimated using time-
lapse microscopy images over some time to analyze
drug viability for proceeding experiments. The time-
lapse images provide critical information about cell
mortality or growth, movement, morphology, and in-
teraction over time.
Cell segmentation helps to separate each cell from
the background and define cell boundaries. The
counting stage quantifies the segmented cells to deter-
mine whether the experimental drug effectively elim-
inates the diseased cells (Aldughayfiq et al., 2023).
Cell counting can be done manually (Kataras et al.,
2023) or with automated counters and digital image
analysis (Vembadi et al., 2019). However, identifying
and counting cells has traditionally been laborious in
the biomedical field.
Many methods have been developed for medical
image analysis, including CellProfiler (McQuin C,
2018) and deep learning (Liu et al., 2019). CellPro-
filer is an open-source software that allows biologists
without computer vision or programming training to
measure and count cells from thousands of cell im-
ages. On the other hand, deep learning enables ef-
ficient image segmentation by allowing machines to
learn and extract informative features for recogniz-
ing object shapes and boundaries in an image (Kugel-
man et al., 2022). Thus enabling the localization and
segmentation of objects in images. This development
can alleviate the manual and time-consuming process
of identifying cells from medical images (Liu et al.,
2019).
Inspired by the success of the deep learning-based
image analysis method in related applications, we
explore the U-Net-like model as an alternative ap-
proach to perform pixel-based cell segmentation and
count the segmented cells. We train the models for
segmenting and counting using a publicly available
dataset, and we apply the trained models to perform
experimental prediction on an actual fluorescent mi-
croscopic image obtained in collaboration with Scott
Lab at the Department of Translational Hematology
and Oncology Cancer Research, Cleveland, USA. For
brevity, we will now refer to our proposed approach
as Deep Cell Count (DCC). The rest of this paper is
organized as follows, Section 2 reviews the related lit-
erature while Section 3 describes the dataset prepara-
tion and modeling of the DCC. Section 4 discusses
the experiments and results, and Section 5 concludes
the paper.
980
Tesfamariam, S., Lawal, I. A., Durmaz, A. and Scott, J. G.
DeepCellCount: Cell Counting Using Two-Step Deep Learning.
DOI: 10.5220/0013369900003912
Paper published under CC license (CC BY-NC-ND 4.0)
In Proceedings of the 20th International Joint Conference on Computer Vision, Imaging and Computer Graphics Theory and Applications (VISIGRAPP 2025) - Volume 2: VISAPP, pages
980-985
ISBN: 978-989-758-728-3; ISSN: 2184-4321
Proceedings Copyright © 2025 by SCITEPRESS – Science and Technology Publications, Lda.
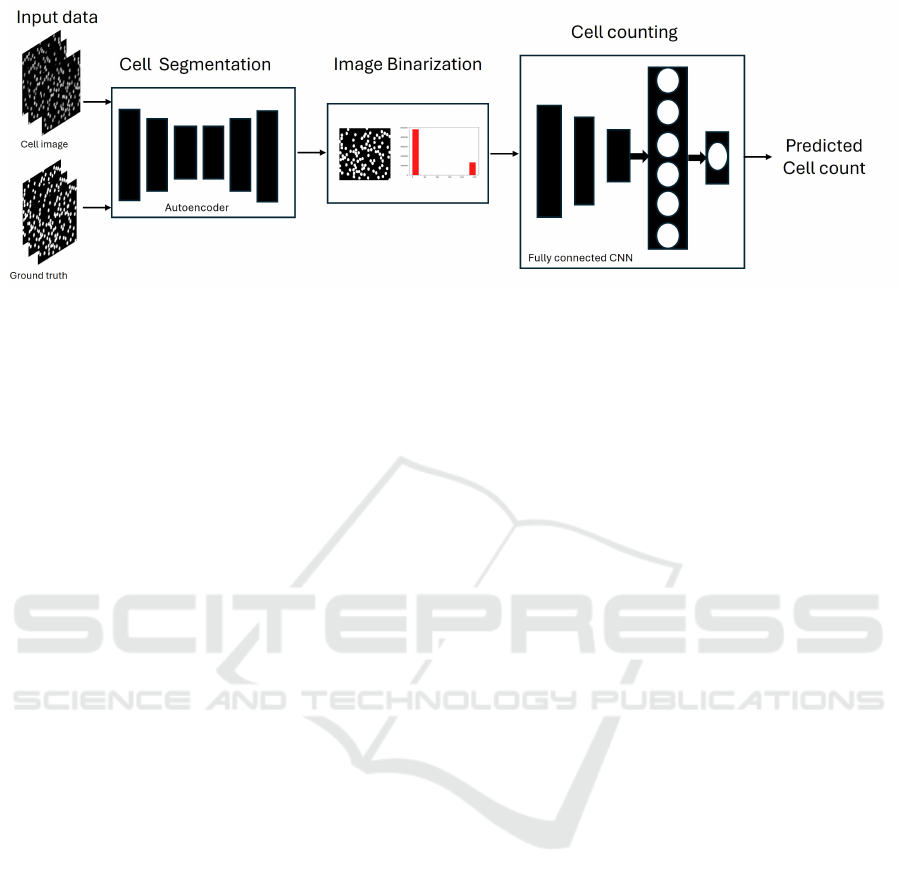
Figure 1: Block diagram of the proposed DCC-based cell counting method.
2 RELATED WORK
The following review discusses CNN-based models
for cell segmentation and counting. For example,
Zhang et al. (2021) created a modified U-Net-like
structure to segment malignant brain tumor cells in
microscopic images. They utilized distance trans-
form and watershed segmentation for cell counting
and confirmed the effectiveness of the U-Net model.
Liu et al. (2019) utilized deep CNN models for cell
counting using dot density maps and foreground mask
methods, demonstrating that the ensemble method for
feature extraction produced superior results. Simi-
larly, Hern
´
andez et al. (2018) employed Feature Pyra-
mid Networks (FPN) for cell segmentation to cap-
ture object structures at various scales within an im-
age. They then used a Visual Geometry Group (VGG)
network to count cells and determine aleatoric uncer-
tainty from the segmentation results. Conversely, Li
and Shen (2022) argued that deep network layers tend
to underperform due to information loss in image seg-
mentation models. The information loss issue in im-
age segmentation when using max-pooling in an au-
toencoder model was also studied by de Souza Brito
et al. (2021).
To address these concerns, our proposed DCC
method for cell segmentation employs a lightweight
U-Net-like autoencoder CNN model. We use the
group normalization method to enhance our model’s
generalizability across different image datasets, pre-
venting potential information loss and obtaining a
more adaptable model in the segmentation process.
We then perform thresholding on the segmented cell
images to improve cell identification and develop
a fully connected CNN regressor to count the seg-
mented cells. The CNN regressor counting is an ex-
perimental technique we explore to test the feasibility
of the regression-based method and its performance
on cell counting tasks.
3 METHODOLOGY
The DCC method described in this paper involves a
three-step workflow. First, the cells in the input im-
ages are localized through cell segmentation. Next,
the quality of the segmented cell images is improved
through image thresholding. Finally, a deep regres-
sor model counts the number of observed cells in the
thresholded image. Figure 1 shows the schematic di-
agram of the proposed method. Subsequent sections
discuss the preparation of the input cell images, the
segmentation, and the counting modeling process.
3.1 Cell Image Preparation
To train the DCC cell segmentation and counting
model, we utilized the annotated biological image
dataset detailed in Section 4.1. We chose this dataset
because it is the largest publicly available cell image
database for evaluating algorithms in this field. The
dataset is valuable as it provides ground truth for val-
idating our proposed method.
We convert the images to grayscale and resize
them to 784x784 to ensure symmetry and divide them
into training, validation, and test sets in a 70%, 20%,
and 10% ratio, respectively. To augment the train-
ing data, we implemented a blurring method using
OpenCV blur with a 5x5 window and added Gaus-
sian noise to create unique variations of the training
data. The purpose of altering the input images is to
enhance the model’s ability to extract informative fea-
tures from images of varying quality and characteris-
tics (Shorten and Khoshgoftaar, 2019). Figure 2 dis-
plays a sample of the cell image and its corresponding
mask. The following section used these prepared im-
ages as input to train the DCC cell segmentation and
counting model.
DeepCellCount: Cell Counting Using Two-Step Deep Learning
981

Figure 2: A sample of the dataset used in our work; cell
image (left) and corresponding mask (right) image.
3.2 DCC Modelling
In the development of the DCC model, we utilized
a two-stage approach involving the implementation
of a convolutional neural network (CNN). The first
stage focused on cell segmentation, where we con-
structed a CNN to identify and delineate individual
cells within an image. Subsequently, in the second
stage, we trained a downstream CNN regressor us-
ing the segmented image as input to predict the cell
counts through regression analysis.
For the segmentation stage, we employed a model
architecture following an encoder-decoder paradigm
(O
˘
guz and
¨
Omer Faruk Ertu
˘
grul, 2023). Specifically,
we utilized a lightweight U-Net-like model consist-
ing of three encoder and three decoder layers (Ron-
neberger et al., 2015). The encoder section of the
model comprised three convolutional layers with ker-
nel sizes of 64, 128, and 256, each utilizing a (3x3)
kernel and rectifying linear unit activation layers. To
normalize the output of the convolutional layers, we
applied group normalization. This approach was cho-
sen to address potential errors arising from utilizing a
small batch size (4 images per batch) in the encoder-
decoder model (Wu and He, 2018). The encoded im-
age was then decoded using three expansion convolu-
tional layers with (3x3) kernel size. A sigmoid ac-
tivation function was employed for the final output
to provide the probability of each pixel representing
a cell. To classify pixels as cell or non-cell, we uti-
lized different thresholding methods on the outputted
probability to compensate for our experimental im-
ages’ different image quality and cell count density.
These thresholding methods include Simple, Adap-
tive Gaussian, and Otsu techniques. Simple (binary)
thresholding uses a global cut-off of 0.5. In contrast,
Adaptive Gaussian thresholding computes the cut-off
value by taking the Gaussian-weighted average of the
probabilities within a block of pixels. Otsu’s thresh-
ing method calculates the cut-off value that maxi-
mizes the separation of the foreground and the back-
ground from the pixels of the image intensity his-
togram.
In the counting stage, the second CNN model uti-
lized the thresholded mask produced by the encoder-
decoder model as input. This model performed two
3x3 convolutions with Rectified Linear Unit (ReLU)
activation and max pooling in between. The resul-
tant output was flattened into a vector and fed into a
dense layer featuring 512 neurons. The final output
of this stage was the regression count of the cells in
the input image. The weights of both the encoder-
decoder and counting models were optimized using
the Adam optimizer with a learning rate of 0.0001, as
this is shown to give superior performance in terms of
accuracy (Dogo et al., 2022).
4 EXPERIMENTATION AND
DISCUSSION
4.1 Dataset
We utilized two sets of datasets for our experimen-
tation. The first one is the publicly available Broad
Institute’s Bioimage Benchmark Collection annotated
biological image sets (BBBC005Version 1)
1
. The
dataset comprises 19200 images and 1200 ground
truth masks, with 9600 containing an actual cell
count. We worked with the 1200 images with ground
truth masks for the segmentation tasks. To train the
counting model, we selected 595 images with ground
truth masks and actual counts to assess the segmenta-
tion and counting performances of the DCC method.
The second dataset was obtained in collaboration
with Scott Lab at the Department of Translational
Hematology and Oncology Cancer Research, Cleve-
land, USA. These image samples contain densely
populated cells and two distinct cell types labeled
with Green Fluorescence Protein (GFP) and mCherry.
We only used this dataset to evaluate the proposed
DCC model’s effectiveness on previously unseen cell
images. We used a subset of these images to as-
sess the DCC and compared the counting results
with those obtained using CellProfiler software (Mc-
Quin C, 2018).
4.2 Experimental Setup
We utilized the open-source OpenCV and machine
learning libraries to facilitate the image processing
and training of the DCC model. These were all hosted
on the Google Colaboratory cloud computing plat-
form (Bisong, 2019). We evaluate the proposed DCC
1
https://bbbc.broadinstitute.org/BBBC005/
VISAPP 2025 - 20th International Conference on Computer Vision Theory and Applications
982
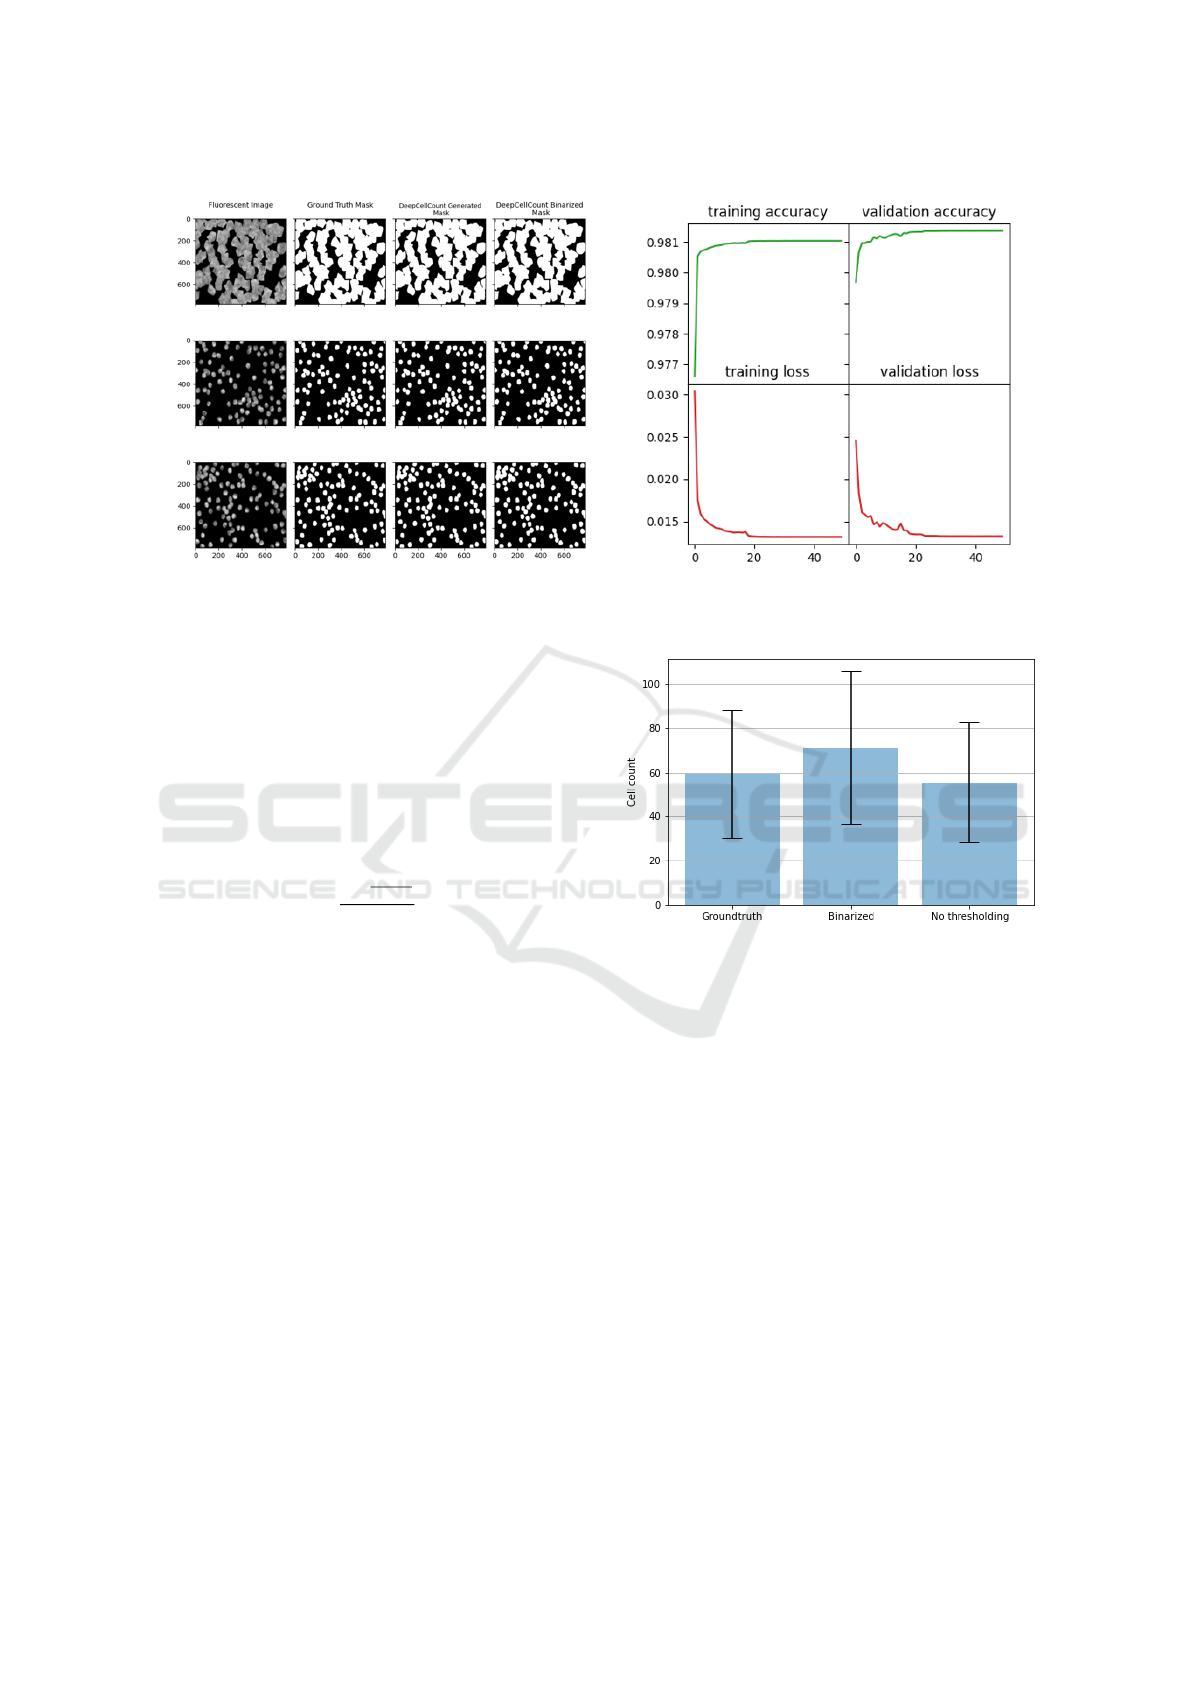
Figure 3: Performances of the DCC model on training and validation data. Left: The outputs of the segmentation model
compared with the ground truth. Right: The training and validation accuracy and loss.
using the dataset described in Section 4.1. Through-
out the experiments, we employ cross-validation to
select the optimal learning rate and batch size for
training the CNN. We assess the performance of the
DCC on the test data by comparing the actual cell
count with the count predicted by the DCC and com-
puting the Mean Absolute Percentage Error (MAPE)
of the predictions. We compute the MAPE as follows
(Tashman, 2000).
MAPE =
∑
K
i
|y
i
− ˙y
i
|
y
i
K
∗ 100
where y
i
represents the expected cell count value, ˙y
i
represents the DCC predicted count value, and K is
the size of the evaluation set. Additionally, we ex-
amined how different thresholding processes on the
segmented cells impacted the cell count predicted by
the DCC. The DCC results were also compared with
those of the CellProfiler software. We discuss the re-
sults of our experimentation in the next section.
4.3 Discussion of Results
Figure 3 displays the accuracy and loss values during
the training of the segmentation model and a qualita-
tive comparison of the segmented cells. The segmen-
tation model of the DCC achieved an accuracy of 98%
on both the training and validation data.
We used the ground-truth mask from the first
dataset discussed in section 4.1 and our DCC-
generated segmented cell images as inputs to eval-
uate the cell counting model’s performance. Fig-
ure 4 compares the DCC cell counting model’s per-
formance segmented cell images (with and without
Figure 4: Comparison of the prediction of the DCC model
(with and without binary (simple) thresholding of the seg-
mented cell images) with the ground truth. The bars show
the average cell count over the entire test dataset.
thresholding) with the original cell counts on the test
set. The proposed DCC model achieved MAPE of
6.82 and 19.65, respectively, confirming its compara-
tively good accuracy for cell segmentation and count-
ing in cell-based biomedical research. The results
also show the importance of thresholding the seg-
mented cell images before counting the cells in them.
We experiment with test images obtained from
cancer research centers (second dataset in Section
4.1) that are dissimilar to the ones used in the training
of our DCC model to assess its robustness. We aimed
to evaluate the model’s performance on densely pop-
ulated cell images and the impact of different thresh-
olding methods, including simple, adaptive, and Otsu,
on the cell count. Figure 5 presents a qualitative
comparison of the cell segmentation on the test im-
ages using the proposed DCC method and CellProfiler
software, demonstrating effective segmentation by the
DeepCellCount: Cell Counting Using Two-Step Deep Learning
983
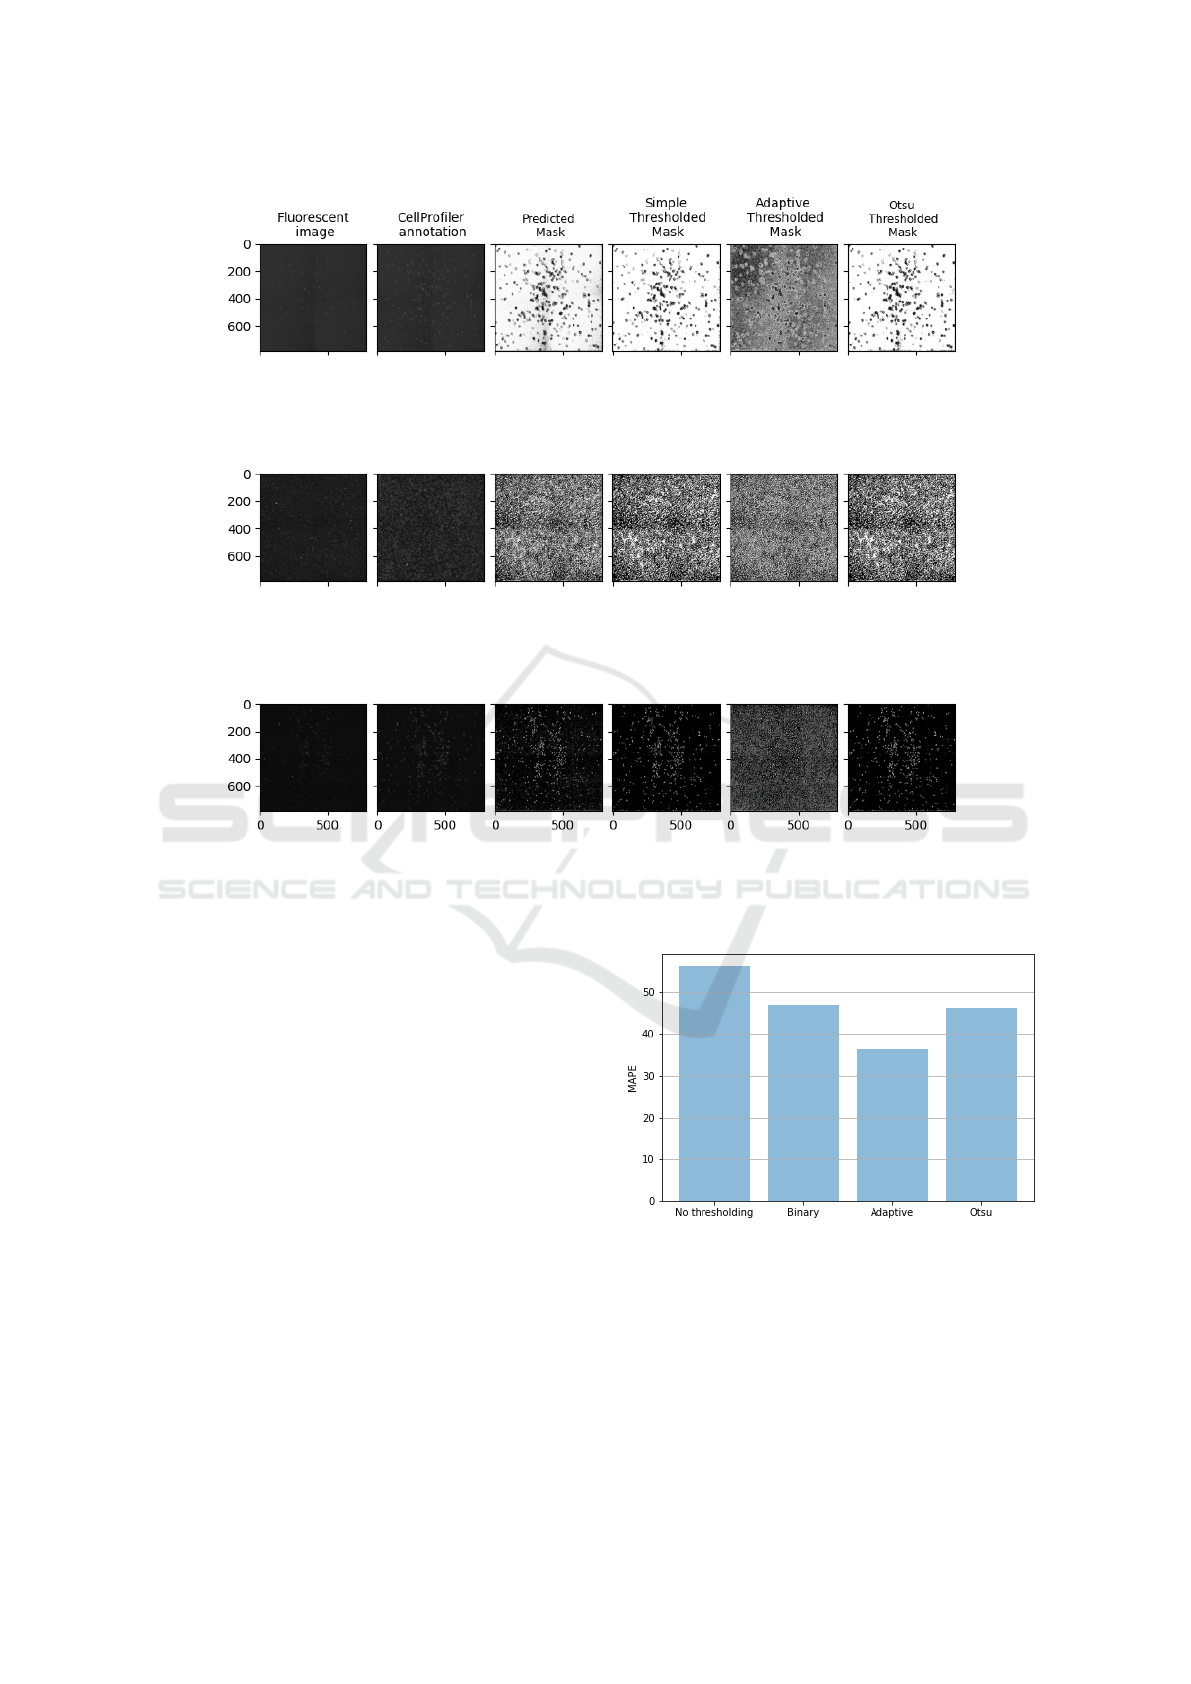
Figure 5: Comparing the performance of the DCC cell image segmentation approach, which utilizes three different thresh-
olding methods, to that of the CellProfiler software. Each row presents the results for a single test fluorescent cell image. The
figure shows that the DCC approach, combined with the thresholding methods, achieves clearer cell segmentation than that
produced by the CellProfiler software.
DCC approach. Additionally, Figure 6 compares the
cell counting performance of the DCC approach on
densely populated cell images with the three thresh-
olding methods applied to the segmented cell images
before counting. The DCC model with the adaptive
thresholding method performed the best, with an av-
erage MAPE of 36.29, while the DCC without thresh-
olding gave the worst performance, with an average
MAPE of 56.30 on the test set with 600 to 700 cells
per image.
The DCC model works well for images with fewer
cells (around 600), showing an average MAPE of
6.82. However, it struggles with densely populated
images, where the MAPE jumps to 36.29. This
drop in performance is partly due to the model be-
ing trained mainly on images with sparsely populated
cells, making it less effective when faced with more
crowded ones. This situation highlights the need for
diverse training datasets to ensure models perform
well in different scenarios.
Figure 6: Performance of the DCC on the cell counting us-
ing densely populated cell images for different thresholding
methods.
5 CONCLUSION
Our project aimed to develop models to segment and
count cells in fluorescent cell images accurately. We
accomplished this by using a two-step process. First,
VISAPP 2025 - 20th International Conference on Computer Vision Theory and Applications
984

we employed a simple U-Net-like encoder-decoder
model to segment cells from the images. Then, we
trained another CNN regressor to count the cells in
the segmented images. We experimented with the use
of CNN regressor for cell counting and showed that a
regression-based counter can perform well. We evalu-
ated the performance of our proposed DCC model on
publicly available cell image datasets and found that
it achieved an average MAPE of 6.82 on the test set.
Additionally, we tested the DCC model on cell
images with densely populated cells acquired from a
cancer research laboratory. We show that the DCC
model achieved an average MAPE of 36.29 with
adaptive thresholding techniques applied to the seg-
mented cell images. Visual results comparing the out-
put of our proposed DCC model with that of Cell-
Profiler software demonstrated that the DCC model
can effectively segment cells compared to the more
complex tool. We observed that the DCC model per-
forms best when the segmented cell image mask is
thresholded using the adaptive thresholding method
and when the mask contains sparsely distributed cells.
REFERENCES
Aldughayfiq, B., Ashfaq, F., Jhanjhi, N., and Humayun,
M. a. (2023). YOLOv5-FPN: A robust framework for
multi-sized cell counting in fluorescence images. Di-
agnostics (Basel, Switzerland), 13:2280.
Bisong, E. (2019). Google Colaboratory, pages 59–64.
Apress, Berkeley, CA.
de Souza Brito, A., Vieira, M. B., De Andrade, M. L. S. C.,
Feitosa, R. Q., and Giraldi, G. A. (2021). Combin-
ing max-pooling and wavelet pooling strategies for se-
mantic image segmentation. Expert Systems with Ap-
plications, 183:115403.
Dogo, E. M., Afolabi, O. J., and Twala, B. (2022). On the
relative impact of optimizers on convolutional neural
networks with varying depth and width for image clas-
sification. Applied Sciences, 12(2323):11976.
Hern
´
andez, C. X., Sultan, M. M., and Pande, V. S. (2018).
Using deep learning for segmentation and counting
within microscopy data. arXiv:1802.10548.
Kataras, T. J., Jang, T. J., Koury, J., Singh, H., Fok, D.,
and Kaul, M. (2023). ACCT is a fast and accessible
automatic cell counting tool using machine learning
for 2D image segmentation. Scientific Reports, 13.
Kugelman, J., Allman, J., Read, S. A., Vincent, S. J., Tong,
J., Kalloniatis, M., Chen, F. K., Collins, M. J., and
Alonso-Caneiro, D. (2022). A comparison of deep
learning u-net architectures for posterior segment oct
retinal layer segmentation. Scientific Reports, 12.
Li, Q. and Shen, L. (2022). Wavesnet: Wavelet integrated
deep networks for image segmentation. In Chinese
Conference on Pattern Recognition and Computer Vi-
sion (PRCV), pages 325–337. Springer.
Liu, Q., Junker, A., Murakami, K., and Hu, P. (2019). Au-
tomated counting of cancer cells by ensembling deep
features. Cells, 8(9):1019.
Lu, M., Shi, W., Jiang, Z., Li, B., Ta, D., and Liu, X.
(2023). Deep learning method for cell count from
transmitted-light microscope. Journal of Innovative
Optical Health Sciences, 16(05):2350004.
McQuin C, Goodman A, C. V. K. L. C. B. K. K. e. a.
(2018). Cellprofiler 3.0: Next-generation image pro-
cessing for biology. PLoS Bioliogy, 7(16).
O
˘
guz, A. and
¨
Omer Faruk Ertu
˘
grul (2023). Introduction to
deep learning and diagnosis in medicine. In Polat, K.
and
¨
Ozt
¨
urk, S., editors, Diagnostic Biomedical Signal
and Image Processing Applications with Deep Learn-
ing Methods, Intelligent Data-Centric Systems, pages
1–40. Academic Press.
Ronneberger, O., Fischer, P., and Brox, T. (2015). U-net:
Convolutional networks for biomedical image seg-
mentation. (arXiv:1505.04597).
Shorten, C. and Khoshgoftaar, T. M. (2019). A survey on
image data augmentation for deep learning. Journal
of Big Data, 6(1):60.
Tashman, L. (2000). Out-of-sample tests of forecasting ac-
curacy: an analysis and review. International Journal
of Forecasting, 16(4):437 – 450.
Vembadi, A., Menachery, A., and Qasaimeh, M. A. (2019).
Cell cytometry: Review and perspective on biotech-
nological advances. Frontiers in Bioengineering and
Biotechnology, 7:147.
Wu, Y. and He, K. (2018). Group normalization. In Pro-
ceedings of the European conference on computer vi-
sion (ECCV).
Zhang, Q., Yun, K. K., Wang, H., Yoon, S. W., Lu, F., and
Won, D. (2021). Automatic cell counting from stimu-
lated raman imaging using deep learning. PLOS ONE,
16(7):e0254586.
DeepCellCount: Cell Counting Using Two-Step Deep Learning
985
