
Assessing Dietary Protein Intake: A Comparative Study of Two
Consumer Mail-In Nutrition Test Kits
Zilu Liang
1,2 a
1
Ubiquitous and Personal Computing Lab, Kyoto University of Advanced Science (KUAS), Kyoto, Japan
2
Institute of Industrial Science, The University of Tokyo, Tokyo, Japan
Keywords:
Protein Intake, Protein Deficiency, Dietary Assessment, Urine Test, Personalized Nutrition, Metabolomics.
Abstract:
This study aimed to compare two consumer-grade mail-in nutrition test kits, Flemi Check and VitaNote, in
measuring protein intake and identifying protein deficiencies. A total of 18 subjects (10 male, 8 female) aged
19 to 36 years participated. Descriptive statistics revealed that most subjects consumed between 60 and 80
grams of protein per day, slightly below the recommended 80 grams. The Flemi Check test identified 15 sub-
jects as protein-deficient, while the VitaNote test identified 11. A significant disparity in protein consumption
measurements was found, with the Flemi Check consistently underestimating protein consumption compared
to the VitaNote test for 16 out of the 18 subjects, with a mean difference of 17.11 grams. However, both kits
showed good agreement in estimating the recommended daily protein intake, with only a 2-gram difference.
Given the high precision of the VitaNote test, the Flemi Check may not be considered as a reliable tool for
assessing protein intake.
1 INTRODUCTION
Protein is a crucial macro-nutrient for building and
maintaining a healthy body for people across all
ages (Antonio et al., 2024; Groenendijk et al., 2019;
Wu, 2016; Paddon-Jones et al., 2015). Protein is es-
sential not only for structural components of the body,
such as muscles, bones, blood, and skin, but also
for regulating body functions, including the produc-
tion of hormones and immune function (Wu, 2016).
Studies have shown that higher protein intake can
help treat or prevent a range of diseases (Wu, 2016;
Layman, 2009; Layman et al., 2008; Madeira et al.,
2021). Conversely, protein deficiency can lead to
many health problems, including sarcopenia in the el-
derly, which is a rick factor for fractures, disability,
and frailty (Groenendijk et al., 2019; Granic et al.,
2018; Wilkinson et al., 2018; Paddon-Jones et al.,
2015).
Despite its importance, many people fail to meet
the recommended daily protein intake. Approximate
70% of people across all age groups do not reach
their protein targets, which vary based on gender, age,
and physical activity levels (Traylor et al., 2018; Wu,
2016; Bauer et al., 2013; Elango et al., 2010). Surveys
a
https://orcid.org/0000-0002-2328-5016
indicate that many people are unsure about whether
they are consuming enough protein or feel that their
intake is insufficient.
Recently, consumer-oriented nutrition testing
kits, particularly those for protein consumption, have
emerged on the market. These services typically
involve collecting a urine sample at home and
mailing it back to the company for analysis, where
urinary metabolites are assessed using proprietary
algorithms. Nutritional studies have shown that ana-
lyzing urinary metabolites is an effective method for
monitoring dietary intake (Rafiq et al., 2021; Posma
et al., 2020; Garcia-Perez et al., 2017) and offers
potential for personalized nutrition (Ulusoy-Gezer
and Rakıcıo
˘
glu, 2024; Cuparencu et al., 2024; Bren-
nan and de Roos, 2023; Adams et al., 2020). Urine
samples provide insights into recent dietary intake,
reflecting consumption from a few hours to several
days (Rafiq et al., 2021). While challenges remain
in developing biomarkers for food intake (Beck-
mann et al., 2020), urine analysis offers several
benefits, including improve objectivity (Ottaviani
et al., 2024), scalability, and affordability com-
pared to blood tests (Ulusoy-Gezer and Rakıcıo
˘
glu,
2024; Garcia-Perez et al., 2017; Bokhof et al., 2010).
This method also provide a non-invasive and practical
906
Liang, Z.
Assessing Dietary Protein Intake: A Comparative Study of Two Consumer Mail-In Nutrition Test Kits.
DOI: 10.5220/0013372600003911
Paper published under CC license (CC BY-NC-ND 4.0)
In Proceedings of the 18th International Joint Conference on Biomedical Engineering Systems and Technologies (BIOSTEC 2025) - Volume 2: HEALTHINF, pages 906-913
ISBN: 978-989-758-731-3; ISSN: 2184-4305
Proceedings Copyright © 2025 by SCITEPRESS – Science and Technology Publications, Lda.

means for individuals to monitor their nutri-
tion (Adams et al., 2020; Liang and Martell, 2015).
These consumer kits promise an easy and acces-
sible way for individuals to track their protein intake
without the need for clinical visits or expensive med-
ical testing. However, it remains unclear how reliable
the results are across different services. This study
aims to investigate the agreement between two pop-
ular protein consumption testing kits: Flemi Check
and VitaNote. Specifically, the study has two primary
objectives. First, we seek to assess the degree of con-
cordance between the two test kits. Given the impor-
tance of accuracy and precision in consumer tests, un-
derstanding their consistency is critical for users trust.
Second, this pilot study aims to estimate the average
daily protein consumption of young adults, a group
often underrepresented in protein intake research. To
the best of our knowledge, this is the first study to
directly compare these two kits and provide data on
protein consumption levels in young adults through
consumer-oriented testing services.
2 METHOD
2.1 Experiment Protocol
Subjects were recruited through the distribution of
flyers around the campus of Kyoto University of Ad-
vanced Science (KUAS). To be eligible, subjects had
to be adults, capable of understanding explanations in
English, and able to attend an in-persona briefing in
the lab. Exclusion criteria included individuals who
had been diagnosed with chronic kidney diseases or
those who weighed over 200 kg, as this exceeds the
measurement range of the body composition analyzer
used in the study. This study was approved by the
ethics review board at KUAS.
The experiment began with a one-on-one briefing
session in the lab. During the briefing, subjects were
first provided with an explanation of the study objec-
tives, data management protocols, and were asked to
sign an informed consent form. Subjects were also
instructed on how to collect and mail their urine sam-
ples. In addition, they completed the questionnaire
attached to each test kit as required by the consumer
services.
At the end of the meeting, we measured the body
composition of the subjects using a Tanita RD-800
body composition analyzer. This device employs
dual-frequency technology for accurate body com-
position measurements with a precision of 50 gram.
By utilizing an 8-electrode grip method, the analyzer
measures body fat percentage, muscle mass, and mus-
cle score for the entire body as well as for five indi-
vidual regions: left arm, right arm, left leg, right leg,
and torso.
2.2 Test Kits
Two consumer-grade mail-in nutrition test kits were
compared in this study. Both test kits analyze uri-
nary metabolites and assess them using proprietary
algorithms. Each kit includes a urine collection con-
tainer, one or two test tubes, a return envelope, and
documents outlining the testing procedures as well as
instructions for obtaining informed consent. These
testing services aim to assist users in making dietary
improvements that align with their nutritional needs.
For certain population, such as women and the el-
derly, who may face challenges in meeting their nu-
tritional requirement through food alone, these ser-
vices can be particularly beneficial. Establishing a
consistent and manageable habit of protein intake is
expected to help mitigate various health issues asso-
ciated with protein deficiency, including frailty (Wu,
2016; Layman, 2009; Layman et al., 2008; Madeira
et al., 2021).
Subjects collected urine samples using the pro-
vided container and test tubes at home, securely close
the lid, and place it in the accompanying plastic bag.
To return the sample to the testing center, subjects
simply placed the urine container in the return enve-
lope and mail it back to the companies. Details of the
two test kits are provided below.
2.2.1 VitaNote
The VitaNote mail-in test kit provides a comprehen-
sive analysis of nutrient imbalances through urine
samples, allowing users to assess the status of 19 key
biomarkers. This includes 17 essential nutrients, such
as proteins, vitamins (e.g., Vitamin D, B1, B2, Niacin,
and B6), and minerals (e.g., sodium, potassium, and
calcium), as well as two health markers: oxidative
stress (rust index) and cytokines (conditioning indi-
cator). The kit offers a detailed evaluation of nutrient
deficiencies or excesses, with accompanying advice
based on results to guide dietary adjustments.
Results are presented on a radar chart in the Vi-
taNote app, allowing users to easily visualize nutri-
ent imbalances. Tapping on each element of the chart
provides more detailed information about that specific
nutrient. A proprietary evaluation index is calculated
based on the intake levels of each nutrient. The Vi-
taNote app also includes educational content on the
role of each nutrient, the risks associated with defi-
ciencies or excesses, and food recommendations for
correcting deficiencies.
Assessing Dietary Protein Intake: A Comparative Study of Two Consumer Mail-In Nutrition Test Kits
907
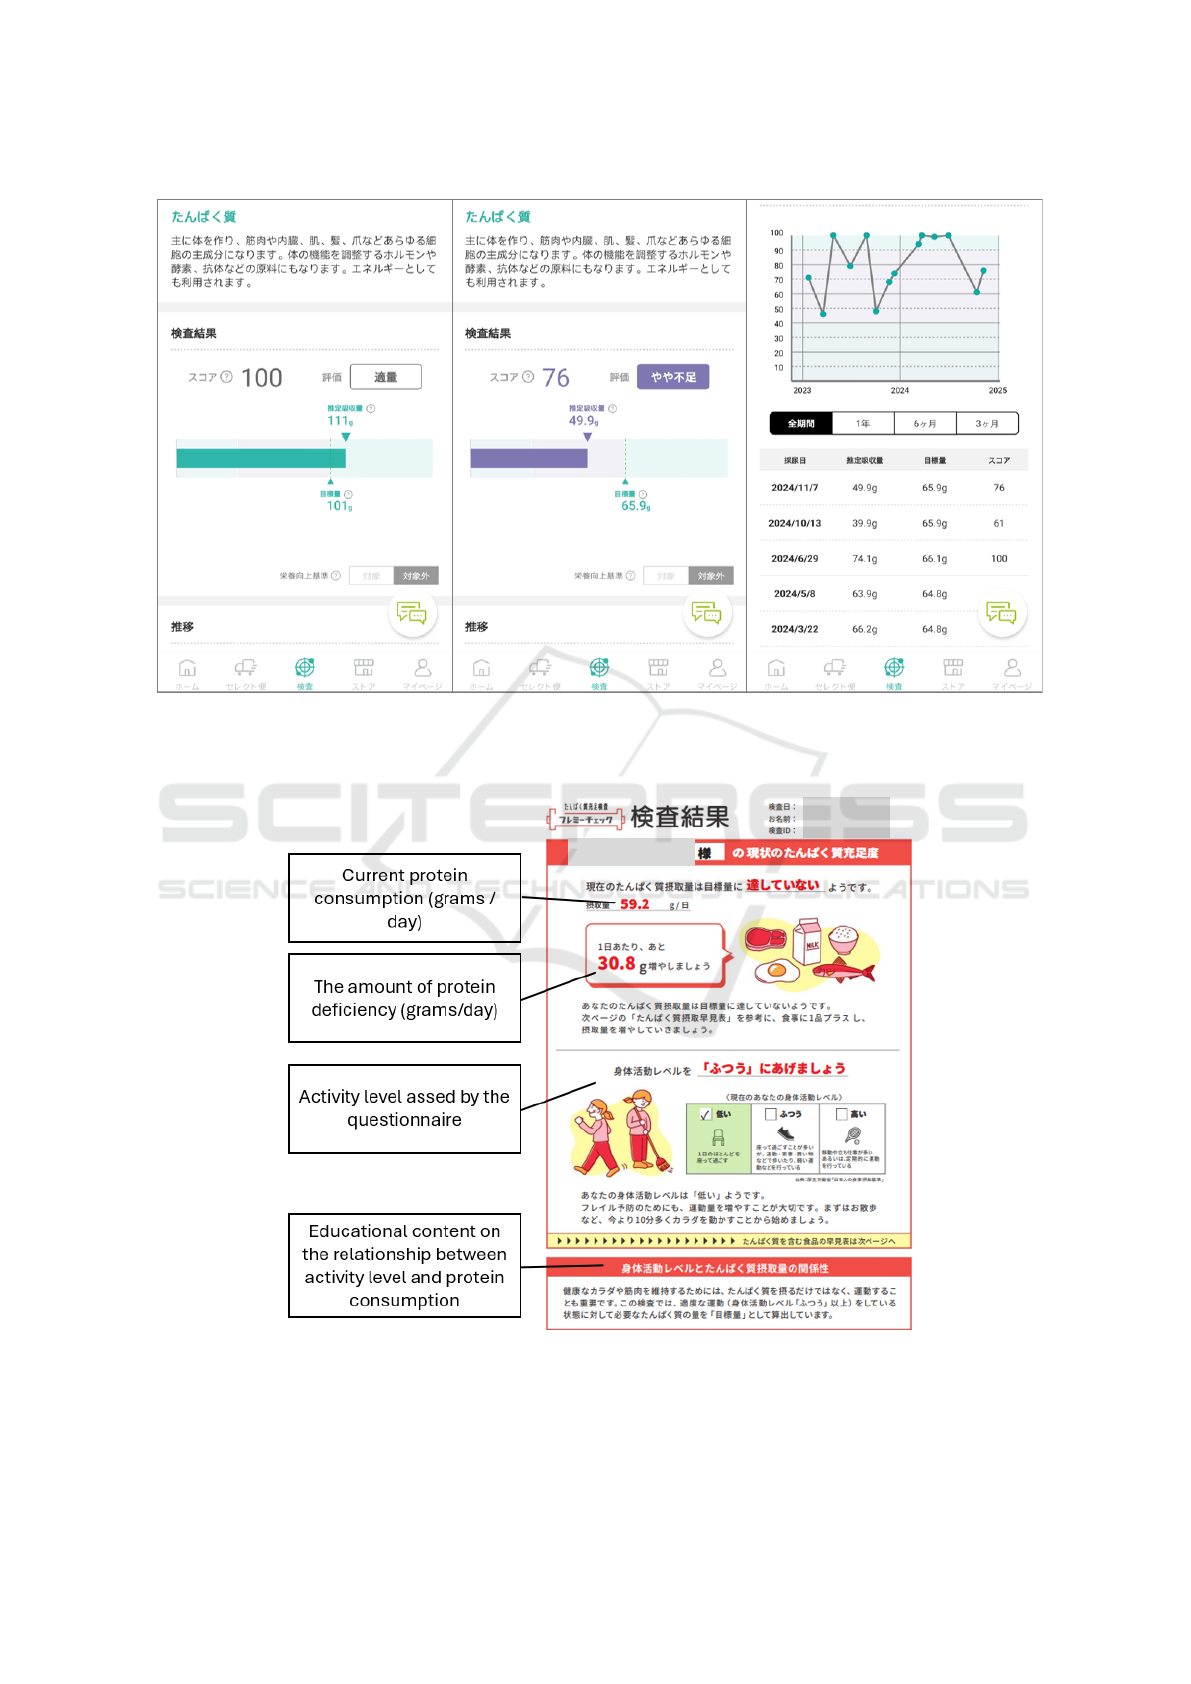
Figure 1: Screenshots of the VitaNote app: Left – an example of sufficient protein intake (111 g versus the recommended
101 g); Middle – an example of insufficient protein intake (49.9 g versus the recommended 65.9 g); Right – a time series plot
showing a user’s protein intake over time.
Figure 2: An example of a Flemi Check report showing the current protein consumption, the amount of deficiency, activity
level assessed by the questionnaire, and educational content on the relationship between activity level and protein consump-
tion.
HEALTHINF 2025 - 18th International Conference on Health Informatics
908

For the purpose of this study, we focus solely
on the measurement of dietary protein consumption.
Some screenshots of the protein measurement results
from the VitaNote app are shown in Figure 1. Accord-
ing to the official website, the precision for measuring
dietary protein consumption is 0.9% (Yukashikado
Inc., 2024). Given the common adopted criteria of 5%
allowable error margin (Maduemem and Rodriguez,
2019; Panteghini et al., 2017), the VitaNote test is
considered to have good accuracy.
2.2.2 Flemi Check
Similar to the VitaNote test, the Flemi Check mail-
in test kit measures dietary protein intake through a
urine sample. It provides insights into current pro-
tein consumption, guidance on how much additional
protein is needed to meet target levels, alongside ad-
vice on activity levels and educational content about
the importance of protein and its sources. However,
the Flemi Check only measures protein and does not
assess other nutrients.
An example of a Flemi Check report is shown in
Figure 2. The report outlines the protein intake mea-
sured from the sample. If intake is insufficient, the re-
port specifies how many additional grams of protein
are needed to reach the target. For individuals with
adequate intake, the report recommends maintaining
their current consumption. The recommended daily
protein intake is calculated by combining measured
intake and any deficiencies. However, for users who
are classified as having sufficient intake, the report
does not include information on the recommended
daily intake.
2.3 Data Analysis
Histograms were created to visualize protein con-
sumption as measured by the two test kits. This al-
lowed for a visual inspection of the distribution of
protein intake for each kit. Bar charts were used to
show the number of subjects categorized as having
sufficient or insufficient protein intake according to
each test kit.
Bland-Altman plots (Bland and Altman, 1986)
were created to assess the level of agreement between
the two test kits. The mean difference and 95% lim-
its of agreement (1.96 ± SD of difference) are also
shown. In clinical settings, if the differences within
the mean equal ± 1.96 standard deviation are not clin-
ically important, then the two test kits are equivalent
and can be used interchangeably (Higgins and Straub,
2006).
3 RESULTS
3.1 Descriptive Statistics
In total 18 subjects (10 male, 8 female) were recruited
for the study. The demographic information and de-
scriptive statistics of protein consumption are sum-
marized in Table 1. The age range of subjects was
between 19 and 36 years at the time of data collec-
tion. Body weight ranged from 51 to 138.5 kg, and
BMI values spanned from 18.1 to 41.8 kg/m
2
. The
majority of subjects reported a medium level of daily
physical activity, while two rated their activity level
as high and one as low. Fourteen subjects engaged
in regular exercise, including activities such as yoga,
cycling, weight training, running, and higher intensity
interval training (HIIT). All subjects followed an om-
nivorous diet, with none adhering to a vegetarian or
vegan diet. Seven subjects were particularly mindful
of their daily protein intake, and four of these were
using protein power supplements. The average rec-
ommended daily protein intake was approximately 80
grams, while actual protein consumption ranged from
60 to 80 grams. On average, subjects were consum-
ing 10 to 20 grams less protein than the recommended
intake.
Table 1: Descriptive Statistics.
Metric Average Range
Age (years) 26 [19, 36]
Body weight (kg) 73.41 [51, 138.5]
Muscle mass (kg) 52.8 [40.75, 81.15]
Fat ratio (%) 19.92 [6, 38.3]
Bone mass (kg) 3.04 [2.5, 4.5]
BMI (kg/m
2
) 25.07 [18.1, 41.8]
Protein consumption
by Flemi Check (g)
61.78 [34.4, 106.4]
Protein deficiency by
Flemi Check (g)
19.24 [0, 52.7]
Recommended Intake
by Flemi Check (g)
80.73 [65, 99]
Protein consumption
by VitaNote (g)
78.89 [30.3, 159]
Protein deficiency by
VitaNote (g)
12.33 [0, 48.5]
Recommended Intake
by VitaNote (g)
82.59 [62.3, 136.7]
Figure 3 and Figure 4 show the distribution of pro-
tein consumption as measured by the two test kits.
Both distributions are skewed to the left, but the Vi-
taNote test has a longer tail on the right, indicating
a wider range of values, with an outlier at the far
right end. Both distributions peak between 40 and 60
Assessing Dietary Protein Intake: A Comparative Study of Two Consumer Mail-In Nutrition Test Kits
909
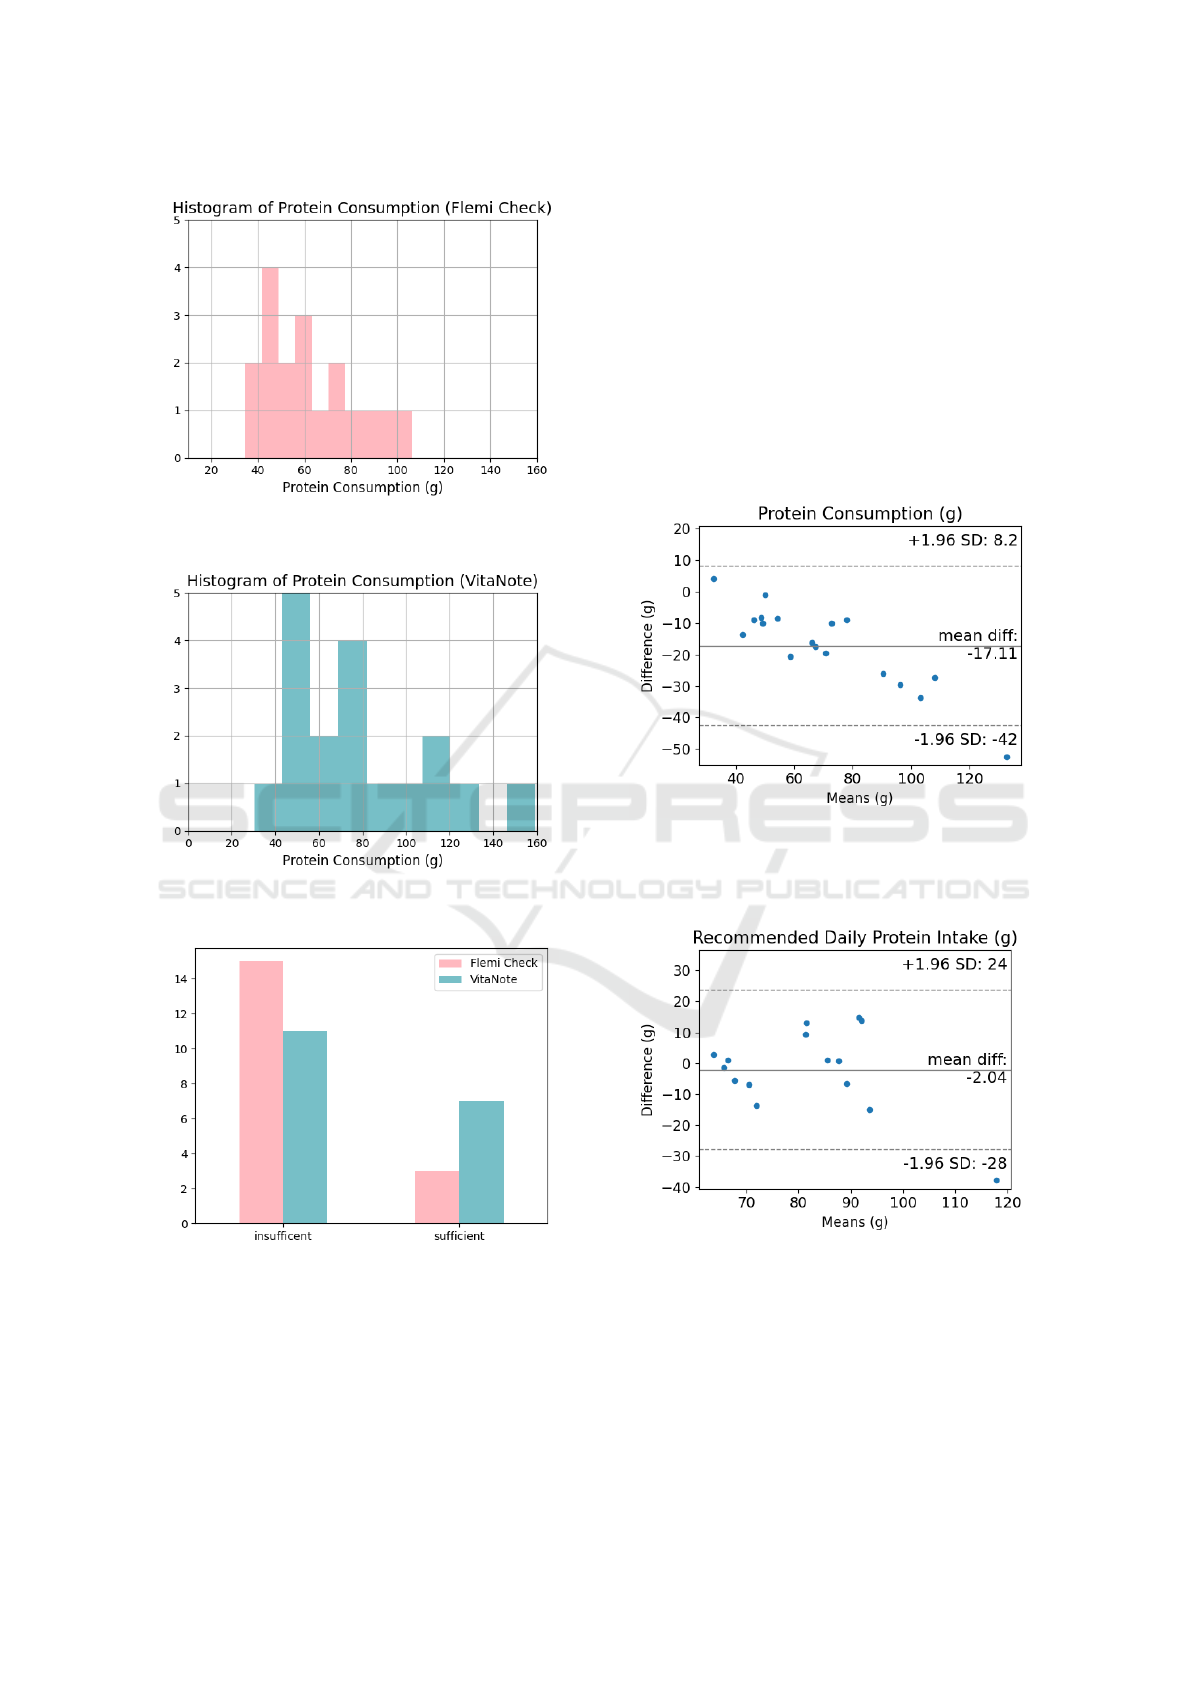
Figure 3: Histogram of protein consumption as measured
by the Flemi Check test kit.
Figure 4: Histogram of protein consumption as measured
by the VitaNote test kit.
Figure 5: Number of subjects identified as protein-sufficient
and protein-insufficient by each test kit.
grams of protein. Correspondingly, 15 subjects were
identified as protein-deficient by the Flemi Check test,
while only 11 subjects were identified as deficient by
the VitaNote test, as shown in Figure 5.
3.2 Agreement between Two Test Kits
As shown in Figure 6, there is a significant disparity
between the two test kits in terms of measured pro-
tein consumption, with a mean difference of 17.11
grams. The Flemi Check kit underestimated protein
consumption for 16 out of the 18 subjects. In addi-
tion, the disparity tended to increase as protein con-
sumption levels rose. On the other hand, the two kits
agreed reasonably well in terms of the recommended
daily protein intake, with a mean difference of only 2
grams, as shown in Figure 7. No significant trend was
observed.
Figure 6: Bland-Altman plot for consumed amount of pro-
tein. The solid line show mean difference, and the dotted
lines show 95% limits of agreement (1.96 ±) SD of differ-
ence.
Figure 7: Bland-Altman plot for recommended amount of
protein. The solid line show mean difference, and the dotted
lines show 95% limits of agreement (1.96 ±) SD of differ-
ence.
HEALTHINF 2025 - 18th International Conference on Health Informatics
910

4 DISCUSSION
Consumer-grade metabolomics test services represent
an emerging field in personalized nutrition. As nu-
tritional research transition from population-based to
personalized approaches, and from controlled labora-
tory settings to free-living environments, it is impor-
tant to evaluate the validity of these testing methods
and their impact on consumers. However, there are
few studies investigating the validity of urine analy-
sis for measuring protein intake (Bokhof et al., 2010).
This study is the first comparative analysis of two
popular consumer mail-in test kits–the Flemi Check
and the VitaNote–for measuring protein intake and
identifying protein deficiencies. Below we discuss the
implications of the findings in this study.
Firstly, this study revealed that the overall protein
intake of the subjects was slightly below the recom-
mended daily intake of 80 grams, with an average
consumption of 60 to 80 grams per day. According to
the VitaNote results, approximately 60% of the sub-
jects were not consuming sufficient protein. This find-
ing aligns with other nutrition studies that show many
individuals fail to meet recommended protein intake
levels (Traylor et al., 2018; Wu, 2016; Bauer et al.,
2013; Elango et al., 2010). Interestingly, the Flemi
Check test identified a larger proportion of subjects
as protein-insufficient compared to the VitaNote test.
Specifically, 15 subjects were classified as deficient
by the Flemi Check test, while only 11 were iden-
tified as deficient by the VitaNote. This discrepancy
suggests that the Flemi Check may be more conserva-
tive in detecting insufficiency or may have a different
threshold for what constitutes a deficiency.
When comparing the two test kits using the Bland-
Altman plot, a significant disparity emerged in terms
of measured protein consumption. The Flemi Check
test consistently underestimated protein consumption
compared to the VitaNote test for 16 out of the 18
subjects, with a mean difference of 17.11 grams. This
raises concerns about the accuracy of the Flemi Check
in capturing actual protein intake. One possible expla-
nation for the lower readings from the Flemi Check
kit could be differences in the analysis method used to
measure protein. Furthermore, at higher consumption
levels, the Flemi Check showed a more pronounced
underestimation.
In contrast to the significant differences observed
in protein consumption measurements, the two kits
showed a much closer agreement when assessing the
recommended daily protein intake. The mean differ-
ence in recommended intake was only 2 grams, in-
dicating that both kits provide similar estimates for
the ideal protein requirements of the subjects. This
consistency suggests that both tools may be using a
similar formula for assessing general protein needs.
Indeed, there are widely accepted methods for esti-
mating protein requirements, which typically suggest
1.2-1.5 grams of protein per kilogram of body weight
per day (Wu, 2016; Deutz et al., 2014; Elango et al.,
2010), adjusted for factors such as activity level, gen-
der, and age group (Weiler et al., 2023; Vieux et al.,
2022; Wu, 2016; Paddon-Jones et al., 2015). No sig-
nificant trend was observed in this regard, supporting
the notion that the two tests are equally effective for
determining the nutritional targets rather than actual
consumption. However, it is worth noting that while
previous study emphasize the importance of factoring
in the type and quality of protein consumed (Vieux
et al., 2022; Wu, 2016; Wu et al., 2012), it remains
unclear whether and how such factors are considered
in the analysis of these test kits.
several limitations should be considered. First,
the test results were not compared to a gold standard
method for measuring protein intake (e.g., validated
dietary recalls (Yuan et al., 2017) or 24-hour urinary
nitrogen analysis (Bingham, 2003)). Without such a
reference, it is challenging to assess the absolute ac-
curacy of either kit. Second, the sample size of 18
subjects is relatively small, which may limit the gen-
eralizability of our findings. Future studies should
incorporate a medical test as a benchmark for com-
parison and include a larger, more diverse sample to
further validate these results and explore the factors
that may influence the accuracy of each test kit.
5 CONCLUSION
In conclusion, while both the Flemi Check and VitaN-
ote test kits provide valuable information on users’
protein intake needs, they differ in their ability to as-
sess actual protein consumption. The Flemi Check
may tend to underestimate protein intake, particularly
at higher levels of consumption, whereas both kits
show good agreement in estimating recommended
protein intake. Given the high precision of the Vi-
taNote test, the Flemi Check may not be considered
as a reliable tool for assessing protein intake.
ACKNOWLEDGEMENTS
The author would like to thank the subjects for their
valuable contribution to this study.
Assessing Dietary Protein Intake: A Comparative Study of Two Consumer Mail-In Nutrition Test Kits
911

REFERENCES
Adams, S. H., Anthony, J. C., Carvajal, R., Chae, L., Khoo,
C. S. H., Latulippe, M. E., Matusheski, N. V., Mc-
Clung, H. L., Rozga, M., Schmid, C. H., Wopereis,
S., and Yan, W. (2020). Perspective: Guiding princi-
ples for the implementation of personalized nutrition
approaches that benefit health and function. Advances
in Nutrition, 11(1):25–34.
Antonio, J., Evans, C., Ferrando, A., Stout, J., Antonio, B.,
Cinteo, H., Harty, P., Arent, S., Candow, D., Forbes,
S., Kerksick, C., Pereira, F., Gonzalez, D., and Krei-
der, R. (2024). Common questions and misconcep-
tions about protein supplementation: what does the
scientific evidence really show? Journal of the Inter-
national Society of Sports Nutrition, 21:2341903.
Bauer, J., Biolo, G., Cederholm, T., Cesari, M., Cruz-
Jentoft, A. J., Morley, J. E., Phillips, S., Sieber, C.,
Stehle, P., Teta, D., Visvanathan, R., Volpi, E., and
Boirie, Y. (2013). Evidence-based recommendations
for optimal dietary protein intake in older people: A
position paper from the prot-age study group. Jour-
nal of the American Medical Directors Association,
14(8):542–559.
Beckmann, M., Wilson, T., Lloyd, A. J., Torres, D. P.,
Goios, A., Willis, N. D., Lyons, L., Phillips, H. C.,
Mathers, J. C., and Draper, J. (2020). Challenges asso-
ciated with the design and deployment of food intake
urine biomarker technology for assessment of habit-
ual diet in free-living individuals and populations—a
perspective. Frontiers in Nutrition, 7.
Bingham, S. A. (2003). Urine nitrogen as a biomarker for
the validation of dietary protein intake. The Journal
of Nutrition, 133(3):921S–924S.
Bland, J. M. and Altman, D. G. (1986). Statistical methods
for assessing agreement between two methods of clin-
ical measurement. The Lancet, 327(8476):307–310.
Originally published as Volume 1, Issue 8476.
Bokhof, B., G
¨
unther, A. L. B., Berg-Beckhoff, G., Kroke,
A., and Buyken, A. E. (2010). Validation of protein
intake assessed from weighed dietary records against
protein estimated from 24 h urine samples in children,
adolescents and young adults participating in the dort-
mund nutritional and longitudinally designed (donald)
study. Public Health Nutrition, 13:826 – 834.
Brennan, L. and de Roos, B. (2023). Role of metabolomics
in the delivery of precision nutrition. Redox Biology,
65:102808.
Cuparencu, C., Bulmus¸-T
¨
uccar, T., Stanstrup, J., la barbera,
G., Roager, H. M., and Dragsted, L. (2024). Towards
nutrition with precision: unlocking biomarkers as di-
etary assessment tools. Nature Metabolism, 6.
Deutz, N. E., Bauer, J. M., Barazzoni, R., Biolo, G., Boirie,
Y., Bosy-Westphal, A., Cederholm, T., Cruz-Jentoft,
A., Krznaric¸, Z., Nair, K. S., Singer, P., Teta, D., Tip-
ton, K., and Calder, P. C. (2014). Protein intake and
exercise for optimal muscle function with aging: Rec-
ommendations from the espen expert group. Clinical
Nutrition, 33(6):929–936.
Elango, R., Humayun, M. A., Ball, R. O., and Pencharz,
P. B. (2010). Evidence that protein requirements have
been significantly underestimated. Current Opinion in
Clinical Nutrition and Metabolic Care, 13:52–57.
Garcia-Perez, I., Posma, J., Gibson, R., Chambers, E.,
Hansen, T., Vestergaard, H., Hansen, T., Beckmann,
M., Pedersen, O., Elliott, P., Stamler, P., Nicholson,
J., Draper, J., Mathers, P., Holmes, E., and Frost, P.
(2017). Objective assessment of dietary patterns by
use of metabolic phenotyping: a randomised, con-
trolled, crossover trial. The Lancet Diabetes & En-
docrinology, 5.
Granic, A., Mendonc¸a, N., Sayer, A. A., Hill, T. R.,
Davies, K., Adamson, A., Siervo, M., Mathers, J. C.,
and Jagger, C. (2018). Low protein intake, muscle
strength and physical performance in the very old:
The newcastle 85+ study. Clinical Nutrition, 37(6,
Part A):2260–2270.
Groenendijk, I., Boeft, L., van Loon, L., and Groot, L.
(2019). High versus low dietary protein intake and
bone health in older adults: a systematic review and
meta-analysis. Computational and Structural Biotech-
nology Journal, 17.
Higgins, P. A. and Straub, A. J. (2006). Understanding the
error of our ways: Mapping the concepts of validity
and reliability. Nursing Outlook, 54(1):23–29.
Layman, D. (2009). Dietary guidelines should reflect new
understandings about adult protein needs. Nutrition &
metabolism, 6:12.
Layman, D., Clifton, P., Gannon, M., Krauss, R., and Nut-
tall, F. (2008). Protein in optimal health: Heart disease
and type 2 diabetes. The American journal of clinical
nutrition, 87:1571S–1575S.
Liang, Z. and Martell, M. A. C. (2015). Framing self-
quantification for individual-level preventive health
care. In International Conference on Health Informat-
ics.
Madeira, T., Severo, M., Oliveira, A., Gorj
˜
ao Clara, J., and
Lopes, C. (2021). The association between dietary
patterns and nutritional status in community-dwelling
older adults-the pen-3s study. European journal of
clinical nutrition, 75.
Maduemem, K. and Rodriguez, Y. (2019). How sensitive
are dipstick urinalysis and microscopy in making di-
agnosis of urinary tract infection in children? Inter-
national journal of preventive medicine, 10:62.
Ottaviani, J. I., Sagi-Kiss, V., Schroeter, H., and Kuhnle,
G. G. (2024). Reliance on self-reports and esti-
mated food composition data in nutrition research in-
troduces significant bias that can only be addressed
with biomarkers. eLife, 13:RP92941.
Paddon-Jones, D., Campbell, W. W., Jacques, P. F.,
Kritchevsky, S. B., Moore, L. L., Rodriguez, N. R.,
and van Loon, L. J. (2015). Protein and healthy ag-
ing234. The American Journal of Clinical Nutrition,
101(6):1339S–1345S.
Panteghini, M., Ceriotti, F., Jones, G., Oosterhuis, W., Ple-
bani, M., and Sandberg, S. (2017). Strategies to define
performance specifications in laboratory medicine: 3
years on from the milan strategic conference. Clinical
Chemistry and Laboratory Medicine (CCLM), 55.
HEALTHINF 2025 - 18th International Conference on Health Informatics
912

Posma, J., Garcia-Perez, I., Frost, G., Aljuraiban, G., Chan,
Q., Horn, L., Daviglus, M., Stamler, J., Holmes,
E., Elliott, P., and Nicholson, J. (2020). Nutri-
ome–metabolome relationships provide insights into
dietary intake and metabolism. Nature Food, 1.
Rafiq, T., Azab, S. M., Teo, K. K., Thabane, L., Anand,
S. S., Morrison, K. M., de Souza, R. J., and Britz-
McKibbin, P. (2021). Nutritional metabolomics and
the classification of dietary biomarker candidates: A
critical review. Advances in Nutrition, 12(6):2333–
2357.
Traylor, D., Gorissen, S., and Phillips, S. (2018). Perspec-
tive: Protein requirements and optimal intakes in ag-
ing: Are we ready to recommend more than the rec-
ommended daily allowance? Advances in Nutrition,
9:nmy003–nmy003.
Ulusoy-Gezer, H. G. and Rakıcıo
˘
glu, N. (2024). The fu-
ture of obesity management through precision nutri-
tion: Putting the individual at the center. Current Nu-
trition Reports, 13:455–477.
Vieux, F., R
´
emond, D., Peyraud, J.-L., and Darmon, N.
(2022). Approximately half of total protein in-
take by adults must be animal-based to meet non-
protein, nutrient-based recommendations, with varia-
tions due to age and sex. The Journal of Nutrition,
152(11):2514–2525.
Weiler, M., Hertzler, S. R., and Dvoretskiy, S. (2023). Is
it time to reconsider the u.s. recommendations for di-
etary protein and amino acid intake? Nutrients, 15(4).
Wilkinson, D., Piasecki, M., and Atherton, P. (2018). The
age-related loss of skeletal muscle mass and function:
Measurement and physiology of muscle fibre atrophy
and muscle fibre loss in humans. Ageing Research
Reviews, 47:123–132.
Wu, G. (2016). Dietary protein intake and human health.
Food Funct., 7:1251–1265.
Wu, G., wu, Z., Dai, Z., Yang, Y., Wang, W., Liu, C., Wang,
B., Wang, J., and Yin, Y. (2012). Dietary require-
ments of “nutritionally non-essential amino acids” by
animals and humans. Amino acids, 44.
Yuan, C., Spiegelman, D., Rimm, E. B., Rosner, B. A.,
Stampfer, M. J., Barnett, J. B., Chavarro, J. E., Subar,
A. F., Sampson, L. K., and Willett, W. C. (2017).
Validity of a dietary questionnaire assessed by com-
parison with multiple weighed dietary records or 24-
hour recalls. American Journal of Epidemiology,
185(7):570–584.
Yukashikado Inc. (2024). Mail-in nutrition test kit vitanot.
https://vitanote.jp/service/vitanote. Accessed: 2024-
12-16.
Assessing Dietary Protein Intake: A Comparative Study of Two Consumer Mail-In Nutrition Test Kits
913
