
Multivariate Time Series Visualization for a Single Individual: A Scoping
Review Using PRISMA-ScR
Hugo Le Baher
1,2,4 a
, J
´
er
ˆ
ome Az
´
e
1 b
, Sandra Bringay
1,3 c
, Pascal Poncelet
1 d
,
Arnaud Sallaberry
1,3 e
and Caroline Dunoyer
4,5 f
1
LIRMM, UMR 5506, University of Montpellier, CNRS, Montpellier, France
2
5 DEGR
´
ES, Paris, France
3
AMIS, Paul-Val
´
ery University of Montpellier, Montpellier, France
4
Health Data Science Unit, Public Health Service, Centre Hospitalier Universitaire de Montpellier, Montpellier, France
5
Desbrest Institute of Epidemiology and Public Health, UMR UA11, University of Montpellier — Inserm, Montpellier,
France
{hlebaher, aze, sandra.bringay, poncelet, arnaud.sallaberry}@lirmm.fr, c-dunoyer@chu-montpellier.fr
Keywords:
Scoping Review, Visualisation Design and Techniques, Temporal Data, Multivariate Data, Healthcare.
Abstract:
The digitization of hospital information systems is becoming widespread, enabling the increasing integration
of interactive visualization methods into decision support systems. This development facilitates the anticipa-
tion of critical risks in monitored patients and helps reduce the workload of healthcare providers. However,
Electronic Health Records (EHRs) contain large, heterogeneous, and temporal data. Then, providing tools to
understand these complex data is a challenge. Using PubMed and Google Scholar, we conducted a search for
articles using keywords related to time, visualization, and data. Out of 3,197 retrieved articles, we identified
111 relevant ones through clustering. Applying exclusion criteria to focus on implemented prototypes, we
manually annotated 21 articles for our review. This exploratory literature analysis reveals that while this re-
search area has garnered recent interest, it demonstrates limitations in the proposed solutions. Few approaches
employ temporal axis distortion, and no approach in the medical domain visually integrates model predictions.
The study highlights preferred functionalities for the visual representation of multivariate temporal data, such
as parallel time series and hierarchical views.
1 INTRODUCTION
The digitization of healthcare systems has recently
experienced significant development. It promises to
reduce diagnostic and treatment errors, avoid redun-
dant testing, and guide more efficient allocation of
healthcare resources, while fostering innovation in
preventive and therapeutic approaches. Healthcare
professionals use them daily to make critical deci-
sions and monitor the effects of treatments or medical
procedures in typically high-pressure environments.
These records improve the continuity and relevance
of care while facilitating communication and coordi-
a
https://orcid.org/0000-0003-3107-7070
b
https://orcid.org/0000-0002-7372-729X
c
https://orcid.org/0000-0002-2830-3666
d
https://orcid.org/0000-0002-8277-3490
e
https://orcid.org/0000-0001-7068-176X
f
https://orcid.org/ 0000-0002-6789-4075
nation between patients and healthcare professionals.
Researchers leverage them to extract medical data, for
instance, to improve patient inclusion rates in clini-
cal trials, while data engineers use them to correct er-
rors, among other applications. While the main lim-
itations of EHRs, such as integration within a single
information system and interoperability, are now be-
ing addressed, current EHR implementations can still
be improved.
The global assessment of a patient’s condition
is generally performed by analyzing the variations
over time of one or several heterogeneous vari-
ables. For instance, if the measured white blood cell
count and the patient’s temperature increase simul-
taneously, an ongoing infection is suspected. Sim-
ilarly, if hemoglobin levels and platelet counts de-
crease rapidly, a hemorrhage is likely suspected in
the patient. The goal of the current study is to iden-
tify visual features for representing temporal and mul-
tivariate data, i.e., involving more than two distinct
Le Baher, H., Azé, J., Bringay, S., Poncelet, P., Sallaberry, A. and Dunoyer, C.
Multivariate Time Series Visualization for a Single Individual: A Scoping Review Using PRISMA-ScR.
DOI: 10.5220/0013373000003912
Paper published under CC license (CC BY-NC-ND 4.0)
In Proceedings of the 20th International Joint Conference on Computer Vision, Imaging and Computer Graphics Theory and Applications (VISIGRAPP 2025) - Volume 1: GRAPP, HUCAPP
and IVAPP, pages 975-982
ISBN: 978-989-758-728-3; ISSN: 2184-4321
Proceedings Copyright © 2025 by SCITEPRESS – Science and Technology Publications, Lda.
975

variables evolving over time. More specifically, our
aim is to explore visualizations that provide both a
global and detailed view of heterogeneous multivari-
ate temporal data. To achieve this, we conducted an
exploratory review of the literature.
The motivations and state-of-the-art analyses con-
ducted on similar topics are discussed in Section 2.
The protocol and criteria used for the analysis are de-
tailed in Section 3. The results obtained through man-
ual annotation are presented in Section 3.6. Finally,
Section 4 synthesizes these results and concludes this
part with a discussion.
2 RELATED WORK
The visual analysis of multivariate temporal data is
used in various fields, such as financial analysis (Yue
et al., 2019), history (Zhang et al., 2023), and story-
telling support (Shin et al., 2023). In the medical field,
specifically, the visualization of data from Electronic
Health Records (EHR) has been extensively studied.
Previous research has synthesized the common char-
acteristics of these visualizations and their associated
functionalities, which will serve as the foundation for
this literature review.
During the 2010s, several reviews focused on the
visual representation of multivariate temporal data in
the medical domain. Specifically, the following sec-
tion highlights reviews addressing EHR visualization.
(Combi et al., 2010) established a taxonomy of visu-
alization methods, distinguishing whether they repre-
sent a single individual, such as a patient, or an en-
tire cohort. (Aigner et al., 2011)
1
provided a detailed
study of approaches for representing temporal data
for one or more individuals. Their study extended
beyond the medical domain. (Rind et al., 2013) fo-
cused on 14 specific approaches applied in the medi-
cal field, also distinguishing between individual and
cohort representations. Finally, (West et al., 2015)
employed the PRISMA protocol (Preferred Reporting
Items for Systematic Reviews and Meta-Analyses)
(Moher et al., 2009) for a systematic review of EHR
data visualization approaches. They highlighted an
increase in publications in this domain up until 2012,
when their work was conducted. The authors em-
phasized the need for further research focused on
representing large-scale multivariate data on a single
screen and addressing the representation of missing
data, which remain relevant challenges.
Since 2019, new reviews have been proposed.
(Scheer et al., 2022) utilized an extension of the
1
See https://browser.timeviz.net/, accessed 01/08/2024,
for a comprehensive directory of techniques.
PRISMA protocol, PRISMA-ScR (PRISMA Exten-
sion for Scoping Reviews) (Tricco et al., 2018), to
describe 22 approaches focused on cohorts, differing
from the patient-centered approach that is the focus of
this chapter. (Wang and Laramee, 2022) proposed a
detailed taxonomy of 51 studies restricted to the med-
ical domain. The authors noted that the inclusion of
machine learning models is a recent trend. However,
their study did not distinguish between approaches
designed for individual patients and those for cohorts.
The systematic review by (Turchioe et al., 2019) fo-
cused on patient-oriented visualizations, highlighting
the current lack of solutions. Their taxonomy of dis-
played data, visual encodings, and evaluation meth-
ods compared 39 approaches, 80% of which repre-
sented longitudinal data using line charts.
The review of these studies reveals the absence of
a synthesis specifically dedicated to visualizing pa-
tient trajectories characterized by multivariate tempo-
ral data.
3 METHODOLOGY
We conducted an exploratory literature review focus-
ing on visualizations representing a single individ-
ual. Our approach extends the protocol proposed by
(Scheer et al., 2022), which is based on the PRISMA-
ScR protocol (Tricco et al., 2018). To assess the pres-
ence of functionalities not yet implemented in medi-
cal approaches, we also included studies from fields
outside of healthcare to explore the representation of
multivariate records of a single individual on a time-
line in a broader context. The complete protocol is
represented by a flow diagram adapted from (Had-
daway et al., 2022), as illustrated in Figure 1. The
diagram details the successive steps of the protocol,
described in the following sections.
3.1 Information Sources and Query
Definition
To identify relevant articles across all application do-
mains, we queried the specialized healthcare database
PubMed
2
as well as the generalist database Google
Scholar
3
. This search was conducted on Novem-
ber 13, 2023, using the Python libraries Pymed
4
and
2
https://pubmed.ncbi.nlm.nih.gov/, accessed on
05/04/2024.
3
https://scholar.google.com/, accessed on 05/04/2024.
4
https://github.com/gijswobben/pymed, accessed on
05/04/2024.
IVAPP 2025 - 16th International Conference on Information Visualization Theory and Applications
976
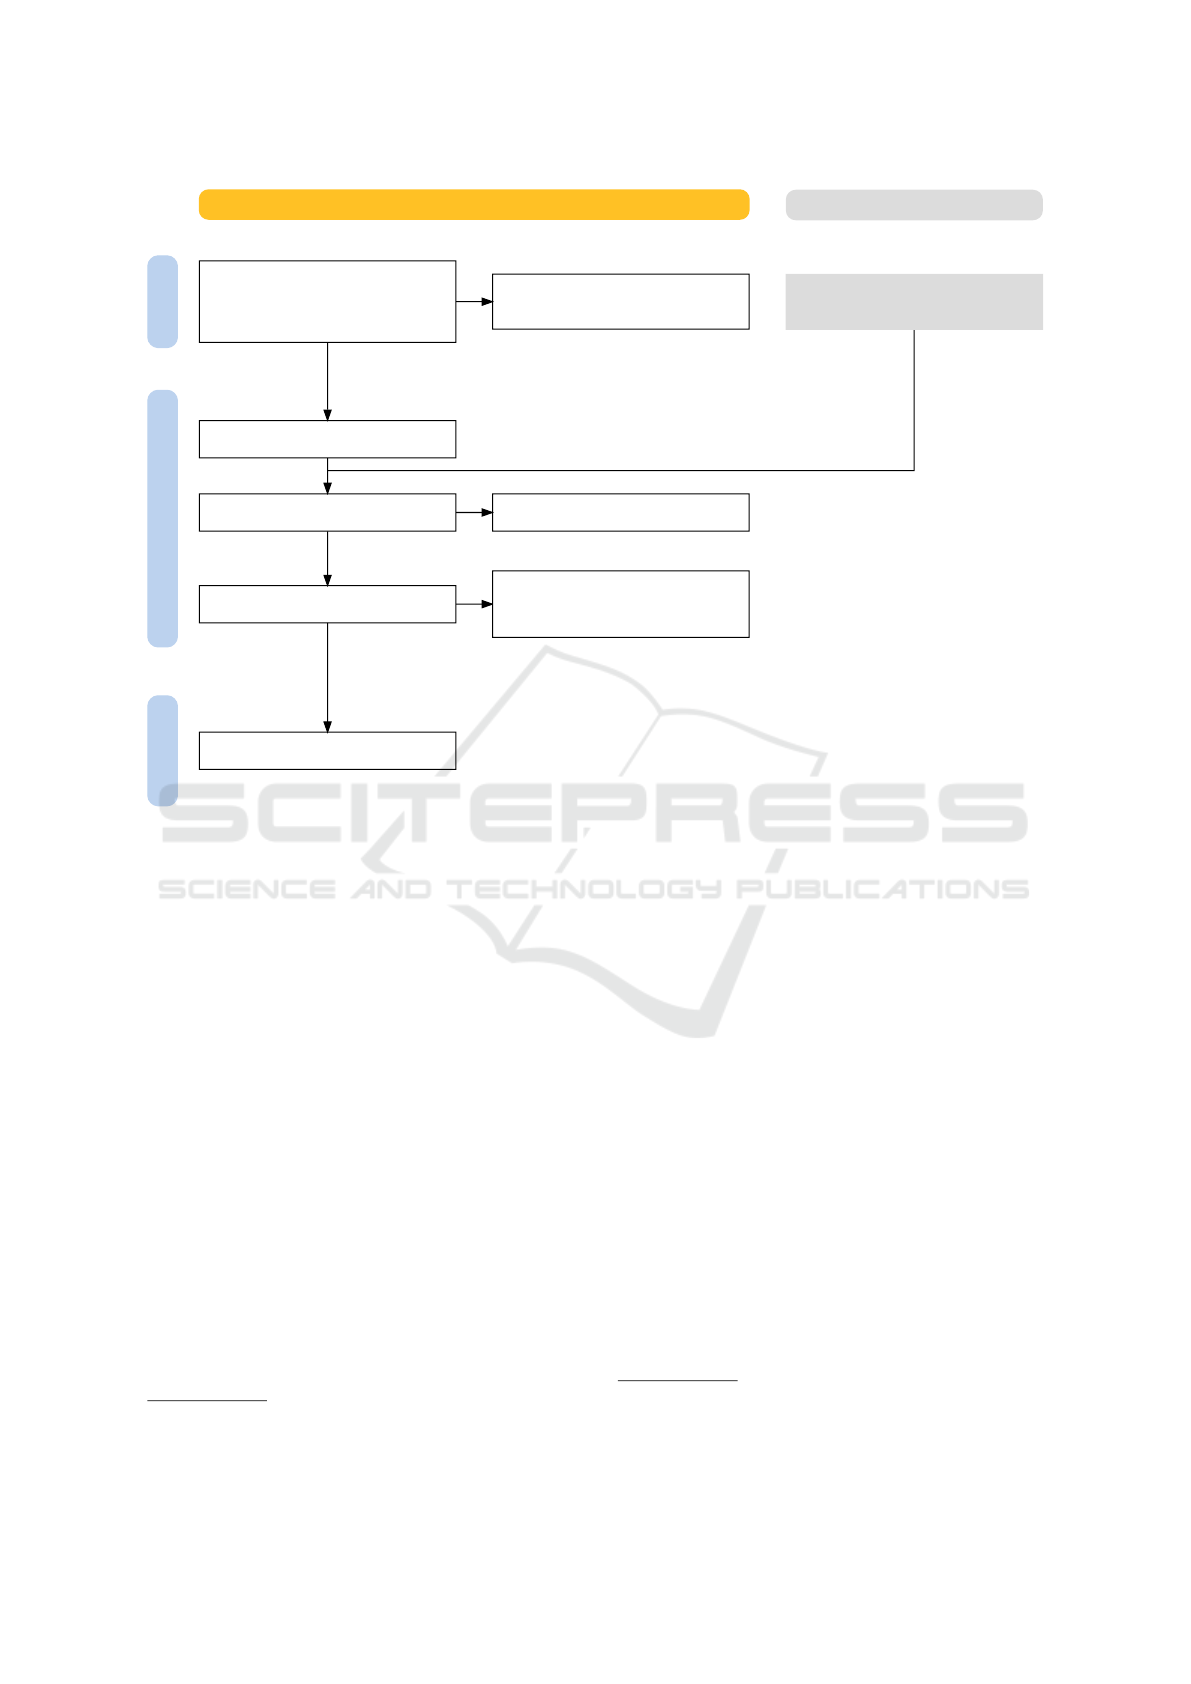
Identification
Selection
Inclusion
Identification of studies via databases and registers
Documents identified via databases:
Pubmed (n 2,166
Google Scholar (n 1,031
Total (n 3,197
Documents excluded before screening:
Excluded by BERTopic (n 3,086
Pre-selected Documents
(n 111
Documents sought
(n 141
Documents not retrieved
(n 7
Documents assessed
(n 134
Documents excluded:
1. No implementation (n 33
2./3./4. Other criteria (n 80
Included Documents in Review
(n 21
Citation-based identification
of new studies
Documents identified via:
Manual citation search (n 30
Section (3.1)
Section (3.2)
Section (3.4)
Section (3.3)
Figure 1: Flow diagram illustrating the number of documents at each stage of the PRISMA-ScR process. Diagram adapted
from the work of (Haddaway et al., 2022).
Scholarly
5
. The query used in (Scheer et al., 2022)
incorporates four key concepts: time, visualization,
data, and medicine. To broaden our scope and iden-
tify approaches for visualizing temporal data across
all fields, we retained only the keywords for the three
concepts: ”time”, ”visualization”, and ”data”. The
query is detailed in Table 1. At the end of this step,
we obtained 3,197 documents.
3.2 Semi-Automatic Preselection of
Articles
Among the query results, a significant number of ar-
ticles were unrelated to temporal data visualization
interfaces. Manually annotating thousands of docu-
ments to select relevant articles is a costly process,
feasible only with a large team of evaluators. For this
reason, we opted for an initial selection using semi-
automatic tools.
We applied a topic extraction algorithm called
BERTopic (Grootendorst, 2022). BERTopic is based
on BERT (Bidirectional Encoder Representations
5
https://github.com/scholarly-python-
package/scholarly, accessed on 05/04/2024.
from Transformers), an unsupervised deep language
representation model that has shown strong perfor-
mance in topic extraction tasks (Devlin et al., 2019).
BERTopic uses a variation of TF-IDF to extract rel-
evant topics from texts and clusters them accord-
ing to these topics. The application of BERTopic to
the titles, abstracts, and keywords of the documents
obtained in the previous step, categorized the arti-
cles into 11 clusters, each corresponding to scien-
tific themes. To ensure that the automatic clustering
aligned with our preselection criteria, we included 19
articles cited in the reviews within our target domain
6
.
These reviews, described in Section 2, all pertain to
medical data visualization. Of the 19 articles, 14 were
placed in the same cluster, which we selected for fur-
ther analysis. This cluster contained a total of 111
documents and was associated with keywords such as
data, visualization, and visual. At the end of this step,
we retained 111 documents.
6
These 19 articles were manually identified through ci-
tation analysis and literature reviews conducted at both the
national and international levels.
Multivariate Time Series Visualization for a Single Individual: A Scoping Review Using PRISMA-ScR
977

Table 1: Search keywords by theme used in the PubMed engine. Due to the limitations of the Google Scholar search engine,
the suffix “[tiab]”, which restricts the search to the title and abstract content only, was removed from each keyword. Addi-
tionally, keywords containing the “*” were expanded (e.g., “timeframe*” becomes “timeframe OR timeframes”).
Time
(“temporal data”[tiab] OR “temporal sequence*”[tiab] OR “temporal pattern*”[tiab] OR “temporal abstrac-
tion*”[tiab] OR “temporal event*”[tiab] OR “time sequence*”[tiab] OR “time series”[tiab] OR “time pe-
riod*”[tiab] OR “time frame*”[tiab] OR “timeframe*”[tiab] OR timeline*[tiab] OR time-oriented[tiab] OR
(time[tiab] AND events[tiab])) AND
Visualization
(visuali*[tiab] OR “visual analy*”[tiab]) AND
Data
(data[tiab] OR information[tiab])
3.3 Manual Citation-Based Search for
Articles
To complement the semi-automatic approach and en-
sure the most comprehensive selection of documents,
we manually extracted citations from review articles
dedicated to the representation of temporal data in the
medical domain (Combi et al., 2010) (Aigner et al.,
2011) (Rind et al., 2013) (West et al., 2015) (Turchioe
et al., 2019) (Scheer et al., 2022). Documents identi-
fied in these literature reviews that were not included
in the results of the previous step were retained. This
additional search identified 30 additional documents,
bringing the total number of selected documents to
141.
3.4 Evaluation by a Reviewer
To ensure that the selected articles aligned with our
context, they were analyzed by a reviewer specializ-
ing in interface development for the medical domain.
Of the documents identified in the previous steps, 7
could not be retrieved, resulting in a final total of 134
documents. Articles were retained if they met the fol-
lowing four criteria:
1. They present an implemented application tested
on real or simulated data. This excludes articles
describing a proof of concept, evaluation proto-
col, assessment of a visual or technical aspect, or
a literature review.
2. They provide a view of an individual targeted by
the user, extracted from a dataset. This excludes
articles presenting only a synthetic view of the en-
tire dataset or a subset of it.
3. They project data onto a single or synchronized
temporal axis across different views.
4. They display multivariate or multimodal data re-
lated to the targeted individual.
Among the 134 documents reviewed, 33 were ex-
cluded for failing to meet the first criterion, and 80
did not meet the other three criteria. At the end of this
step, 21 documents were retained.
3.5 Information Extraction from
Articles
To extract relevant information, we developed a ques-
tionnaire that was refined over two successive itera-
tions to characterize the content of the articles. These
criteria are presented in the following two paragraphs:
first, the functionalities, and then the evaluation meth-
ods used. Specifically, the functionalities describe the
visual encodings chosen to represent the data or the
interactions enabling the user to modify the display.
In all cases, a criterion is satisfied if the stated as-
sertion applies to the content of the annotated article.
The assertion must be explicitly confirmed within the
article text or illustrations.
Functionalities. The following criteria describe the
interface’s ability to present the entirety of the data
within the pathway in a detailed and readable manner:
• Context and Focus: The user can choose to dis-
play a specific area or element in detail while al-
ways being able to assess the context in which the
targeted area is embedded.
• Expansion and Reduction: The interface offers
the choice between a compact or detailed view of
an element.
• Minimum Granularity: The interface displays
the finest possible representation of the data.
The following criteria describe the visual methods
used to represent patient pathway records. Two crite-
ria describe the heterogeneous or structured nature of
the records:
IVAPP 2025 - 16th International Conference on Information Visualization Theory and Applications
978

Table 2: Synthesis of the content of the 21 identified articles on functionalities and interactions, based on the criteria developed
in Section 3.5.
Context and Focus
Expansion and Reduction
Minimum Granularity
Multimodal
Hierarchy
Temporal Distortion
Time Series
Importance
Plages standard
Standard Ranges
Missing Values
Proximity Map
Prediction
Open Environment
General Individual Information
LifeLines (Alonso et al., 1998) ✓ ✓ ✓
KNAVE-II (Martins et al., 2004) ✓ ✓ ✓
MIDGARD (Bade et al., 2004) ✓ ✓ ✓ ✓ ✓ ✓
Caregiver (Brodbeck et al., 2005) ✓ ✓ ✓ ✓ ✓
CareVis (Aigner and Miksch, 2006) ✓ ✓ ✓ ✓ ✓ ✓
Lung Transp. (Pieczkiewicz et al., 2007) ✓ ✓ ✓ ✓
TimeLine (Bui et al., 2007) ✓ ✓ ✓ ✓ ✓ ✓
MIVA (Faiola and Newlon, 2011) ✓ ✓ ✓ ✓ ✓
VisuExplore (Rind et al., 2011) ✓ ✓ ✓ ✓
CareCruiser (Gschwandtner et al., 2011) ✓ ✓ ✓ ✓
UHS Lifelines (Hales et al., 2019) ✓ ✓
Tumor Board (Steinhauer et al., 2020) ✓ ✓ ✓
ClinicalPath (Linhares et al., 2023) ✓ ✓ ✓ ✓ ✓ ✓ ✓
LastHistory (Baur et al., 2010) ✓ ✓ ✓
ChronoLenses (Zhao et al., 2011) ✓ ✓ ✓ ✓ ✓
Temporal MDS (J
¨
ackle et al., 2016) ✓ ✓ ✓ ✓
BitExtract (Yue et al., 2019) ✓ ✓ ✓
PromotionLens (Zhang et al., 2022) ✓ ✓ ✓ ✓ ✓ ✓
Roslingfier (Shin et al., 2023) ✓ ✓ ✓ ✓
Life Mountain (Zhang et al., 2023) ✓ ✓ ✓ ✓ ✓ ✓
LiveRetro (Wu et al., 2023) ✓ ✓ ✓ ✓ ✓
8 1 13 5 11 4 16 4 5 8 0 5 2 3 9
Functionalities
Medical
Non-medical
Total :
• Multimodal: The interface displays numerical or
categorical data alongside data of different types,
such as text, images, etc.
• Hierarchy: The interface displays data organized
hierarchically with two or more levels. This struc-
ture must be visible.
Two additional criteria describe the temporal as-
pect of the records:
• Temporal Distortion: The interface displays the
temporal axis on a non-linear scale to emphasize
certain areas.
• Time Series: The interface shows the evolution
of multiple continuous variables along a temporal
axis.
Four criteria describe the interface’s ability to
highlight key elements important for decision-making
or understanding trends and data quality. Visual em-
phasis can be applied as follows:
• Importance: The interface draws attention to im-
portant values, with importance determined by
variable criteria.
• Standard Ranges: The interface visually distin-
guishes measurements whose values fall outside
standard ranges.
• Missing Values: The interface highlights data
types or points that might be missing in the pre-
sented data. It also visually represents the absence
of numerical values in series.
Two criteria describe the interface’s ability to
leverage an underlying predictive model to provide
additional information:
• Proximity Map: The interface includes a panel
showing relationships or proximity of the targeted
Multivariate Time Series Visualization for a Single Individual: A Scoping Review Using PRISMA-ScR
979

Table 3: Synthesis of the content of the 21 identified articles
on evaluation methods, based on the criteria developed in
Section 3.5.
Accuracy
Resolution Time
Graded Questions
Open-Ended Questions
Open Feedback
Think-Aloud Protocol
Case Study
LifeLines ✓ ✓ ✓
KNAVE-II ✓ ✓ ✓
MIDGARD ✓
Caregiver ✓
CareVis ✓
Lung Transp. ✓ ✓
TimeLine
MIVA ✓ ✓ ✓
VisuExplore ✓ ✓
CareCruiser ✓
UHS Lifelines
Tumor Board ✓
ClinicalPath ✓ ✓ ✓ ✓ ✓
LastHistory ✓ ✓ ✓
ChronoLenses
Temporal MDS ✓
BitExtract ✓
PromotionLens ✓ ✓ ✓
Roslingfier ✓ ✓ ✓
Life Mountain ✓ ✓ ✓ ✓
LiveRetro ✓
6 5 8 4 4 0 1
Evaluation
Medical
Non-medical
Total :
individual to other individuals. These relation-
ships are derived from a predictive model or di-
rectly from the data.
• Prediction: The interface visually integrates pre-
dictions from an underlying model into the data
presentation.
Two additional criteria complete the set of criteria
already outlined:
• Open Environment: The interface displays data
from an open data model or allows the user to up-
load their data in an interoperable format.
• General Individual Information: The interface
includes a panel displaying general information
about the targeted individual.
Evaluation. The following seven criteria describe
the evaluation process for the interface:
• Accuracy: Participants are required to solve
closed tasks using the interface, and the success
rate in resolving these tasks is measured.
• Resolution Time: Similarly, the time required to
complete each task is measured.
• Graded Questions: Participants respond to tar-
geted questions about specific aspects of their in-
terface usage on a predefined scale. This can be
binary options (Yes/No), a numerical scale like
the Likert scale (Likert, 1932) (1–5), a criticality
scale, etc.
• Open-Ended Questions: Similarly, participants
answer questions without constraints on their re-
sponses.
• Open Feedback: After using the interface, par-
ticipants are invited to share their experience with-
out restrictions.
• Think-Aloud Protocol: During interaction with
the interface, participants are encouraged to artic-
ulate their thought process, exploration, and inter-
action strategies, as well as any factors aiding in
problem resolution.
• Case Study: The usage scenario of the interface
by a participant is described in detail. The par-
ticipant’s interaction with the interface is directed
toward solving a pre-identified task.
3.6 Results
The results are presented in Tables 2 and 3. We distin-
guish studies originating in the medical domain from
those in other fields, sorted by publication date.
The following observations are derived from the
data presented in Table 2, which addresses function-
alities and interactions. According to our findings, no
approach facilitates easy identification of missing val-
ues. Most approaches display multivariate temporal
data as parallel time series (16 out of 21). Few ap-
proaches are compatible with open environments (3
out of 21). Temporal distortion is rarely utilized (4
out of 21). Not all approaches display raw data with
the finest possible granularity (13 out of 21 do). Few
approaches support multimodal data visualization (5
out of 21). Additionally, none of the approaches in
the medical domain provide latent space exploration
through predictions or the projection of similar indi-
viduals.
The following observations are based on the data
presented in Table 3, which focuses on methods for
evaluating the needs that visual solutions should ad-
dress. Some approaches incorporate user-centered de-
sign (9 out of 21), but all address identified user needs.
IVAPP 2025 - 16th International Conference on Information Visualization Theory and Applications
980

Qualitative and quantitative evaluations are combined
only in the most recent approaches. None of the ap-
proaches identified in this study report collecting par-
ticipants’ think-aloud reflections to supplement qual-
itative results. Methods for collecting user-centered
needs are challenging to classify, as each identified
study presents a distinct protocol.
4 DISCUSSION
The methodology presented in this section, although
based on the principles of the PRISMA-ScR method,
has certain limitations. First, the query defined in Sec-
tion 3.1 resulted in documents that were unrelated to
the research question addressed in this chapter. Re-
fining the combination of keywords could reduce the
number of irrelevant documents. Furthermore, the
success of using a semi-automatic approach, as de-
scribed in Section 3.2, to filter similar approaches
depends on the quality of the partitioning algorithm.
In this work, we used only the BERTopic algorithm
(Grootendorst, 2022), but it could be compared to
other approaches, particularly LDA (Blei et al., 2003).
Enhancing the representation of articles by incorpo-
rating full-text analysis and illustrations into multi-
modal models (Lopez, 2009) is another avenue to im-
prove partitioning quality. Finally, the choice of data
sources, PubMed and Google Scholar, was driven by
the respective coverage of these sources in the medi-
cal and general domains. Alternative sources, such as
Web of Science or DBLP, could also have been con-
sidered.
5 CONCLUSION
We studied 21 visualizations of multivariate time se-
ries for a single individual using the PRISMA-ScR
protocol. This exploratory literature analysis reveals
that this research area has gained recent interest but
exhibits limitations in the proposed solutions. No-
tably, few approaches utilize temporal axis distortion
to allow users to examine records at the minimal gran-
ularity level. Moreover, no approach in the medical
domain visually integrates model predictions, a func-
tionality present in non-medical approaches such as
(Zhang et al., 2022) (Wu et al., 2023), which could be
valuable for proactive patient care. Finally, the num-
ber of interoperable approaches remains limited. This
study highlighted preferred functionalities for the vi-
sual representation of multivariate temporal data, in-
cluding parallel time series and hierarchical views.
REFERENCES
Aigner, W. and Miksch, S. (2006). CareVis: integrated
visualization of computerized protocols and tempo-
ral patient data. Artificial Intelligence in Medicine,
37(3):203–218.
Aigner, W., Miksch, S., Schumann, H., and Tominski, C.
(2011). Visualization of Time-Oriented Data. Human-
Computer Interaction Series. Springer, London.
Alonso, D. L., Rose, A., Plaisant, C., and Norman, K. L.
(1998). Viewing personal history records: A compar-
ison of tabular format and graphical presentation us-
ing LifeLines. Behaviour & Information Technology,
17(5):249–262.
Bade, R., Schlechtweg, S., and Miksch, S. (2004). Con-
necting time-oriented data and information to a co-
herent interactive visualization. In Proceedings of the
SIGCHI Conference on Human Factors in Computing
Systems, (CHI ’04), pages 105–112, New York, NY,
USA. Association for Computing Machinery.
Baur, D., Seiffert, F., Sedlmair, M., and Boring, S. (2010).
The streams of our lives: visualizing listening histo-
ries in context. IEEE transactions on visualization and
computer graphics, 16(6):1119–1128.
Blei, D. M., Ng, A. Y., and Jordan, M. I. (2003). La-
tent dirichlet allocation. J. Mach. Learn. Res., 3:993–
1022.
Brodbeck, D., Gasser, R., Degen, M., Reichlin, S., and
Luthiger, J. (2005). Enabling Large-Scale Telemed-
ical Disease Management through Interactive Visual-
ization.
Bui, A. A. T., Aberle, D. R., and Kangarloo, H. (2007).
TimeLine: Visualizing Integrated Patient Records.
IEEE Transactions on Information Technology in
Biomedicine, 11(4):462–473.
Combi, C., Keravnou-Papailiou, E., and Shahar, Y. (2010).
Temporal Information Systems in Medicine. Springer
US, Boston, MA.
Devlin, J., Chang, M.-W., Lee, K., and Toutanova, K.
(2019). BERT: Pre-training of deep bidirectional
transformers for language understanding. In Proceed-
ings of NAACL 2019, pages 4171–4186. Association
for Computational Linguistics.
Faiola, A. and Newlon, C. (2011). Advancing Critical Care
in the ICU: A Human-Centered Biomedical Data Vi-
sualization Systems. In Robertson, M. M., editor, Er-
gonomics and Health Aspects of Work with Comput-
ers, Lecture Notes in Computer Science, pages 119–
128, Berlin, Heidelberg. Springer.
Grootendorst, M. (2022). Bertopic: Neural topic model-
ing with a class-based tf-idf procedure. arXiv preprint
arXiv:2203.05794.
Gschwandtner, T., Aigner, W., Kaiser, K., Mik-sch, S., and
Seyfang, A. (2011). CareCruiser: Exploring and visu-
alizing plans, events, and effects interactively. In 2011
IEEE Pacific Visualization Symposium, pages 43–50.
Haddaway, N. R., Page, M. J., Pritchard, C. C., and
McGuinness, L. A. (2022). PRISMA2020: An
R package and Shiny app for producing PRISMA
2020-compliant flow diagrams, with interactivity for
Multivariate Time Series Visualization for a Single Individual: A Scoping Review Using PRISMA-ScR
981

optimised digital transparency and Open Synthesis.
Campbell Systematic Reviews, 18(2):e1230.
Hales, A. A., Cable, D., Crossley, E., Findlay, C., and
Rew, D. A. (2019). Design and implementation of
the stacked, synchronised and iconographic timeline-
structured electronic patient record in a UK NHS
Global Digital Exemplar hospital. BMJ Health &
Care Informatics, 26(1):e100025.
J
¨
ackle, D., Fischer, F., Schreck, T., and Keim, D. A. (2016).
Temporal MDS Plots for Analysis of Multivariate
Data. IEEE Transactions on Visualization and Com-
puter Graphics, 22(1):141–150.
Likert, R. (1932). A technique for the measurement of atti-
tudes. Archives of Psychology, 22 140:55–55.
Linhares, C. D. G., Lima, D. M., Ponciano, J. R., Oli-
vatto, M. M., Gutierrez, M. A., Poco, J., Traina, C.,
and Traina, A. J. M. (2023). ClinicalPath: A visu-
alization tool to improve the evaluation of electronic
health records in clinical decision-making. IEEE
Transactions on Visualization and Computer Graph-
ics, 29(10):4031–4046.
Lopez, P. (2009). Grobid: Combining automatic biblio-
graphic data recognition and term extraction for schol-
arship publications. In Research and Advanced Tech-
nology for Digital Libraries, pages 473–474. Springer
Berlin Heidelberg.
Martins, S. B., Shahar, Y., Galperin, M., Kaizer, H., Goren-
Bar, D., McNaughton, D., Basso, L. V., and Goldstein,
M. K. (2004). Evaluation of KNAVE-II: a tool for in-
telligent query and exploration of patient data. Studies
in Health Technology and Informatics, 107(Pt 1):648–
652.
Moher, D., Liberati, A., Tetzlaff, J., and Altman, D. G.
(2009). Preferred Reporting Items for Systematic Re-
views and Meta-Analyses: The PRISMA Statement.
PLoS Medicine, 6(7):e1000097.
Pieczkiewicz, D. S., Finkelstein, S. M., and Hertz, M. I.
(2007). Design and Evaluation of a Web-Based In-
teractive Visualization System for Lung Transplant
Home Monitoring Data. AMIA Annual Symposium
Proceedings, 2007:598–602.
Rind, A., Aigner, W., Miksch, S., Wiltner, S., Pohl, M.,
Turic, T., and Drexler, F. (2011). Visual exploration
of time-oriented patient data for chronic diseases: de-
sign study and evaluation. In Holzinger, A. and
Simonic, K.-M., editors, Information Quality in e-
Health, Lecture Notes in Computer Science, pages
301–320, Berlin, Heidelberg. Springer.
Rind, A., Wang, T. D., Aigner, W., Miksch, S., Wongsupha-
sawat, K., Plaisant, C., and Shneiderman, B. (2013).
Interactive Information Visualization to Explore and
Query Electronic Health Records. Foundations and
Trends® in Human–Computer Interaction, 5(3):207–
298.
Scheer, J., Volkert, A., Brich, N., Weinert, L., Santhanam,
N., Krone, M., Ganslandt, T., Boeker, M., and Nagel,
T. (2022). Visualization techniques of time-oriented
data for the comparison of single patients with mul-
tiple patients or cohorts: scoping review. Journal of
Medical Internet Research, 24(10):e38041.
Shin, M., Kim, J., Han, Y., Xie, L., Whitelaw, M., Kwon,
B. C., Ko, S., and Elmqvist, N. (2023). Roslingifier:
Semi-Automated Storytelling for Animated Scatter-
plots. IEEE Transactions on Visualization and Com-
puter Graphics, 29(6):2980–2995.
Steinhauer, N., H
¨
orbrugger, M., Braun, A. D., T
¨
uting, T.,
Oeltze-Jafra, S., and M
¨
uller, J. (2020). Comprehen-
sive Visualization of Longitudinal Patient Data for the
Dermatological Oncological Tumor Board. The Eu-
rographics Association.
Tricco, A. C., Lillie, E., Zarin, W., O’Brien, K. K.,
Colquhoun, H., Levac, D., Moher, D., Peters, M. D.,
Horsley, T., Weeks, L., Hempel, S., Akl, E. A., Chang,
C., McGowan, J., Stewart, L., Hartling, L., Aldcroft,
A., Wilson, M. G., Garritty, C., Lewin, S., Godfrey,
C. M., Macdonald, M. T., Langlois, E. V., Soares-
Weiser, K., Moriarty, J., Clifford, T., Tunc¸alp, O., and
Straus, S. E. (2018). PRISMA Extension for Scoping
Reviews (PRISMA-ScR): Checklist and Explanation.
Annals of Internal Medicine, 169(7):467–473.
Turchioe, M. R., Myers, A., Isaac, S., Baik, D., Gross-
man, L. V., Ancker, J. S., and Creber, R. M. (2019).
A systematic review of patient-facing visualizations
of personal health data. Applied Clinical Informatics,
10(4):751–770.
Wang, Q. and Laramee, R. (2022). EHR STAR: The state-
of-the-art in interactive EHR visualization. Computer
Graphics Forum, 41(1):69–105.
West, V. L., Borland, D., and Hammond, W. E. (2015). In-
novative information visualization of electronic health
record data: a systematic review. Journal of the
American Medical Informatics Association : JAMIA,
22(2):330–339.
Wu, Y., Xu, Y., Gao, S., Wang, X., Song, W., Nie, Z., Fan,
X., and Li, Q. (2023). LiveRetro: Visual Analytics for
Strategic Retrospect in Livestream E-Commerce.
Yue, X., Shu, X., Zhu, X., Du, X., Yu, Z., Papadopou-
los, D., and Liu, S. (2019). BitExTract: Interactive
Visualization for Extracting Bitcoin Exchange Intelli-
gence. IEEE Transactions on Visualization and Com-
puter Graphics, 25(1):162–171.
Zhang, C., Wang, X., Zhao, C., Ren, Y., Zhang, T., Peng,
Z., Fan, X., and Li, Q. (2022). PromotionLens: In-
specting Promotion Strategies of Online E-commerce
via Visual Analytics.
Zhang, W., Tan, S., Chen, S., Meng, L., Zhang, T., Zhu,
R., and Chen, W. (2023). Visual Reasoning for Un-
certainty in Spatio-Temporal Events of Historical Fig-
ures. IEEE Transactions on Visualization and Com-
puter Graphics, 29(6):3009–3023.
Zhao, J., Chevalier, F., Pietriga, E., and Balakrishnan, R.
(2011). Exploratory Analysis of Time-Series with
ChronoLenses. IEEE Transactions on Visualization
and Computer Graphics, 17(12):2422–2431.
IVAPP 2025 - 16th International Conference on Information Visualization Theory and Applications
982
