
A Comparative Study of CNNs and Vision-Language Models
for Chart Image Classification
Bruno C
ˆ
ome
1,2
, Maxime Devanne
1
, Jonathan Weber
1
and Germain Forestier
1
1
IRIMAS, University of Haute-Alsace, France
2
Duke, Saint-Paul, La Reunion, France
Keywords:
Chart Classification, Convolutional Neural Networks, Vision-Language Models, Data Visualization.
Abstract:
Chart image classification is a critical task in automating data extraction and interpretation from visualizations,
which are widely used in domains such as business, research, and education. In this paper, we evaluate
the performance of Convolutional Neural Networks (CNNs) and Vision-Language Models (VLMs) for this
task, given their increasing use in various image classification and comprehension tasks. We constructed
a diverse dataset of 25 chart types, each containing 1,000 images, and trained multiple CNN architectures
while also assessing the zero-shot generalization capabilities of pre-trained VLMs. Our results demonstrate
that CNNs, when trained specifically for chart classification, outperform VLMs, which nonetheless show
promising potential without the need for task-specific training. These findings underscore the importance of
CNNs in chart classification while highlighting the unexplored potential of VLMs with further fine-tuning,
making this task crucial for advancing automated data visualization analysis.
1 INTRODUCTION
To maintain their competitiveness, companies must
optimize their internal processes through automation.
Data visualization plays a central role in this trans-
formation, enabling rapid data analysis and more ef-
ficient decision-making. The adoption of effective vi-
sualization tools thus becomes essential for organiza-
tions wishing to stay at the forefront in an increasingly
demanding market.
Given the challenges and growing needs for this
type of system, advanced analysis tasks on charts have
drawn particular attention from the scientific com-
munity and the industrial sector. In this regard, nu-
merous studies have been conducted on issues related
to chart comprehension, progressively addressing in-
creasingly complex tasks.
Earlier methods to chart data extraction (Balaji
et al., 2018; Liu et al., 2019; Yan et al., 2023) adopted
modular approaches where object detection models,
such as Faster R-CNN (Ren et al., 2015) or Cascade
R-CNN (Cai and Vasconcelos, 2017), played a cen-
tral role. The applicability of the Transformer archi-
tecture in the field of image recognition (Dosovitskiy
et al., 2020; Radford et al., 2021; Liu et al., 2021), and
the emergence of Large Language Models (LLMs),
which have become essential due to their perfor-
mance across various tasks, have led to the develop-
ment of numerous LMMs (Large Multimodal Mod-
els), also known as MLLMs (Multi-modal Large Lan-
guage Models) or VLMs (Vision-Language Models).
These architectures (Liu et al., 2023b; Ye et al., 2023;
Beyer et al., 2024) typically integrate a pre-trained vi-
sual backbone to encode visual features, a pre-trained
LLM to understand user instructions and generate re-
sponses, and a vision-language cross-modal connec-
tor that aligns the outputs of the visual encoder with
the LLM input. Their ability to understand images
and follow instructions has paved the way for new ap-
proaches (Han et al., 2023; Meng et al., 2024; Xia
et al., 2024) to addressing chart comprehension chal-
lenges.
In general, chart comprehension implicitly re-
quires an initial step of identifying the type of chart in
order to proceed with more advanced specific tasks:
chart description, chart summarization, chart ques-
tion answering, etc. This identification step corre-
sponds to a classification task, and even today, CNNs
(Convolutional Neural Networks) remain among the
most effective models for image classification. Fol-
lowing the multiple successes of these architectures
(Krizhevsky et al., 2012; Simonyan and Zisserman,
2015; Szegedy et al., 2015) in various editions of the
ILSVRC (ImageNet Large Scale Visual Recognition
Challenge), some studies (Amara et al., 2017; Baji
´
c
et al., 2024) have specifically developed CNN archi-
tectures to handle the classification of chart images.
Among the methods we have just presented,
816
Côme, B., Devanne, M., Weber, J. and Forestier, G.
A Comparative Study of CNNs and Vision-Language Models for Chart Image Classification.
DOI: 10.5220/0013374500003890
In Proceedings of the 17th International Conference on Agents and Artificial Intelligence (ICAART 2025) - Volume 2, pages 816-827
ISBN: 978-989-758-737-5; ISSN: 2184-433X
Copyright © 2025 by Paper published under CC license (CC BY-NC-ND 4.0)
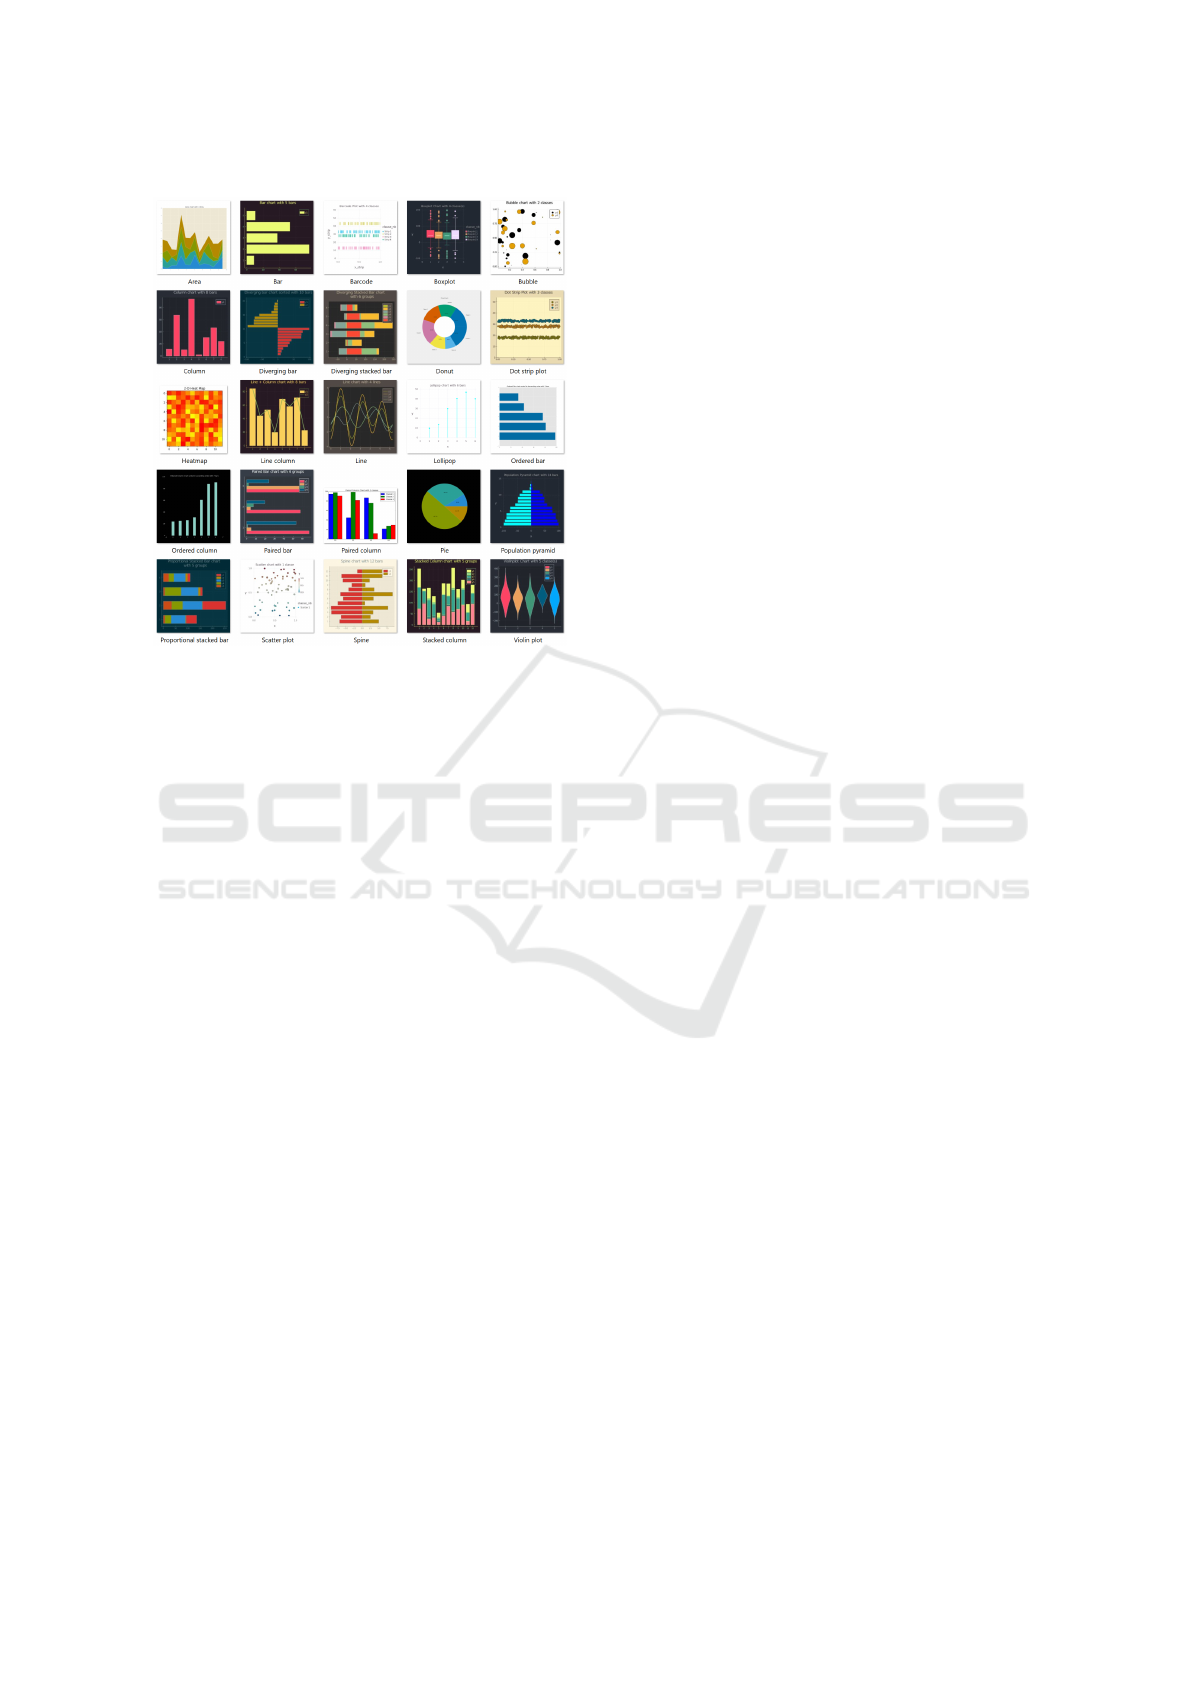
Figure 1: Representative examples from each of the 25 chart
classes in our dataset.
VLMs are probably the most powerful models due to
their ability to understand images, follow instructions,
and handle a wide variety of tasks. However, like
LLMs, they have two major drawbacks: they require
a very large amount of data for training or fine-tuning,
and their training is extremely resource-intensive. Re-
garding tasks related to chart comprehension, these
models are trained on multimodal datasets that con-
tain a limited variety of chart types. Indeed, we have
observed that the granularity of the chart classes in
these datasets does not align with that proposed by
data visualization software used in businesses. The
leading software in this field offers a wide range of
chart types, with roughly the same class granularity
(around fifty classes).
In this paper, we address the task of chart image
classification. We selected 25 chart types from popu-
lar data visualization software to define our chart im-
age classes. Our dataset consists of 25 classes, each
containing 1,000 images. Figure 1 provide one exam-
ple for each class of the dataset. We allocated 20%
of the images for the test set and used the remaining
80% for training several CNNs for this classification
task. We then evaluated the generalization capabil-
ity of multiple vision-language models (VLMs) us-
ing zero-shot prompting on the test set. These mod-
els were pre-trained on different datasets, allowing us
to compare their performance against our specifically
trained CNNs.
Our main contributions are as follows:
• We built a database of 25,000 chart images, di-
vided into 25 classes corresponding to visual-
ization types commonly used in the professional
world. This database was designed to reflect the
diversity of charts encountered in business set-
tings.
• We assess the performance of six convolutional
neural networks (CNNs) for the task of chart im-
age classification.
• We also evaluated the performance of eight Vi-
sion Language Models (VLMs), using a zero-shot
prompting approach. As such VLMs had been
trained on different datasets, this allowed us to an-
alyze their generalization capability.
2 RELATED WORK
2.1 Chart Image Classification
Chart identification, a fundamental image classifica-
tion task, has been significantly advanced by CNNs.
Following AlexNet’s (Krizhevsky et al., 2012) break-
through, various architectures emerged (Simonyan
and Zisserman, 2015; Szegedy et al., 2015; Chol-
let, 2016). In the specific context of chart clas-
sification, several approaches have been developed.
While (Amara et al., 2017) adapted LeNet (LeCun
et al., 1989) for 11 chart types, (Ara
´
ujo et al., 2020)
proposed a comprehensive approach combining clas-
sification, detection, and perspective correction for
real-world scenarios. Recent advancements include
SCNN by (Baji
´
c et al., 2024), a lightweight archi-
tecture achieving state-of-the-art results with fewer
data and computational resources, and C2F-CHART
(Shaheen et al., 2024), which introduces a progressive
training approach for Swin Transformer (Liu et al.,
2021), moving from broad to specific chart categories.
2.2 Data Extraction from Charts
Chart data extraction typically involves multiple spe-
cialized modules. Chart-Text (Balaji et al., 2018)
combines MobileNet (Howard et al., 2017) for clas-
sification, Faster R-CNN (Ren et al., 2015) for ob-
ject detection, and Tesseract OCR for text extraction,
followed by type-specific algorithms. Similarly, (Liu
et al., 2019) uses VGG16 (Simonyan and Zisserman,
2015) and Faster R-CNN, enhanced by CRNN (Shi
et al., 2015) for text recognition and Relation Net-
work (Santoro et al., 2017) for object relationships,
with an additional RNN for pie chart analysis. Char-
tOCR (Luo et al., 2021) introduces a hybrid approach
A Comparative Study of CNNs and Vision-Language Models for Chart Image Classification
817

using Hourglass Net (Newell et al., 2016) and mod-
ified CornerNet (Law and Deng, 2018) for compo-
nent detection, complemented by chart-specific rules.
CACHED (Yan et al., 2023) advances element detec-
tion by incorporating a context fusion module into
Cascade R-CNN (Cai and Vasconcelos, 2017) with
Swin Transformer (Liu et al., 2021) backbone, stan-
dardizing 18 element classes. Recent approaches like
OneChart (Chen et al., 2024) leverage VLMs, dif-
fering from models like MMC (Liu et al., 2023a),
ChartLlama (Han et al., 2023), and LLaVA which use
CLIP-ViT (Radford et al., 2021) as a visual encoder.
Based on Vary-tiny (Wei et al., 2024), OneChart trains
its visual encoder specifically for chart analysis and
introduces an auxiliary token at the beginning of the
token sequence with a dedicated auxiliary decoder to
enhance numerical interpretation, while also estab-
lishing the ChartY benchmark.
2.3 General Purpose Vision-Language
Model
At a high level, VLMs commonly incorporate a pre-
trained visual backbone, a pre-trained LLM, and
a vision-language cross-modal connector. Pioneer-
ing visual instruction tuning, LLaVA (Liu et al.,
2023c) has evolved through several iterations (Liu
et al., 2023b; Liu et al., 2024), progressively im-
proving its architecture from a simple CLIP-ViT-L-
224px (Radford et al., 2021) with a trainable pro-
jection matrix connected to Vicuna (Chiang et al.,
2023), to more sophisticated versions supporting vari-
ous LLMs like Mistral (Jiang et al., 2023). New train-
ing paradigms emerged with models like mPLUG-
Owl (Ye et al., 2023), which introduced a modular-
ized approach combining LLaMA-7B (Touvron et al.,
2023a), CLIP-ViT-L, and a visual abstractor module
synthesizing visual information into learnable tokens.
Its two-step method first trains visual modules with
frozen LLM to learn visual knowledge, then jointly
fine-tunes a LoRA module on LLM and the abstrac-
tor while freezing the vision model. Additionally,
they introduced a new benchmark called OwlEval.
SPHINX (Lin et al., 2023) combines multiple vision
encoders, two linear projection layers, and LLaMA-2
(Touvron et al., 2023b) as backbone LLM, uniquely
unfreezing the LLM during pre-training with weight
mixing for different domain knowledge combination.
This is followed by a tuning tasks mixing strategy for
instruction learning, differing from most VLMs that
only train intermediate projection layers for vision-
language alignment. Recent developments include
PaLI-3 (Chen et al., 2023b), which achieves effi-
ciency through optimized pre-training with SigLIP
(Zhai et al., 2023), matching the performance of the
larger PaLI-X (Chen et al., 2023a), and PaLIGemma
(Beyer et al., 2024), which combines SigLIP with the
Gemma LLM (Mesnard et al., 2024) to match larger
models’ performance with fewer parameters.
2.4 Chart-Specific Vision-Language
Model
Vision-Language Models (VLMs) specialized in chart
understanding follow the general VLM structure
while incorporating specific components for bet-
ter task handling. For instance, ChartVLM (Xia
et al., 2024) adds an instruction adapter and a ba-
sic decoder to support both elementary perception
and complex tasks. The development of these spe-
cialized VLMs has been driven by various datasets
and benchmarks designed for chart-specific tasks.
ChartReader (Cheng et al., 2023) pioneered chart-to-
X tasks (text/table/QA) using datasets like Chart-to-
Text (Obeid and Hoque, 2020), ExcelChart400K (Luo
et al., 2021), FigureQA (Kahou et al., 2017), DVQA
(Kafle et al., 2018), PlotQA (Methani et al., 2019),
and ChartQA (Masry et al., 2022). Several mod-
els emerged with their respective datasets: UniChart
(Masry et al., 2023) introduced a multi-task corpus,
while MMCA (Liu et al., 2023a) leveraged GPT-4 to
create MMC-Instruction and the manually annotated
MMC-Benchmark covering nine tasks. ChartLlama
(Han et al., 2023) was trained on GPT-4-generated
data specialized for chart understanding and gen-
eration. ChartReformer (Yan et al., 2024) intro-
duced chart editing capabilities with a taxonomy for
four editing types, while ChartAssistant (Meng et al.,
2024) developed ChartSFT, a large-scale instruction-
tuning benchmark incorporating nine chart types.
ChartVLM (Xia et al., 2024) proposed ChartX cover-
ing 22 subjects and 18 chart types across seven tasks,
and was trained on several datasets including Sim-
Chart9K (Xia et al., 2023). Recent advances include
ChartInstruct (Masry et al., 2024a), which enhanced
visual encoding using UniChart’s pre-trained encoder
and was trained on 191K instructions generated by
GPT-3.5, GPT-4, and Gemini. The model was eval-
uated on multiple benchmarks including OpenCQA
(Kantharaj et al., 2022) and ChartFC (Akhtar et al.,
2023). TinyChart with its ChartQA-PoT dataset
(Zhang et al., 2024) focused on improved numer-
ical reasoning, while ChartGemma (Masry et al.,
2024b) utilized Gemini Flash 1.5 (Anil et al., 2023)
for instruction generation. EvoChart (Huang et al.,
2024) introduced a multi-step approach that combines
dataset creation with model self-learning, along with
the EvoChart-QA benchmark based on diverse real-
ICAART 2025 - 17th International Conference on Agents and Artificial Intelligence
818

world charts. ChartMoE (Xu et al., 2024) proposed an
architecture replacing the linear projection layer with
three expert connectors (two-layer MLPs), each inde-
pendently trained on specific alignment tasks (chart-
table/JSON/code) using a dataset of 900K quadru-
plets.
3 PROPOSED METHODOLOGY
3.1 Image Dataset for Chart Classes
There are various ways to represent data, and most
data visualization software tends to group chart types
based on different use cases and data relationships.
This categorization helps users select the most appro-
priate chart. We observed that leading software offers
a similar set of chart classes with fine granularity. In
this work, we aligned our approach to the same level
of granularity.
For our experiments, we constructed a dataset of
25 chart classes, representing approximately half of
the chart types provided by major data visualization
platforms. Each class contains 1,000 images. To en-
sure a representative and diverse set of charts in terms
of visual appearance, we followed a three-step pro-
cess: (1) we scraped images from Google Images, (2)
we manually filtered the collected images, and (3) we
automatically generated additional chart images using
scripts written in Python and Julia. This multi-step
process was necessary, as web scraping alone did not
provide the 1,000 images required for each class.
3.1.1 Web Scraping and Image Sorting
After scraping, we manually filtered the collected
images to remove misclassified, irrelevant, or low-
quality images, ensuring the dataset accurately rep-
resented the intended chart classes. To complete the
dataset, we developed scripts to automatically gener-
ate additional chart images.
3.1.2 Automated Generation of Chart Images
The goal at this stage was to complete the dataset
by generating 1,000 images per chart category. To
achieve this, we developed scripts using three graph-
ics libraries in Julia (Plots, Vegalite, and Gadfly) and
one in Python (Matplotlib). We leveraged the fea-
tures of these libraries to automatically and randomly
generate visually diverse chart images. For example,
in the ’line chart’ category, we varied graphical pa-
rameters such as line style, color palette, and graph-
ical themes. Additionally, the number of curves and
points on the x-axis were randomly selected. To fur-
ther diversify the curve shapes, the y-values were gen-
erated using a variety of predefined functions, which
were triggered randomly. These functions included
random values, polynomials of random degrees, prob-
ability distributions, random signal generation (linear
combinations of sine and cosine, linear chirps), and
other standard functions.
Table 1 shows, for each chart class, the number
of images obtained through web scraping and gen-
erated using Matplotlib, Plots, Vegalite, and Gadfly.
Each class contains 1,000 images in total. The table
also indicates with a zero (0) the chart classes that
could not be generated using Plots, Vegalite, or Gad-
fly. The number of images generated by each library
was determined based on the variety of visual options
they offered. More images were generated with the li-
braries that allowed for greater visual diversity in the
charts.
3.2 Deep Learning Models for Chart
Classification
3.2.1 Convolutional Neural Networks
In this study, we train and evaluate six prominent
CNN architectures that have demonstrated significant
success in various image classification tasks. AlexNet
(Krizhevsky et al., 2012), the pioneering deep CNN
architecture, consists of five convolutional layers fol-
lowed by three fully connected layers, establishing
fundamental principles for modern deep learning.
VGG16 (Simonyan and Zisserman, 2015) features a
deeper architecture with 16 layers using small 3×3
convolution filters throughout the network, emphasiz-
ing the benefits of network depth with uniform struc-
ture. Inception-v3 (Szegedy et al., 2015) employs
parallel convolution paths of varying scales within its
Inception modules, enabling multi-scale feature pro-
cessing through its unique module design. Inception-
ResNet-v2 (Szegedy et al., 2016) combines the In-
ception modules with residual connections, enhanc-
ing gradient flow and feature extraction capabilities
through this hybrid architecture. Xception (Chollet,
2016) leverages depthwise separable convolutions to
efficiently process cross-channel and spatial correla-
tions, representing an extreme version of the Incep-
tion hypothesis. EfficientNetB4 (Tan and Le, 2019),
a scaled version of the EfficientNet architecture opti-
mized through neural architecture search, offers state-
of-the-art performance with fewer parameters through
balanced scaling of network depth, width, and res-
olution. This diverse selection of architectures pro-
vides a broad and representative comparison of differ-
A Comparative Study of CNNs and Vision-Language Models for Chart Image Classification
819
Table 1: Overview of the chart image dataset composition.
Class Web scraping Matplotlib Plots Vegalite Gadfly Total
area chart 445 225 225 105 0 1000
bar chart 31 280 280 129 280 1000
barcode plot 57 220 303 200 220 1000
boxplot 253 247 200 100 200 1000
bubble chart 206 220 220 154 200 1000
column chart 282 210 210 98 200 1000
diverging bar chart 27 250 333 140 250 1000
diverging stacked bar chart 95 280 360 265 0 1000
donut chart 102 698 0 200 0 1000
dot strip plot 92 250 250 158 250 1000
heatmap 140 300 360 200 0 1000
line chart 290 200 200 110 200 1000
line column chart 45 250 355 100 250 1000
lollipop chart 152 300 300 0 248 1000
ordered bar chart 57 250 300 143 250 1000
ordered column chart 61 250 300 139 250 1000
paired bar chart 57 264 264 151 264 1000
paired column chart 173 200 277 150 200 1000
pie chart 477 200 223 100 0 1000
population pyramid 209 250 250 191 100 1000
proportional stacked bar chart 86 240 334 100 240 1000
scatter plot 280 200 200 160 160 1000
spine chart 11 280 340 100 269 1000
stacked column chart 275 180 265 100 180 1000
violin plot 181 273 273 0 273 1000
ent CNN architectural innovations’ performances for
the chart image classification task, ranging from basic
architectures (AlexNet) to highly optimized models
(EfficientNet).
3.2.2 Vision-Language Models
For vision-language modeling, we evaluate both gen-
eralist and chart-specific architectures, aiming to
assess VLMs’ generalization capabilities on chart
classification using models pre-trained on different
datasets than those used for our CNNs. We ex-
periment with several versions of LLaVA, a pioneer
in visual instruction tuning: LLaVA-1.5 (Liu et al.,
2023b) (7B and 13B versions), which enhances visual
analysis by adopting CLIP-ViT-L-336px and an MLP
connector, and LLaVA-1.6 (Liu et al., 2024) vari-
ants (based on Mistral-7B, Vicuna-7B, and Vicuna-
13B), which improve visual detail capture through
quadrupled resolution and expanded instruction data.
We also evaluate PaLI-GEMMA-3B-ft-VQAv2-448
(Beyer et al., 2024), which combines a ViT image
encoder with a 2B Gemma (Mesnard et al., 2024)
LLM fine-tuned on VQAv2. For chart-specific mod-
els, we assess ChartLLaMA-13B (Han et al., 2023),
which builds upon LLaVA-1.5’s architecture by re-
placing its single linear projection layer with a two-
layer MLP and is specifically trained for chart un-
derstanding, and TinyChart-3B-768 (Zhang et al.,
2024), a lightweight approach optimized for chart
analysis with a specialized 768×768 resolution and
enhanced attention mechanisms for processing struc-
tured visual information.
3.3 CNNs Training
Our dataset was split into training (80%) and test
(20%) sets. From the training set, we further re-
served 20% for validation, resulting in 16,000 images
for training (640 per class) and 4,000 images for val-
idation (160 per class). We experimented with six
well-known CNNs: AlexNet, VGG16, InceptionV3,
InceptionResNetV2, Xception and EfficientNetB4.
Two training approaches were experimented with:
full network training and fine-tuning. For both meth-
ods, we resized the input images to the appropriate
format for each CNN.
3.3.1 Full Training Strategy
We adopted a full network training approach with 100
epochs using mini-batches of 64 images. The op-
timization was performed using Stochastic Gradient
Descent (SGD) with a learning rate of 0.01, momen-
tum of 0.9, and weight decay of 10
−6
. The train-
ing duration varied significantly across models, with
AlexNet being the fastest to train (5.57 minutes) and
EfficientNetB4 requiring the most time (115.30 min-
utes), as detailed in Table 2.
ICAART 2025 - 17th International Conference on Agents and Artificial Intelligence
820

Table 2: CNNs training time (in minutes).
Model Runtime (minutes)
AlexNet 5.57
VGG16 42.30
InceptionV3 42.27
InceptionResNetV2 93.17
Xception 69.97
EfficientNetB4 115.30
3.3.2 Fine-Tuning Strategy
We explored a transfer learning approach using Im-
ageNet pre-trained weights. The fine-tuning process
consisted of two phases. First, we froze all layers of
the network to preserve their information and added
three trainable layers: an average pooling layer, a
fully connected layer, and a softmax layer for chart
class prediction. These new layers were trained for 40
epochs with a mini-batch size of 64, using early stop-
ping to prevent overfitting (monitoring validation loss
with a patience of 10). For the second phase, we un-
froze the pre-trained model layers and trained the en-
tire network for 100 epochs with a mini-batch size of
64 and a reduced learning rate of 10
−5
. Both phases
used SGD optimization with a momentum of 0.9 and
weight decay of 10
−6
. However, this approach did not
yield significant improvements over full training, and
in some cases even led to performance degradation.
Consequently, we selected the fully trained models
for our final evaluation.
3.4 Evaluation
We evaluated both our trained CNNs and eight pre-
trained Vision-Language Models (VLMs) on our test
set, including six generalist VLMs and two chart-
specific VLMs. Vision-Language Models take as in-
put text in the form of a prompt as well as an im-
age. (Brown et al., 2020) and (Radford et al., 2021)
highlight that zero-shot evaluation is particularly ef-
fective for assessing the generalization capabilities of
language models and vision-language models. As
demonstrated in (Brown et al., 2020), this evaluation
approach provides a direct measure of a model’s abil-
ity to generalize to new tasks without any adjustment
or task-specific examples, testing its capacity to un-
derstand and perform tasks based solely on instruc-
tions. This observation is further supported by (Rad-
ford et al., 2021), where the authors show that zero-
shot evaluation effectively assesses a model’s abil-
ity to transfer learned knowledge to unfamiliar tasks.
Based on these findings, we adopted a zero-shot eval-
uation approach and explored several prompt formu-
lations to instruct the VLMs in performing chart im-
age classification.
First, the prompts must be constructed in
the appropriate format for the model. For ex-
ample, for the llava-v1.6-mistral-7b model,
the prompt must be formatted as follows:
"[INST] <image>\n instruction [/INST]".
For all the VLMs, we tested prompts formulated in
different ways. The most basic form simply asks
the model what type of chart it is, without providing
any additional information about the chart classes:
”What is the chart type? Answer by just giving the
chart type.”. For the second type of prompt, we ask
the model to classify the chart image into one of the
categories provided in the prompt: ”What is the chart
type among the types in the list below: [area, ...,
violin plot]? Answer by giving just the best chart type
in the previous list.”. The third form of the prompt
involves asking the model to analyze the chart first,
and then classify it into one of the categories in the
provided list: ”After analyzing the chart, classify it
correctly into one of the following chart types: area,
..., violin plot. After that, give me just the correct
chart type.”. Finally, we tested a fourth and final
prompt, in which we provide a short description of
each chart class and ask the model to take on the
role of an expert data visualization assistant. This
last prompt did not yield satisfactory results with
any of the models. Each of these prompt approaches
underwent some variations depending on the model
to improve its performance.
Through our experiments, we found that even
when using the second type of prompt, where we ask
the model to classify the chart image into one of the
categories provided in the list, the models’ predic-
tions sometimes do not fit into any of our 25 chart
classes. To classify these predictions that fall outside
our classes, we created a 26th class called ”other”.
We also noticed that sometimes the VLMs are able to
correctly recognize the type of chart, but their predic-
tions do not match to any of our classes. For exam-
ple, a VLM might predict ”horizontal bar” whereas
our corresponding class is ”bar”. To address these bi-
ases, we perform several correction treatments on the
VLMs predictions before evaluating their final perfor-
mance.
3.4.1 Evaluation Metrics
To evaluate the performance of models on the task
of chart image classification, we use several com-
plementary metrics: precision, accuracy, recall, F1-
score, and confusion matrix. Precision measures the
reliability of the model’s positive predictions, indicat-
ing its ability to avoid false positives. Accuracy pro-
A Comparative Study of CNNs and Vision-Language Models for Chart Image Classification
821

vides an overall view of performance by representing
the total proportion of correct predictions. Recall as-
sesses the model’s ability to correctly identify all pos-
itive examples of a given class, which is crucial when
exhaustive detection is necessary. The F1-score, the
harmonic mean of precision and recall, offers a bal-
ance between these two metrics, particularly useful
for a synthetic evaluation. Finally, the confusion ma-
trix provides a detailed visualization of the model’s
performance, allowing for the identification of spe-
cific confusions between different types of charts and
the detection of potential biases.
3.5 Implementation Details
All experiments were conducted on an Azure
NC24ads A100 v4 instance equipped with a 24-
core CPU, 220 GB of RAM, and an NVIDIA
A100 graphics card (80 GB memory). Our code
and dataset are available at https://github.com/MSD-
IRIMAS/CNNvsVLMforChartImageClassification.git.
3.5.1 CNN Implementation
For CNN training and evaluation, we used the Keras
library with TensorFlow backend. Image preprocess-
ing involved resizing to model-specific input dimen-
sions and applying the Keras preprocess_input
method. We used categorical cross-entropy as the loss
function and categorical accuracy as the metric. The
best model was saved during training using the Keras
ModelCheckpoint callback method.
Fine-tuning Implementation. The fine-tuning ar-
chitecture included additional layers (average pool-
ing, fully connected, and softmax) on top of the frozen
pre-trained network. We implemented early stopping
by monitoring the validation loss with the monitor
parameter set to val_loss, the mode parameter set to
min, and a patience parameter of 10. The optimiza-
tion was configured using SGD with the previously
mentioned learning rates and momentum parameters.
The loss function and metric remained the same as
those used for training CNNs from scratch: categori-
cal cross-entropy and categorical accuracy.
3.5.2 VLM Implementation
For VLM evaluation, we used the PyTorch library.
To ensure reproducibility of our experimental re-
sults, we set the temperature parameter to 0.2 in
the model.generate method. This low temperature
value minimizes variability in the VLMs predictions
and tends to produce more consistent and predictable
outputs.
4 EXPERIMENTAL RESULTS
This section presents the results of the comparative
evaluation between six CNNs and eight VLMs on the
task of classifying chart images. The CNNs were di-
rectly trained on our training set, while the VLMs
were evaluated in a zero-shot manner, without any
prior training on our data. The models are assessed on
our test set consisting of 200 images per chart class,
totaling 5,000 images, and their performance is mea-
sured using four main metrics (accuracy, precision,
recall, and F1-score) and confusion matrix.
In Table 3, the ”Prompt type” column indicates
the form of the prompt used for evaluating the VLM.
For each model, only the results obtained with the
prompt that yielded the best performance are pre-
sented. Table 3 highlights the significantly superior
performance of the trained CNNs compared to the
VLMs. For example, Xception achieves an accuracy
of 0.9682 and a F1-score of 0.9682, underscoring the
model’s ability to capture the characteristics of the
charts well. The performance of other CNNs, such as
InceptionResNetV2 and InceptionV3, follows this
trend with very high scores. Even the older archi-
tecture AlexNet, achieves a respectable accuracy of
0.7928, confirming the effectiveness of these models
in the task of classifying chart images. On the other
hand, the VLMs tested in zero-shot show lower per-
formance. The llava-v1.6-vicuna-13b model evalu-
ated with the third type of prompt achieves an accu-
racy of 0.6530 and a F1-score of 0.6680. This model
exhibits a good precision (0.8479) but a lower recall
(0.6530), which reveals its difficulty in recognizing
certain classes. Overall, the other generalist models
follow this trend with low to moderate performance.
Finally, despite their specialization in chart under-
standing, ChartLlama-13b and TinyChart-3B-768
fail to compete with the trained CNNs.
The confusion matrix shown in Figure 2 confirms
the excellent performance of the Xception model,
with the majority of correct predictions concentrated
along the diagonal. Some minor confusions remain
between visually similar classes, particularly between
”area” and ”line”, as well as between ”scatter” and
”bubble”, illustrating the model’s difficulty in dis-
tinguishing certain closely related structures. How-
ever, for the majority of classes, such as ”diverging
bar”, ”donut” and ”barcode” the errors are minimal,
demonstrating the model’s ability to effectively cap-
ture the specific visual characteristics of these charts.
These results confirm the suitability of CNNs like
Xception for the classification of chart images.
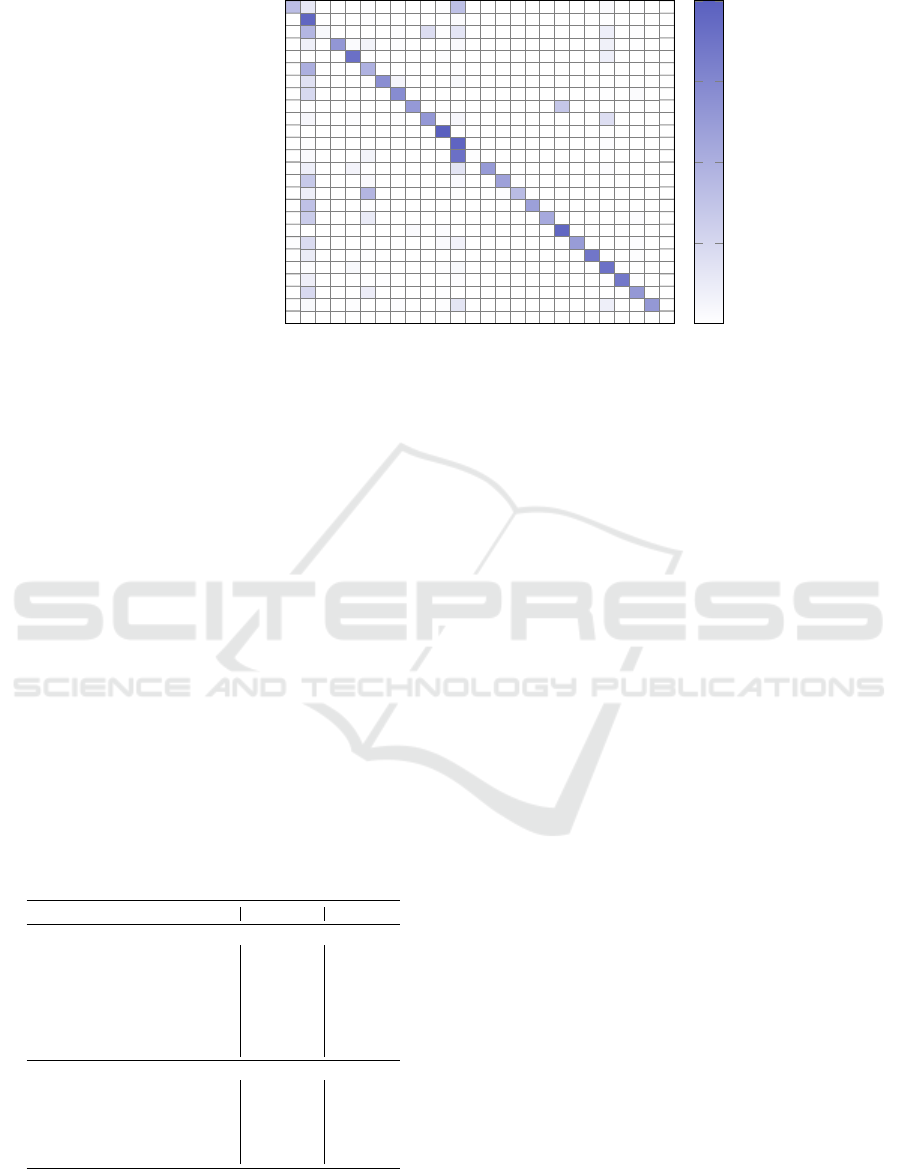
In contrast, the confusion matrix of the llava-v1.6-
vicuna-13b model, shown in Figure 3, highlights sig-
ICAART 2025 - 17th International Conference on Agents and Artificial Intelligence
822
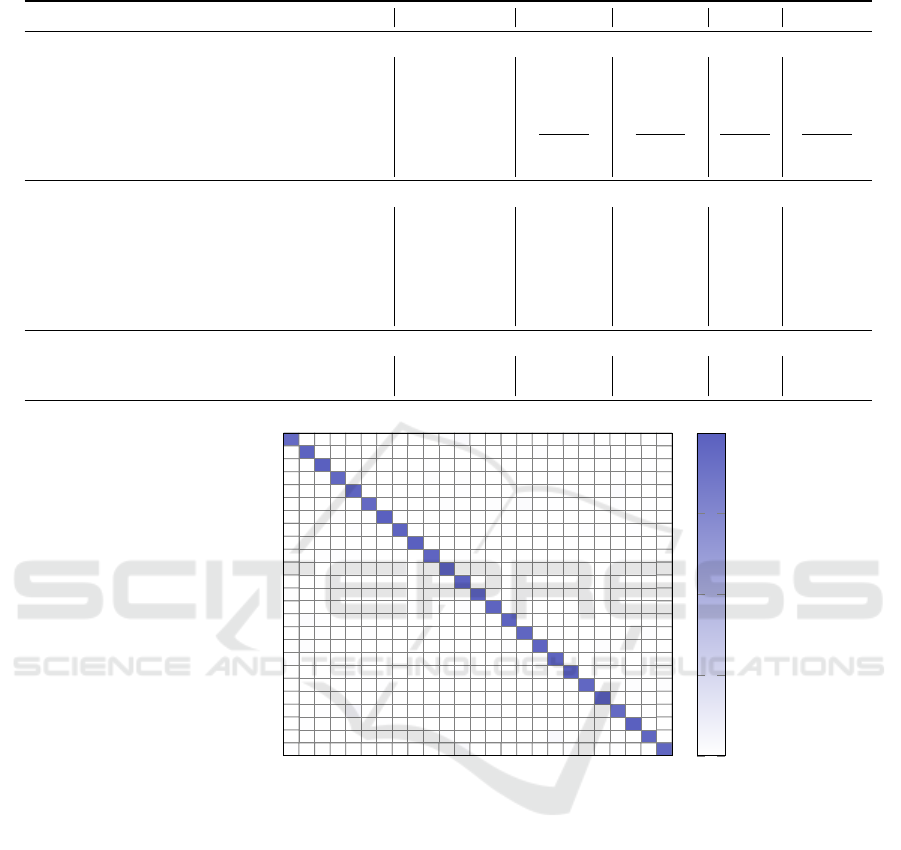
Table 3: Comparison of models on performance metrics. Best value in each column is in bold, second best is underlined.
Model Prompt type Accuracy Precision Recall F1-score
Convolutional Neural Networks
AlexNet (Krizhevsky et al., 2012) - 0.7928 0.80 0.7928 0.7922
VGG16 (Simonyan and Zisserman, 2015) - 0.9128 0.9145 0.9128 0.9129
InceptionV3 (Szegedy et al., 2015) - 0.9472 0.9478 0.9472 0.9473
InceptionResNetV2 (Szegedy et al., 2016) - 0.9590 0.9594 0.9590 0.9590
Xception (Chollet, 2016) - 0.9682 0.9686 0.9682 0.9682
EfficientNetB4 (Tan and Le, 2019) - 0.9390 0.940 0.9390 0.9391
Generalist Vision-Language Models
llava-v1.5-7b (Liu et al., 2023b) Third 0.6226 0.7672 0.5987 0.6288
llava-v1.5-13b (Liu et al., 2023b) Third 0.6394 0.7830 0.6148 0.6364
llava-v1.6-mistral-7b (Liu et al., 2024) Third 0.5794 0.8395 0.5794 0.5962
llava-v1.6-vicuna-7b (Liu et al., 2024) Third 0.6436 0.8272 0.6188 0.6645
llava-v1.6-vicuna-13b (Liu et al., 2024) Third 0.6530 0.8479 0.6530 0.6680
paligemma-3b-ft-vqav2-448 (Beyer et al., 2024) Second 0.5050 0.5643 0.4856 0.4783
Chart-specific Vision-Language Models
ChartLlama-13b (Han et al., 2023) Third 0.4572 0.5328 0.4396 0.4067
TinyChart-3B-768 (Zhang et al., 2024) First 0.4002 0.6847 0.3848 0.3642
area
bar
barcode
boxplot
bubble
column
diverging bar
diverging stacked bar
donut
dot strip plot
heatmap
line
line column
lollipop
ordered bar
ordered column
paired bar
paired column
pie
population pyramid
proportional stacked bar
scatter
spine
stacked column
violin plot
area
bar
barcode
boxplot
bubble
column
diverging bar
diverging stacked bar
donut
dot strip plot
heatmap
line
line column
lollipop
ordered bar
ordered column
paired bar
paired column
pie
population pyramid
proportional stacked bar
scatter
spine
stacked column
violin plot
187 0 0 0 0 0 0 0 0 0 1 6 0 0 0 0 0 1 2 2 0 0 0 0 1
0 195 0 0 0 0 0 0 0 0 0 0 0 0 2 0 2 0 0 0 1 0 0 0 0
0 0 198 0 0 0 0 0 0 1 0 0 0 0 0 0 0 0 0 0 0 0 0 1 0
0 0 1 189 0 0 0 0 0 2 0 3 0 0 0 0 0 1 0 0 0 1 1 2 0
0 0 0 0 194 0 0 0 0 0 0 1 0 0 0 0 0 0 1 0 0 4 0 0 0
0 0 0 0 0 187 0 0 0 0 2 0 0 2 0 5 0 1 1 0 0 1 0 1 0
0 0 0 1 0 0 199 0 0 0 0 0 0 0 0 0 0 0 0 0 0 0 0 0 0
0 0 0 0 1 0 0 194 0 0 0 0 0 0 1 0 0 0 0 1 2 0 1 0 0
0 0 0 0 0 0 0 0 199 0 0 0 0 0 0 0 0 0 1 0 0 0 0 0 0
0 0 1 3 1 0 0 0 0 193 0 1 0 0 0 0 0 0 0 0 0 1 0 0 0
0 0 0 0 0 0 0 1 0 0 196 0 0 0 0 0 0 0 0 0 1 1 0 1 0
0 0 0 1 0 0 0 0 0 0 0 197 0 0 0 0 0 0 0 0 0 2 0 0 0
2 0 0 0 0 1 0 0 0 0 0 0 195 0 0 1 0 0 0 1 0 0 0 0 0
0 0 0 0 0 0 0 0 1 1 0 2 0 194 0 0 0 0 0 1 0 1 0 0 0
0 4 1 0 0 0 0 0 0 0 0 0 0 0 195 0 0 0 0 0 0 0 0 0 0
0 0 1 0 0 3 0 0 0 0 0 0 0 1 0 191 0 1 0 0 0 0 0 3 0
0 3 0 0 0 0 0 0 0 0 0 0 0 0 2 0 193 0 0 0 2 0 0 0 0
1 0 0 0 0 3 0 0 0 0 0 0 0 0 0 1 0 194 0 0 0 0 0 1 0
0 0 0 0 1 0 0 0 0 0 0 2 0 0 0 0 0 0 197 0 0 0 0 0 0
0 0 0 0 0 1 1 0 0 0 1 0 0 0 0 0 0 0 1 190 0 1 3 0 2
0 0 0 0 0 0 0 0 0 0 1 0 0 0 0 0 1 0 0 0 198 0 0 0 0
0 0 1 0 10 0 0 0 0 1 0 0 0 2 0 0 0 0 0 0 0 186 0 0 0
0 1 0 0 0 0 1 0 0 0 0 0 0 0 0 0 0 0 0 0 0 0 198 0 0
0 0 0 0 0 0 0 0 0 0 1 0 0 0 0 0 0 7 0 0 0 1 0 191 0
1 0 0 0 0 0 0 0 0 0 0 6 0 0 0 0 0 0 1 0 0 1 0 0 191
Predicted classes
True classes
0
50
100
150
200
Figure 2: Xception confusion matrix.
nificantly lower performance than Xception. In par-
ticular, we can observe notable confusions between
several visually similar chart classes, such as ”col-
umn” and ”bar”, or ”barcode” and ”bar”. Errors fre-
quently occur for charts featuring bars or columns.
The model also often confused (79 times) ”area
charts” with ”line charts”, and it confused ”donuts”
with ”pie charts” 71 times. However, it is worth not-
ing that the VLM adhered to the list of classes we pro-
vided, as no chart were classified into the 26th class
named ”other”. Despite this, some distinctive classes,
such as ”heatmap” and ”pie”, are well classified, in-
dicating that the model is able to effectively capture
certain chart features, but struggles to generalize well
on specific classes that resemble bars or columns.
5 RESEARCH PERSPECTIVES
Our investigation into chart understanding methods
has revealed two significant limitations in existing
datasets (Table 4). First, these corpora feature a lim-
A Comparative Study of CNNs and Vision-Language Models for Chart Image Classification
823
area
bar
barcode
boxplot
bubble
column
diverging bar
diverging stacked bar
donut
dot strip plot
heatmap
line
line column
lollipop
ordered bar
ordered column
paired bar
paired column
pie
population pyramid
proportional stacked bar
scatter
spine
stacked column
violin plot
other
area
bar
barcode
boxplot
bubble
column
diverging bar
diverging stacked bar
donut
dot strip plot
heatmap
line
line column
lollipop
ordered bar
ordered column
paired bar
paired column
pie
population pyramid
proportional stacked bar
scatter
spine
stacked column
violin plot
other
82 28 0 0 0 1 0 0 0 0 3 79 0 0 0 0 0 0 0 0 0 6 0 1 0 0
0 191 0 0 0 3 0 0 0 0 0 5 0 0 0 0 0 0 0 0 0 1 0 0 0 0
0 91 8 0 0 0 0 2 0 42 3 32 0 0 0 0 0 0 0 0 0 20 0 2 0 0
0 19 0 131 6 14 0 3 0 1 0 7 0 0 0 0 0 0 0 0 0 18 0 1 0 0
0 0 0 0 178 0 0 0 0 0 2 0 0 0 0 0 0 0 0 0 0 20 0 0 0 0
0 100 0 0 0 97 0 0 0 0 0 3 0 0 0 0 0 0 0 0 0 0 0 0 0 0
0 37 0 0 0 2 14112 0 0 0 8 0 0 0 0 0 0 0 0 0 0 0 0 0 0
0 48 0 0 0 1 0 144 0 0 0 0 0 0 0 0 0 0 0 0 1 1 0 5 0 0
0 1 0 0 0 0 0 0 127 0 1 0 0 0 0 0 0 0 71 0 0 0 0 0 0 0
0 11 0 0 2 0 0 2 0 130 3 11 0 0 0 0 0 0 0 0 0 41 0 0 0 0
0 0 0 0 0 0 0 0 0 0 199 0 0 0 0 0 0 0 0 0 0 1 0 0 0 0
0 3 0 0 0 0 0 0 0 0 0 193 0 0 0 0 0 0 0 0 0 4 0 0 0 0
0 6 0 0 0 14 0 0 0 0 0 178 2 0 0 0 0 0 0 0 0 0 0 0 0 0
0 20 0 0 15 1 0 0 0 0 0 34 0 126 0 0 0 0 0 0 0 4 0 0 0 0
0 68 0 0 0 7 0 0 0 0 0 7 0 0 117 1 0 0 0 0 0 0 0 0 0 0
0 20 0 0 0 92 0 0 0 0 0 2 0 0 2 84 0 0 0 0 0 0 0 0 0 0
0 77 0 0 0 3 0 0 0 0 0 0 0 0 0 0 119 1 0 0 0 0 0 0 0 0
0 64 0 0 0 25 0 0 0 0 0 0 0 0 0 0 0 107 0 0 0 0 0 4 0 0
0 0 0 0 0 0 0 0 6 0 4 0 0 0 0 0 0 0 190 0 0 0 0 0 0 0
2 45 0 0 0 1 0 1 0 0 6 16 0 0 0 0 0 0 1 124 0 0 0 4 0 0
0 24 0 0 0 2 0 0 0 0 0 0 0 0 0 0 0 0 0 0 171 0 0 3 0 0
0 4 0 0 8 0 0 0 0 0 3 8 0 0 0 0 0 0 0 0 0 177 0 0 0 0
0 21 0 0 0 3 1 0 0 0 0 4 0 0 0 0 0 0 0 0 0 1 169 1 0 0
0 47 0 0 0 22 0 0 0 0 1 0 0 0 0 0 0 0 0 0 1 0 0 129 0 0
0 8 0 0 3 0 0 4 0 0 3 33 0 0 0 0 0 0 0 0 0 20 0 0 129 0
0 0 0 0 0 0 0 0 0 0 0 0 0 0 0 0 0 0 0 0 0 0 0 0 0 0
Predicted classes
True classes
0
50
100
150
200
Figure 3: llava-v1.6-vicuna-13b confusion matrix.
ited number of chart classes, with even recent datasets
like ChartX covering only 18 types of charts. Sec-
ond, the granularity of chart classes in these datasets
is often mismatched with the taxonomies used in pro-
fessional data visualization software such as Tableau,
Power BI, or Qlik, which support approximately 50
different chart types. This methodological fragmen-
tation creates a gap between academic research ap-
proaches and business needs. Developing a new
dataset that aligns with the standards of data visu-
alization software would therefore be beneficial, of-
fering researchers and practitioners a common foun-
dation to improve the automatic recognition and un-
derstanding of charts. Beyond dataset creation, the
Table 4: Chart-related benchmarks.
Datasets Chart Type Task Type
Single-task Evaluation
FigureQA (Kahou et al., 2017) 5 1
DVQA (Kafle et al., 2018) 1 1
PlotQA (Methani et al., 2019) 3 1
Chart-to-Text (Obeid and Hoque, 2020) 6 1
ChartQA (Masry et al., 2022) 3 1
OpenCQA (Kantharaj et al., 2022) 5 1
ChartReformer (Yan et al., 2024) 3 1
EvoChart-QA (Huang et al., 2024) 4 1
Multi-task Evaluation
UniChart (Masry et al., 2023) 3 5
ChartLlama (Han et al., 2023) 10 7
MMC (Liu et al., 2023a) 6 9
ChartSFT (Meng et al., 2024) 9 5
ChartX (Xia et al., 2024) 18 7
ChartInstruct (Masry et al., 2024a) 10 +4
high number of chart classes in professional visu-
alization software also raises challenges for model
development. While recent work has shown that
Larger Language Models and Vision-Language Mod-
els can achieve performance comparable to fine-tuned
models using few-shot or multi-turn prompting ap-
proaches, these methods have limitations for image
classification tasks with numerous classes. Indeed,
when the number of classes is high, providing rep-
resentative examples for each class in the token se-
quence can exceed the context length limits of these
models. Although this could be addressed by im-
plementing a hierarchical classification strategy, first
grouping charts into broader categories before fine-
grained classification, such an approach would add
complexity and processing time unsuitable for real-
time applications. Therefore, fine-tuning a Vision-
Language Model on the future comprehensive dataset
appears as a more practical solution for achieving ac-
curate classification across the wide range of chart
types found in professional visualization software.
6 CONCLUSION
In this paper, we presented a comprehensive evalua-
tion of CNNs and Vision-Language Models (VLMs)
for chart image classification using a dataset of 25
chart types. Our results demonstrate that CNNs,
specifically trained for the task, outperform VLMs in
this domain. However, VLMs show promising gen-
eralization capabilities when applied in a zero-shot
setting. These findings underscore the importance of
ICAART 2025 - 17th International Conference on Agents and Artificial Intelligence
824

task-specific training for CNNs, while also highlight-
ing the potential of VLMs in handling diverse and un-
seen chart types.
Our future work will focus on developing a more
comprehensive dataset that better aligns with profes-
sional data visualization software standards, which
typically support around 50 different chart types.
While VLMs demonstrate promising zero-shot capa-
bilities, their context length limitations when deal-
ing with numerous chart classes make fine-tuning a
more practical approach for real-world applications.
Therefore, we plan to fine-tune VLMs on this future
dataset to bridge the current gap between academic
research and industry requirements in chart classifi-
cation tasks. Additionally, we aim to explore chart
description generation, leveraging the multimodal ca-
pabilities of VLMs.
ACKNOWLEDGEMENTS
We would like to especially thank the companies Dat-
analysis and Duke, which made this research possible
through their financial support and provided access to
their computing resources on Azure.
REFERENCES
Akhtar, M., Cocarascu, O., and Simperl, E. P. B.
(2023). Reading and reasoning over chart images
for evidence-based automated fact-checking. ArXiv,
abs/2301.11843.
Amara, J., Kaur, P., Owonibi, M., and Bouaziz, B. (2017).
Convolutional neural network based chart image clas-
sification.
Anil, R., Borgeaud, S., Wu, Y., Alayrac, J., Yu, J., Soricut,
R., Schalkwyk, J., Dai, A. M., Hauth, A., Millican,
K., Silver, D., Petrov, S., Johnson, M., Antonoglou, I.,
Schrittwieser, J., Glaese, A., Chen, J., Pitler, E., Lilli-
crap, T. P., Lazaridou, A., Firat, O., Molloy, J., Isard,
M., Barham, P. R., Hennigan, T., Lee, B., Viola, F.,
Reynolds, M., Xu, Y., Doherty, R., Collins, E., Meyer,
C., Rutherford, E., Moreira, E., Ayoub, K., Goel, M.,
Tucker, G., Piqueras, E., Krikun, M., Barr, I., Savinov,
N., Danihelka, I., Roelofs, B., White, A., Andreassen,
A., von Glehn, T., Yagati, L., Kazemi, M., Gonza-
lez, L., Khalman, M., Sygnowski, J., and et al. (2023).
Gemini: A family of highly capable multimodal mod-
els. CoRR, abs/2312.11805.
Ara
´
ujo, T., Chagas, P., Alves, J. B., Santos, C. G. R., Santos,
B. S., and Meiguins, B. S. (2020). A real-world ap-
proach on the problem of chart recognition using clas-
sification, detection and perspective correction. Sen-
sors (Basel, Switzerland), 20.
Baji
´
c, F., Habijan, M., and Nenadi
´
c, K. (2024). Eval-
uation of shallow convolutional neural network in
open-world chart image classification. Informatica,
48(6):185–198.
Balaji, A., Ramanathan, T., and Sonathi, V. (2018). Chart-
text: A fully automated chart image descriptor. CoRR,
abs/1812.10636.
Beyer, L., Steiner, A., Pinto, A. S., Kolesnikov, A.,
Wang, X., Salz, D., Neumann, M., Alabdulmohsin,
I., Tschannen, M., Bugliarello, E., Unterthiner, T.,
Keysers, D., Koppula, S., Liu, F., Grycner, A., Grit-
senko, A., Houlsby, N., Kumar, M., Rong, K., Eisen-
schlos, J., Kabra, R., Bauer, M., Bo
ˇ
snjak, M., Chen,
X., Minderer, M., Voigtlaender, P., Bica, I., Balazevic,
I., Puigcerver, J., Papalampidi, P., Henaff, O., Xiong,
X., Soricut, R., Harmsen, J., and Zhai, X. (2024).
Paligemma: A versatile 3b vlm for transfer. arXiv
preprint arXiv:2407.07726.
Brown, T. B., Mann, B., Ryder, N., Subbiah, M., Kaplan, J.,
Dhariwal, P., Neelakantan, A., Shyam, P., Sastry, G.,
Askell, A., Agarwal, S., Herbert-Voss, A., Krueger,
G., Henighan, T., Child, R., Ramesh, A., Ziegler,
D. M., Wu, J., Winter, C., Hesse, C., Chen, M., Sigler,
E., Litwin, M., Gray, S., Chess, B., Clark, J., Berner,
C., McCandlish, S., Radford, A., Sutskever, I., and
Amodei, D. (2020). Language models are few-shot
learners. CoRR, abs/2005.14165.
Cai, Z. and Vasconcelos, N. (2017). Cascade R-CNN:
delving into high quality object detection. CoRR,
abs/1712.00726.
Chen, J., Kong, L., Wei, H., Liu, C., Ge, Z., Zhao, L., Sun,
J., Han, C., and Zhang, X. (2024). Onechart: Purify
the chart structural extraction via one auxiliary token.
Chen, X., Djolonga, J., Padlewski, P., Mustafa, B., Chang-
pinyo, S., Wu, J., Ruiz, C. R., Goodman, S., Wang,
X., Tay, Y., Shakeri, S., Dehghani, M., Salz, D. M.,
Lucic, M., Tschannen, M., Nagrani, A., Hu, H., Joshi,
M., Pang, B., Montgomery, C., Pietrzyk, P., Ritter, M.,
Piergiovanni, A. J., Minderer, M., Pavetic, F., Waters,
A., Li, G., Alabdulmohsin, I. M., Beyer, L., Amelot,
J., Lee, K., Steiner, A., Li, Y., Keysers, D., Arnab, A.,
Xu, Y., Rong, K., Kolesnikov, A., Seyedhosseini, M.,
Angelova, A., Zhai, X., Houlsby, N., and Soricut, R.
(2023a). On scaling up a multilingual vision and lan-
guage model. 2024 IEEE/CVF Conference on Com-
puter Vision and Pattern Recognition (CVPR), pages
14432–14444.
Chen, X., Wang, X., Beyer, L., Kolesnikov, A., Wu, J.,
Voigtlaender, P., Mustafa, B., Goodman, S., Alabdul-
mohsin, I. M., Padlewski, P., Salz, D. M., Xiong, X.,
Vlasic, D., Pavetic, F., Rong, K., Yu, T., Keysers, D.,
Zhai, X.-Q., and Soricut, R. (2023b). Pali-3 vision
language models: Smaller, faster, stronger. ArXiv,
abs/2310.09199.
Cheng, Z., Dai, Q., Li, S., Sun, J., Mitamura, T., and Haupt-
mann, A. G. (2023). Chartreader: A unified frame-
work for chart derendering and comprehension with-
out heuristic rules. CoRR, abs/2304.02173.
Chiang, W.-L., Li, Z., Lin, Z., Sheng, Y., Wu, Z., Zhang, H.,
Zheng, L., Zhuang, S., Zhuang, Y., Gonzalez, J. E.,
Stoica, I., and Xing, E. P. (2023). Vicuna: An open-
source chatbot impressing gpt-4 with 90%* chatgpt
quality.
A Comparative Study of CNNs and Vision-Language Models for Chart Image Classification
825

Chollet, F. (2016). Xception: Deep learning with depthwise
separable convolutions. CoRR, abs/1610.02357.
Dosovitskiy, A., Beyer, L., Kolesnikov, A., Weissenborn,
D., Zhai, X., Unterthiner, T., Dehghani, M., Min-
derer, M., Heigold, G., Gelly, S., Uszkoreit, J., and
Houlsby, N. (2020). An image is worth 16x16 words:
Transformers for image recognition at scale. CoRR,
abs/2010.11929.
Han, Y., Zhang, C., Chen, X., Yang, X., Wang, Z., Yu, G.,
Fu, B., and Zhang, H. (2023). Chartllama: A multi-
modal LLM for chart understanding and generation.
CoRR, abs/2311.16483.
Howard, A. G., Zhu, M., Chen, B., Kalenichenko, D.,
Wang, W., Weyand, T., Andreetto, M., and Adam,
H. (2017). Mobilenets: Efficient convolutional neu-
ral networks for mobile vision applications. CoRR,
abs/1704.04861.
Huang, M., Han, L., Zhang, X., Wu, W., Ma, J., Zhang,
L., and Liu, J. (2024). Evochart: A benchmark and a
self-training approach towards real-world chart under-
standing. arXiv preprint arXiv:2409.01577.
Jiang, A. Q., Sablayrolles, A., Mensch, A., Bamford,
C., Chaplot, D. S., de Las Casas, D., Bressand, F.,
Lengyel, G., Lample, G., Saulnier, L., Lavaud, L. R.,
Lachaux, M., Stock, P., Scao, T. L., Lavril, T., Wang,
T., Lacroix, T., and Sayed, W. E. (2023). Mistral 7b.
CoRR, abs/2310.06825.
Kafle, K., Cohen, S., Price, B. L., and Kanan, C. (2018).
DVQA: understanding data visualizations via ques-
tion answering. CoRR, abs/1801.08163.
Kahou, S. E., Atkinson, A., Michalski, V., K
´
ad
´
ar,
´
A.,
Trischler, A., and Bengio, Y. (2017). Figureqa: An
annotated figure dataset for visual reasoning. ArXiv,
abs/1710.07300.
Kantharaj, S., Do, X. L., Leong, R. T. K., Tan, J. Q.,
Hoque, E., and Joty, S. R. (2022). Opencqa:
Open-ended question answering with charts. CoRR,
abs/2210.06628.
Krizhevsky, A., Sutskever, I., and Hinton, G. E. (2012).
Imagenet classification with deep convolutional neu-
ral networks. Communications of the ACM, 60:84 –
90.
Law, H. and Deng, J. (2018). Cornernet: Detecting objects
as paired keypoints. CoRR, abs/1808.01244.
LeCun, Y., Boser, B. E., Denker, J. S., Henderson, D.,
Howard, R. E., Hubbard, W. E., and Jackel, L. D.
(1989). Backpropagation applied to handwritten zip
code recognition. Neural Computation, 1:541–551.
Lin, Z., Liu, C., Zhang, R., Gao, P., Qiu, L., Xiao, H., Qiu,
H., Lin, C., Shao, W., Chen, K., Han, J., Huang, S.,
Zhang, Y., He, X., Li, H., and Qiao, Y. J. (2023).
Sphinx: The joint mixing of weights, tasks, and visual
embeddings for multi-modal large language models.
ArXiv, abs/2311.07575.
Liu, F., Wang, X., Yao, W., Chen, J., Song, K., Cho, S., Ya-
coob, Y., and Yu, D. (2023a). Mmc: Advancing multi-
modal chart understanding with large-scale instruction
tuning. arXiv preprint arXiv:2311.10774.
Liu, H., Li, C., Li, Y., and Lee, Y. J. (2023b). Im-
proved baselines with visual instruction tuning. CoRR,
abs/2310.03744.
Liu, H., Li, C., Li, Y., Li, B., Zhang, Y., Shen, S., and Lee,
Y. J. (2024). Llava-next: Improved reasoning, ocr, and
world knowledge.
Liu, H., Li, C., Wu, Q., and Lee, Y. J. (2023c). Visual
instruction tuning. CoRR, abs/2304.08485.
Liu, X., Klabjan, D., and Bless, P. N. (2019). Data ex-
traction from charts via single deep neural network.
CoRR, abs/1906.11906.
Liu, Z., Lin, Y., Cao, Y., Hu, H., Wei, Y., Zhang, Z., Lin,
S., and Guo, B. (2021). Swin transformer: Hierarchi-
cal vision transformer using shifted windows. CoRR,
abs/2103.14030.
Luo, J., Li, Z., Wang, J., and Lin, C. (2021). Chartocr:
Data extraction from charts images via a deep hybrid
framework. In IEEE Winter Conference on Applica-
tions of Computer Vision, WACV 2021, Waikoloa, HI,
USA, January 3-8, 2021, pages 1916–1924. IEEE.
Masry, A., Kavehzadeh, P., Do, X. L., Hoque, E., and Joty,
S. (2023). Unichart: A universal vision-language pre-
trained model for chart comprehension and reasoning.
Masry, A., Long, D. X., Tan, J. Q., Joty, S. R., and Hoque,
E. (2022). Chartqa: A benchmark for question an-
swering about charts with visual and logical reason-
ing. CoRR, abs/2203.10244.
Masry, A., Shahmohammadi, M., Parvez, M. R., Hoque, E.,
and Joty, S. (2024a). Chartinstruct: Instruction tuning
for chart comprehension and reasoning.
Masry, A., Thakkar, M., Bajaj, A., Kartha, A., Hoque,
E., and Joty, S. R. (2024b). Chartgemma: Visual
instruction-tuning for chart reasoning in the wild.
ArXiv, abs/2407.04172.
Meng, F., Shao, W., Lu, Q., Gao, P., Zhang, K., Qiao,
Y., and Luo, P. (2024). Chartassisstant: A universal
chart multimodal language model via chart-to-table
pre-training and multitask instruction tuning. CoRR,
abs/2401.02384.
Mesnard, T., Hardin, C., Dadashi, R., Bhupatiraju, S.,
Pathak, S., Sifre, L., Rivi
`
ere, M., Kale, M. S., Love,
J., Tafti, P., Hussenot, L., Chowdhery, A., Roberts,
A., Barua, A., Botev, A., Castro-Ros, A., Slone, A.,
H
´
eliou, A., Tacchetti, A., Bulanova, A., Paterson, A.,
Tsai, B., Shahriari, B., Lan, C. L., Choquette-Choo,
C. A., Crepy, C., Cer, D., Ippolito, D., Reid, D.,
Buchatskaya, E., Ni, E., Noland, E., Yan, G., Tucker,
G., Muraru, G., Rozhdestvenskiy, G., Michalewski,
H., Tenney, I., Grishchenko, I., Austin, J., Keeling, J.,
Labanowski, J., Lespiau, J., Stanway, J., Brennan, J.,
Chen, J., Ferret, J., Chiu, J., and et al. (2024). Gemma:
Open models based on gemini research and technol-
ogy. CoRR, abs/2403.08295.
Methani, N., Ganguly, P., Khapra, M. M., and Kumar, P.
(2019). Plotqa: Reasoning over scientific plots. 2020
IEEE Winter Conference on Applications of Computer
Vision (WACV), pages 1516–1525.
Newell, A., Yang, K., and Deng, J. (2016). Stacked hour-
glass networks for human pose estimation. CoRR,
abs/1603.06937.
ICAART 2025 - 17th International Conference on Agents and Artificial Intelligence
826

Obeid, J. and Hoque, E. (2020). Chart-to-text: Generating
natural language descriptions for charts by adapting
the transformer model. CoRR, abs/2010.09142.
Radford, A., Kim, J. W., Hallacy, C., Ramesh, A., Goh, G.,
Agarwal, S., Sastry, G., Askell, A., Mishkin, P., Clark,
J., Krueger, G., and Sutskever, I. (2021). Learning
transferable visual models from natural language su-
pervision. CoRR, abs/2103.00020.
Ren, S., He, K., Girshick, R. B., and Sun, J. (2015). Faster
R-CNN: towards real-time object detection with re-
gion proposal networks. CoRR, abs/1506.01497.
Santoro, A., Raposo, D., Barrett, D. G. T., Malinowski,
M., Pascanu, R., Battaglia, P. W., and Lillicrap, T. P.
(2017). A simple neural network module for relational
reasoning. CoRR, abs/1706.01427.
Shaheen, N., Elsharnouby, T., and Torki, M. (2024). C2f-
chart: A curriculum learning approach to chart classi-
fication. In Proceedings of the ICPR 2024, Egypt. Fac-
ulty of Engineering, Alexandria University and Ap-
plied Innovation Center, MCIT, ICPR.
Shi, B., Bai, X., and Yao, C. (2015). An end-to-end train-
able neural network for image-based sequence recog-
nition and its application to scene text recognition.
CoRR, abs/1507.05717.
Simonyan, K. and Zisserman, A. (2015). Very deep con-
volutional networks for large-scale image recognition.
In Bengio, Y. and LeCun, Y., editors, 3rd Interna-
tional Conference on Learning Representations, ICLR
2015, San Diego, CA, USA, May 7-9, 2015, Confer-
ence Track Proceedings.
Szegedy, C., Ioffe, S., and Vanhoucke, V. (2016). Inception-
v4, inception-resnet and the impact of residual con-
nections on learning. CoRR, abs/1602.07261.
Szegedy, C., Vanhoucke, V., Ioffe, S., Shlens, J., and Wojna,
Z. (2015). Rethinking the inception architecture for
computer vision. CoRR, abs/1512.00567.
Tan, M. and Le, Q. V. (2019). Efficientnet: Rethink-
ing model scaling for convolutional neural networks.
CoRR, abs/1905.11946.
Touvron, H., Lavril, T., Izacard, G., Martinet, X., Lachaux,
M.-A., Lacroix, T., Rozi
`
ere, B., Goyal, N., Hambro,
E., Azhar, F., Rodriguez, A., Joulin, A., Grave, E.,
and Lample, G. (2023a). Llama: Open and efficient
foundation language models. ArXiv, abs/2302.13971.
Touvron, H., Martin, L., Stone, K. R., Albert, P., Almahairi,
A., Babaei, Y., Bashlykov, N., Batra, S., Bhargava, P.,
Bhosale, S., Bikel, D. M., Blecher, L., Ferrer, C. C.,
Chen, M., Cucurull, G., Esiobu, D., Fernandes, J., Fu,
J., Fu, W., Fuller, B., Gao, C., Goswami, V., Goyal,
N., Hartshorn, A. S., Hosseini, S., Hou, R., Inan, H.,
Kardas, M., Kerkez, V., Khabsa, M., Kloumann, I. M.,
Korenev, A. V., Koura, P. S., Lachaux, M.-A., Lavril,
T., Lee, J., Liskovich, D., Lu, Y., Mao, Y., Martinet,
X., Mihaylov, T., Mishra, P., Molybog, I., Nie, Y.,
Poulton, A., Reizenstein, J., Rungta, R., Saladi, K.,
Schelten, A., Silva, R., Smith, E. M., Subramanian,
R., Tan, X., Tang, B., Taylor, R., Williams, A., Kuan,
J. X., Xu, P., Yan, Z., Zarov, I., Zhang, Y., Fan, A.,
Kambadur, M., Narang, S., Rodriguez, A., Stojnic,
R., Edunov, S., and Scialom, T. (2023b). Llama 2:
Open foundation and fine-tuned chat models. ArXiv,
abs/2307.09288.
Wei, H., Kong, L., Chen, J., Zhao, L., Ge, Z., Yu, E., Sun,
J., Han, C., and Zhang, X. (2024). Small language
model meets with reinforced vision vocabulary. arXiv
preprint arXiv:2401.12503.
Xia, R., Zhang, B., Peng, H., Ye, H., Ye, P., Shi, B., Yan, J.,
and Qiao, Y. (2023). Structchart: Perception, structur-
ing, reasoning for visual chart understanding. ArXiv,
abs/2309.11268.
Xia, R., Zhang, B., Ye, H., Yan, X., Liu, Q., Zhou, H., Chen,
Z., Dou, M., Shi, B., Yan, J., and Qiao, Y. (2024).
Chartx & chartvlm: A versatile benchmark and foun-
dation model for complicated chart reasoning. CoRR,
abs/2402.12185.
Xu, Z., Qu, B., Qi, Y., Du, S., Xu, C., Yuan, C., and
Guo, J. (2024). Chartmoe: Mixture of expert con-
nector for advanced chart understanding. ArXiv,
abs/2409.03277.
Yan, P., Ahmed, S., and Doermann, D. (2023). Context-
aware chart element detection.
Yan, P., Bhosale, M., Lal, J., Adhikari, B., and Doermann,
D. (2024). Chartreformer: Natural language-driven
chart image editing. In International Conference on
Document Analysis and Recognition, pages 453–469.
Springer.
Ye, Q., Xu, H., Xu, G., Ye, J., Yan, M., Zhou, Y., Wang, J.,
Hu, A., Shi, P., Shi, Y., Li, C., Xu, Y., Chen, H., Tian,
J., Qi, Q., Zhang, J., and Huang, F. (2023). mplug-
owl: Modularization empowers large language mod-
els with multimodality. ArXiv, abs/2304.14178.
Zhai, X., Mustafa, B., Kolesnikov, A., and Beyer, L. (2023).
Sigmoid loss for language image pre-training.
Zhang, L., Hu, A., Xu, H., Yan, M., Xu, Y., Jin, Q., Zhang,
J., and Huang, F. (2024). Tinychart: Efficient chart un-
derstanding with visual token merging and program-
of-thoughts learning. CoRR, abs/2404.16635.
A Comparative Study of CNNs and Vision-Language Models for Chart Image Classification
827
