
Visual Analytics for the Analysis of Sleep Quality
Maria Tsiobra
1
, Georgios Nikolis
1
, Christos Diamantakis
1
, Matthew Salanitro
2
, Ilias Kalamaras
1
,
Vasilis Lwlis
1
, Thomas Penzel
2
, Konstantinos Votis
1
and Dimitrios Tzovaras
1
1
Centre for Research and Technology Hellas (CERTH), Thessaloniki, Greece
2
Charit
´
e - Universit
¨
atsmedizin, Berlin
{mtsiobra, gnikolis, ch.diamantakis}@iti.gr, matthew.salanitro@charite.de, {kalamar, vaslwlis}@iti.gr,
Keywords:
Sleep Analysis, Visual Analytics, Spindle Detection, Healthcare, Sleep Stage Classification, Interactive
Visualization, Sleep Monitoring.
Abstract:
Monitoring the quality of sleep in patients of sleep disorders is often a time-consuming process, where the
clinician manually navigates through large volumes of recorded polysomnography data in an effort to visually
detect sleep patterns, such as sleep spindles, sleep stages and hints of disorders. We propose an application
that provides healthcare professionals with advanced tools for sleep analysis and spindle detection through
visual analytics for pattern detection, AI-based sleep scoring, and an interactive user interface. The system
processes multiple physiological signals and provides both raw data visualization, advanced feature analysis
capabilities, and a two-dimensional embedding of sleep intervals. By combining signal processing, spindle
detection, sleep stage identification and interactive visualization tools, this work helps researchers to efficiently
identify, validate, and analyze sleep and spindle characteristics with higher precision than traditional methods.
1 INTRODUCTION
Millions of people around the world battle sleep disor-
ders that significantly impact public health and quality
of life. Healthcare professionals analyze these disor-
ders through polysomnography (PSG) studies, which
generate extensive physiological data. While auto-
mated systems exist, there remains a need for tools
that combine automatic analysis with interactive vi-
sualization to support clinical decision-making.
This paper presents a sleep analysis application
featuring an interactive interface, visual analytics,
and AI-driven capabilities for sleep classification and
spindle detection. Our approach enhances conven-
tional methods by combining automated detection
with interactive exploration tools.
2 RELATED WORK
Sleep monitoring is essential for improving health
and well-being, as well as for diagnosing and treat-
ing sleep disorders. Visual analytics (VA) tools have
been developed to support the interpretation of sleep
data. Advancements in sensor technology and com-
puting methods has brought access to a large amount
of sleep data. This section reviews existing work on
sleep monitoring methods, visual analytics applica-
tions, and their integration with machine learning.
2.1 Visual Analytics for Sleep
Monitoring
Sleep monitoring is traditionally based on
polysomnography (PSG), which involves recording
physiological signals such as electroencephalogram
(EEG), electrooculogram (EOG), and electromyo-
gram (EMG). Although effective, PSG is resource
intensive and often limited to clinical studies. In
addition, the recordings are conduced typically to
specialized sleep labs, which may not accurately
represent a patient’s usual sleep patterns (Markun
and Sampat, 2023). Despite being resource-intensive,
PSG data remain helpful in sleep monitoring and
analyzing sleep disorders. The following systems
greatly improve sleep data analysis.
Sleep (Combrisson et al., ) is a Python-based ap-
plication offering GPU-accelerated visualization of
sleep data, automatic feature detection, and manual
scoring capabilities. While it provides valuable basic
analysis tools, our application extends these function-
alities to address clinical needs through advanced vi-
Tsiobra, M., Nikolis, G., Diamantakis, C., Salanitro, M., Kalamaras, I., Lwlis, V., Penzel, T., Votis, K. and Tzovaras, D.
Visual Analytics for the Analysis of Sleep Quality.
DOI: 10.5220/0013376500003912
Paper published under CC license (CC BY-NC-ND 4.0)
In Proceedings of the 20th International Joint Conference on Computer Vision, Imaging and Computer Graphics Theory and Applications (VISIGRAPP 2025) - Volume 1: GRAPP, HUCAPP
and IVAPP, pages 983-991
ISBN: 978-989-758-728-3; ISSN: 2184-4321
Proceedings Copyright © 2025 by SCITEPRESS – Science and Technology Publications, Lda.
983

sual analytics, including interactive 2D visualizations
for sleep pattern analysis.
V-Awake (Caballero et al., 2019) is a visual
analytics system for exploring and correcting deep
learning-based sleep stage predictions when ground
truth data is unavailable. While it primarily focuses
on model validation through interactive views of pre-
dictions and patterns, our system extends beyond this
to provide comprehensive clinical analysis tools. In
addition to signal visualization, our application in-
corporates spindle detection, feature extraction, and
temporal pattern analysis capabilities specifically de-
signed to support sleep disorder diagnosis.
SleepExplorer (Liang et al., 2016) analyzes rela-
tionships between commercial sleep tracker data and
lifestyle factors affecting sleep quality. While it fo-
cuses on personal sleep patterns, our system extends
beyond this by integrating advanced analytics and
visualization tools specifically designed for clinical
sleep disorder diagnosis and research. Through en-
hanced precision and interactivity, we transform sleep
data into meaningful clinical insights.
2.2 Automated Algorithms for Sleep
Monitoring
In this section, related work in the field of automated
identification of sleep spindles and sleep stages is
briefly presented.
2.2.1 Spindle Detection
Sleep spindles are EEG events characterizing the N2
sleep stage. They may be an indicator of intellec-
tual ability, memory consolidation, as well as qual-
ity of sleep (Fogel and Smith, 2011). They are fre-
quency related events and usually consist of short
bursts in the range of 11 - 16 Hz that last 0.5 to 2.5
seconds. Studies suggest that they may be associ-
ated with neurodegenerative diseases, like Alzheimer
(Weng et al., 2020). Consequently, this electroen-
cephalography activity can be very significant for the
diagnosis and treatment of many disorders, even be-
yond sleep. Sleep technicians usually notice these
events by visually examining raw data, which can take
a lot of time and could be counterproductive in long
sleep recordings. Thus, an automated mechanism for
the detection of such events could be very useful for
them.
Researchers have applied many techniques to de-
tect spindles, from algorithmic approaches to Deep
Learning. The ‘A7 Algorithm’ (Lacourse et al., 2019)
attempts to mimic the way sleep experts detect spin-
dles, by analyzing physical properties like frequen-
cies and amplitudes. A popular deep neural network
approach has achieved impressive performance (You
et al., 2021), while the hybrid CNN-LSTM architec-
ture (Tapia and Est
´
evez, 2020) has also been success-
fully applied.
2.2.2 Sleep Stage Classification
Automatic classification of sleep stages has aroused
a lot of interest (Loh et al., 2020) from the scien-
tific community, since manual sleep scoring requires
a substantial amount of time, as well as a lot of ex-
pertise. Sleep stages are classified into three cate-
gories: Wake, Non Rapid Eye Movement (NREM)
and Rapid Eye Movement (REM). The NREM cate-
gory can be further split into three subcategories (N1,
N2, N3). Each stage is characterized by specific ac-
tivity in the brain and the body, which can be captured
with polysomnography. PSG recordings are synchro-
nized and split into segments of 30 seconds, which are
called ‘epochs’.
The most common modeling approach is the im-
plementation of a Convolutional Neural Network
(CNN) with a single EEG channel (Wei et al., 2017).
Another effective approach is the Long Short Term
Memory (Hochreiter and Schmidhuber, 1997) model
which can achieve impressive results (Morokuma
et al., 2023). In general, significant progress has
been made in this research field and an application
that presents the results of such techniques in a user-
friendly way could be of paramount importance.
3 PROPOSED METHOD
In this section, we present the proposed methodology
for the development of the application. It includes
data processing, feature extraction, automated sleep
scoring, spindle detection and visualization.
3.1 Overall Architecture
The purpose of this application is to assist healthcare
professionals in analysing sleep data in a more effi-
cient way. Thus, the design process involved con-
sultation and feedback from sleep clinicians from
the Charit
´
e Universit
¨
atsmedizin Berlin (CUB). Expert
consultation led to the collection of functional and
non-functional requirements, including:
• temporal navigation of raw signals alongside
overall statistics.
• detection of sleep spindles.
IVAPP 2025 - 16th International Conference on Information Visualization Theory and Applications
984
• extraction of specialized features (e.g. frequency
bands) that are relevant for sleep quality assess-
ment.
• 2D projection of the extracted features to provide
research insights into sleep stage grouping and
clinical scoring patterns.
• improved user experience by filtering the visu-
alization output based on patients’ age, gender,
sleep stage, etc.
• a dynamic timelapse, on the 2D visualization
space, of the recording of patients during their
sleep.
The design of the system has been made to accom-
modate for the above requirements. The proposed
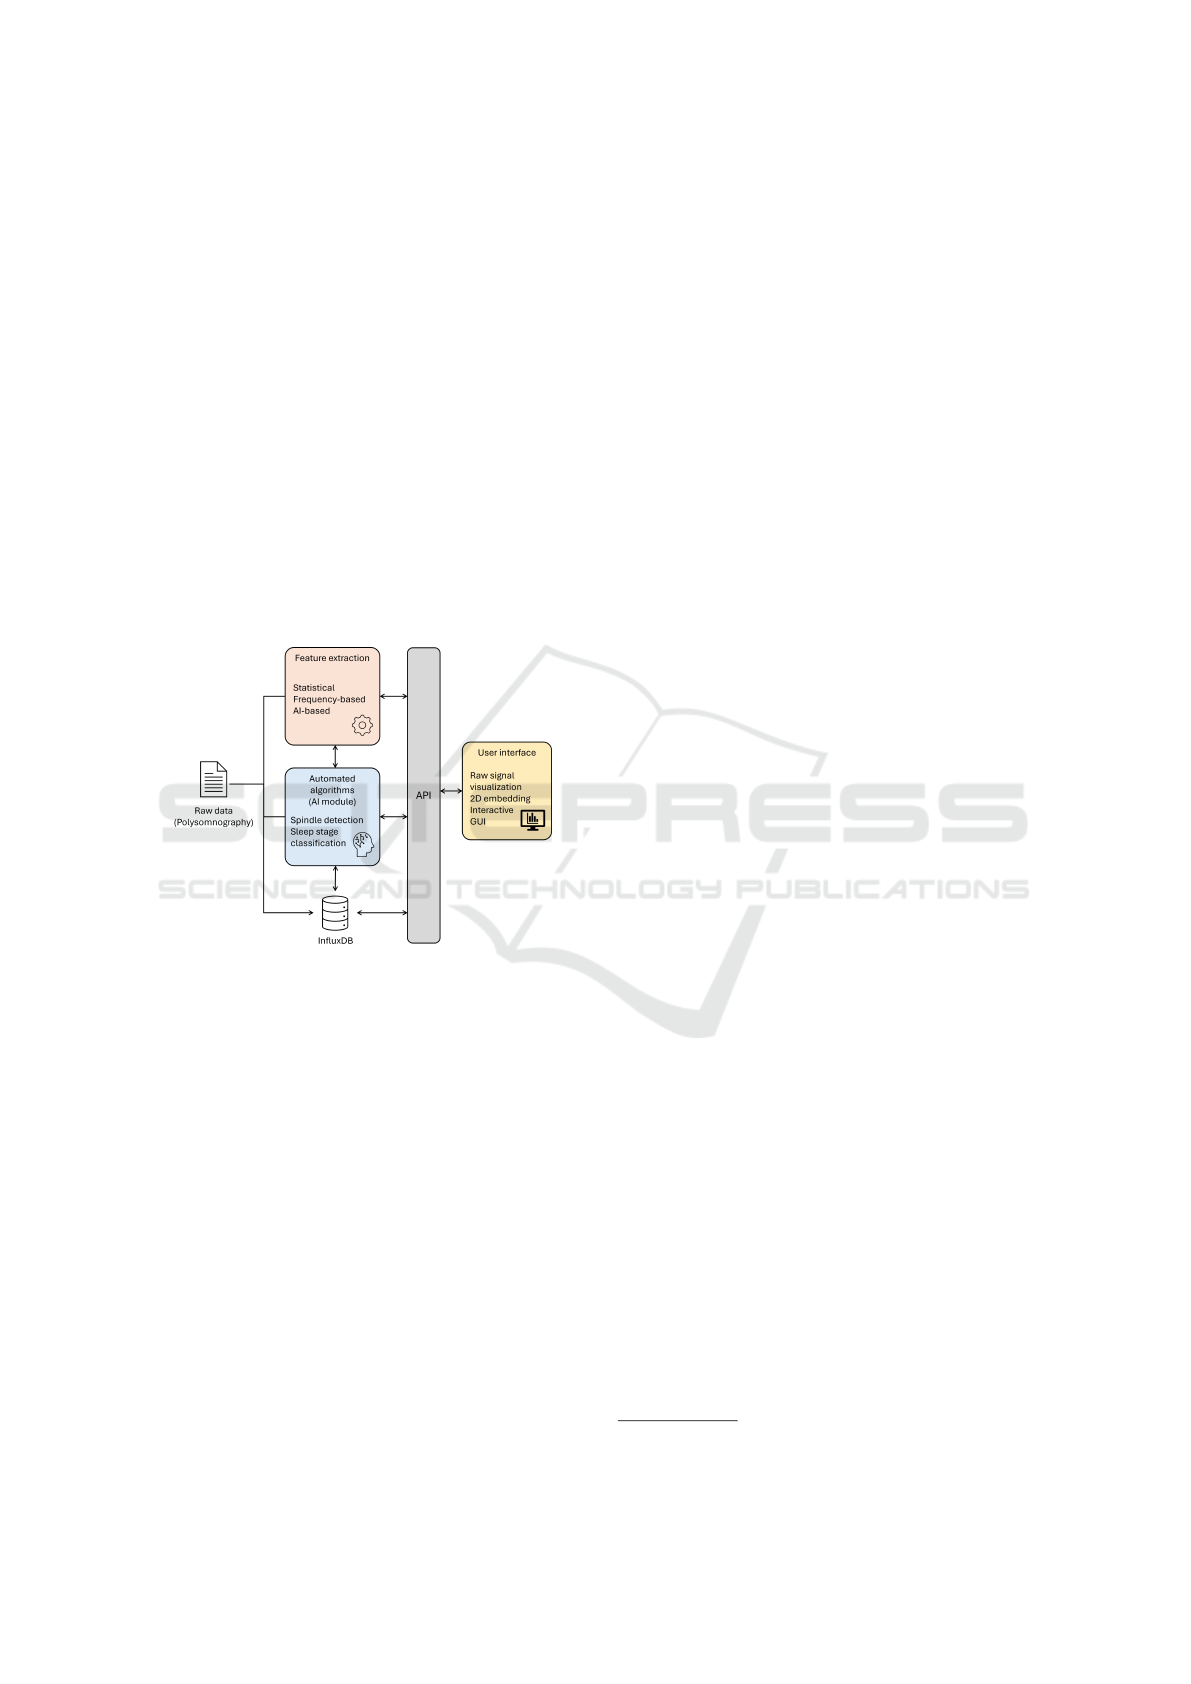
sleep analysis application implements an architecture
(Figure 1) that integrates raw polysomnography data
processing with AI analysis and visualization capabil-
ities.
Figure 1: Application architecture diagram.
The core process focuses on two main compo-
nents: a feature extraction module and a special-
ized AI analysis component. By employing statis-
tical methods, frequency-based techniques, and AI-
driven approaches, the feature extraction process un-
covers patterns within the sleep data. The AI module
utilizes deep learning architectures to classify sleep
stages and detect sleep spindles.
The system offers a user-friendly visualization
and interaction layer within an interactive graphical
user interface. The visualization framework provides
options for raw signal visualization as well as 2D rep-
resentations. The interactive GUI integrates all analy-
sis outputs and provides intuitive access to sleep anal-
ysis results.
The data used in this study consists of
polysomnography (PSG) recordings from the
CUB sleep laboratory database, stored in European
Data Format (EDF). The dataset includes recordings
from patients diagnosed with sleep apnea syndrome
according to AASM criteria, comprising EEG and
EOG signals (256 Hz), respiratory (128 Hz), and
SpO2 (1 Hz). The recordings include standardized
annotations marking clinical events such as respira-
tory events, sleep stages, arousals, and movement
artifacts, manually scored by sleep technicians.
For data management, we utilized InfluxDB
1
to
store and manage the extracted physiological sig-
nals. Its timestamp-based storage aligns naturally
with PSG recordings, while supporting concurrent
signal storage, flexible retention policies, and built-
in functions for downsampling and aggregation. This
design enhances computational efficiency and enables
effective management of high-frequency PSG data.
3.2 Feature Extraction
Feature extraction transforms raw physiological sig-
nals into measurable characteristics, highlighting key
aspects for analysis by reducing data dimensionality
while preserving essential information. In the pre-
sented visual analytics system, three sets of features
were extracted from the raw signal, one capturing
statistical information, another encoding frequency-
domain characteristics and and a third consisting
probabilities features extracted from a sleep stage
classification model.
3.2.1 Statistical Feature Extraction
Temporal statistical features were extracted from each
signal segment to capture time-domain characteris-
tics. For a given signal segment x[n] of length N, the
following statistical measures were computed, offer-
ing complementary information to the spectral analy-
sis:
• The mean (µ) indicates baseline shifts in the EEG
signal, which can be relevant for identifying sus-
tained changes in brain state.
• The standard deviation (σ) quantifies the signal’s
variability, often correlating with overall neural
activity levels.
• The maximum and minimum values (x
max
, x
min
)
capture extreme excursions in the signal, which
can be indicative of specific neural events or arti-
facts.
3.2.2 Frequency Domain Feature Extraction
The frequency-domain features are particularly sig-
nificant for sleep stage analysis, as different sleep
1
https://www.influxdata.com/products/influxdb/
Visual Analytics for the Analysis of Sleep Quality
985

states enclose distinct behaviors in the brain. These
brain patterns serve as fundamental markers for sleep
stage classification.
Signal Preprocessing: Prior to spectral analysis,
the EEG signals are preprocessed through resampling
to a uniform sampling frequency of 100 Hz. The
continuous signals are then segmented into 30-second
epochs, aligning with the standard duration used in
sleep staging.
Power Spectral Analysis: For each epoch, the
power spectral density (PSD) is estimated using a
Fourier Transform (FT) of the EEG signal:
PSD(ω) =
|F(ω)|
2
N
Where F(ω) represents the Fourier Transform of the
EEG signal and N is the length of the discretized sam-
ple.
Frequency Band Analysis: Following the power
spectral computation, features based on five fre-
quency bands were extracted, commonly used in neu-
roscience, Table 1:
Table 1: Description of EEG Frequency Bands.
Frequency Band Description
Delta (0-4 Hz) Dominant in deep sleep (Stage III/IV)
Theta (4-7 Hz) Prominent during drowsiness and light sleep
Alpha (7-12 Hz) Associated with relaxed wakefulness
Beta (12-30 Hz) Characteristic of active wakefulness
Gamma (30-50 Hz) Linked to complex cognitive processing
Multi-Channel Analysis: The spectral analysis is
performed on three EEG channels (F4, O2, and C4),
enabling the capture of spatial variations in brain ac-
tivity. For each channel and each 30-second epoch,
the bandpower features are extracted independently,
resulting in a set of frequency-domain features that
characterize different regions of the brain during
sleep. The bandpower for a frequency band is com-
puted by numerical integration of the power spectral
density function over the frequency band of interest:
bp(x, f
lower
, f
upper
) =
Z
f
upper
f
lower
PSD(ω)dω
The relative bandpower is calculated as:
bp
relative
(x, f
lower
, f
upper
) =
bp(x, f
lower
, f
upper
)
bp(x, 0, ∞)
3.2.3 CNN Feature Extraction
Long multivariate time series can be difficult to in-
terpret. In addition, the decision making process of
AI applications is not always clear. For this purpose,
this application will use an AI model, which is de-
scribed in a following section (3.3.2), for the visual-
ization of the computed probabilities (CNN features)
of each class in order to make the system more trans-
parent, apart from the visualization of the predicted
sleep stages.
The complete feature vector for each window con-
sists of five relative bandpowers (δ, θ, α, β, γ), four sta-
tistical measures (µ, σ, x
max
, x
min
) and five probabili-
ties, one of each class.
3.3 Automated Methods for Sleep
Monitoring
In this section, the development of an automated sleep
scoring and a spindle detection mechanism are pre-
sented. At first, the design process of their architec-
ture is described and afterwards, the input data as well
as its preprocessing are explained. Both of them are
meant to be used as additional functionalities of the
application to showcase the kind of capabilities that
can be included.
3.3.1 Spindle Detection
Architecture: Due to the lack of labels of this spe-
cific dataset, the spindle detection is based on the
Python implementation (Kaulen et al., 2022) of the
‘A7 Algorithm’ (Lacourse et al., 2019). This ap-
proach attempts to automate the way human experts
detect spindles. Sleep technicians may visually no-
tice a small frequency burst in a part of a signal that
could indicate a spindle. Four parameters that can
capture information about these events are calculated
and compared to some thresholds that decide whether
a spindle is detected or not. Since the equipment that
was used for the recording of these signals can impact
their overall shape, in terms of amplitude or noise,
these thresholds were adjusted in order to fit the sig-
nals that are used in this application, compared to the
ones described in the original implementation. The
algorithm detects spindles in length ranging from 0.3
to 2.5 seconds. Finally, we consider events in the fre-
quency range of 12-14 Hz as spindles, in order to de-
crease the false positive detections.
Data Preprocessing: The sleep spindles are mostly
apparent on the central EEG channels. Thus, the C4
IVAPP 2025 - 16th International Conference on Information Visualization Theory and Applications
986

EEG signal was used as an input for the above algo-
rithm. The signal is passed through a band-pass filter
of 0.3 - 30 Hz and is sampled at 100 Hz. Apart from
the filtering done in the scope of the A7 implemen-
tation, no further preprocessing has been done. The
results and their evaluation are described in section
4.1.
3.3.2 Sleep Stage Classification
Architecture: The main purpose of this implemen-
tation was to isolate certain layers in order to extract
features from raw data. Several well known imple-
mentations were tested. The selected model is in-
spired by the architecture of DeepSleepNet (Supratak
et al., 2017). Since the application focuses on fea-
ture extraction and visualization, only the CNN part
of the model was used. The architecture consists of
two main branches with a series of layers. This tech-
nique is capable of capturing information from the in-
put effectively, since the sizes of the filters vary. Over-
all, each branch consists of four convolutional layers
with some pooling and dropout layers between them.
Finally, the two branches are merged together and a
softmax layer is added for classification. The func-
tional API of tensorflow was used, in order to add the
option to easily isolate layers for further examination
of the feature extraction mechanism.
Data Preprocessing: Since the goal was to extract
features, many combinations of signals were tested.
However, the addition of multiple channels did not
seem to improve the overall performance of the model
in terms of complexity and accuracy and thus, the two
central EEG channels were selected (C4, F4). The
data were split into 30-second-epochs at 100 Hz and
passed through a band-pass filter of 0.3-100 Hz. The
annotations were synchronized and measures were
taken to verify that no gaps or NAN values existed.
The severe class imbalance was dealt with the use
of the Synthetic Minority Oversampling Technique
(SMOTE) (Chawla et al., 2002) by the imbalanced-
learn package (Lema
ˆ
ıtre et al., 2017). After apply-
ing it and verifying that no leakage of information oc-
curred to the test or the validation set, the dataset was
ready for the training process. The results and their
evaluation are described in section 4.2.
3.4 Interactive Visual Analytics
Interface
The visualization of sleep data plays a crucial role
in understanding patterns and relationships within
polysomnography datasets. In this section, the two
most important panels of the application are pre-
sented, regarding the visualization of raw signals as
well as of temporal segments as points in a two-
dimensional space.
3.4.1 Signal Visualization and Analysis
The raw signal visualization panel (Figure 2) presents
multi-channel physiological data through synchro-
nized time-series plots. The interface supports the
display of specifically selected channels (EEG, ECG,
respiratory signals) with individual y-axis scaling op-
timized for each signal type. At the top of the screen,
users can select records as well as adjust viewing pref-
erences. Specifically, they can select a 30-second or
1-minute view of raw data, while navigation controls
allow precise temporal exploration with 5-second and
30-second steps. In the middle of the panel, the pre-
dicted sleep stages graph provides the ability to view
the raw data of each time window by clicking on it.
At the bottom of the screen, some overall statistics
provide a quick overview of the recording. Lastly, the
detected spindles are highlighted in red in both the C4
EEG signal as well as on the sleep stages graph.
3.4.2 Dimensionality Reduction and
Visualization
To enable the identification of similar patterns that
could indicate different sleep stages, anomalies, or
disorders, temporal segments (30-second windows)
of PSG signals are visualized as points in a two-
dimensional space. This visualization is generated by
initially extracting features from each segment and
applying t-Distributed Stochastic Neighbor Embed-
ding (t-SNE) (van der Maaten and Hinton, 2008),
which has been previously used on sleep scoring mod-
els (Guo et al., 2024). This method was selected
because it manages to create effective 2D visual-
izations of data that lie in highly non-linear mani-
folds in the high-dimensional space (including statis-
tical, frequency-domain, and CNN features), reveal-
ing complex relationships and patterns such as clus-
ters and outliers. The results of this visualization are
described in section 4.3
The t-SNE visualization page (Figure 3) displays
the two-dimensional embedding of the sleep intervals
in an interactive manner. The vertical menu on the left
offers multiple filtering options that are important for
sleep analysis, such as gender, age group and sleep
stage. At the top of the panel, users can select the pa-
tients that they want to review on the 2D map. More-
over, they have the option to select the way that the
data points are colored, either by patient or by sleep
stages. In addition, both manual sleep stage coloring
Visual Analytics for the Analysis of Sleep Quality
987
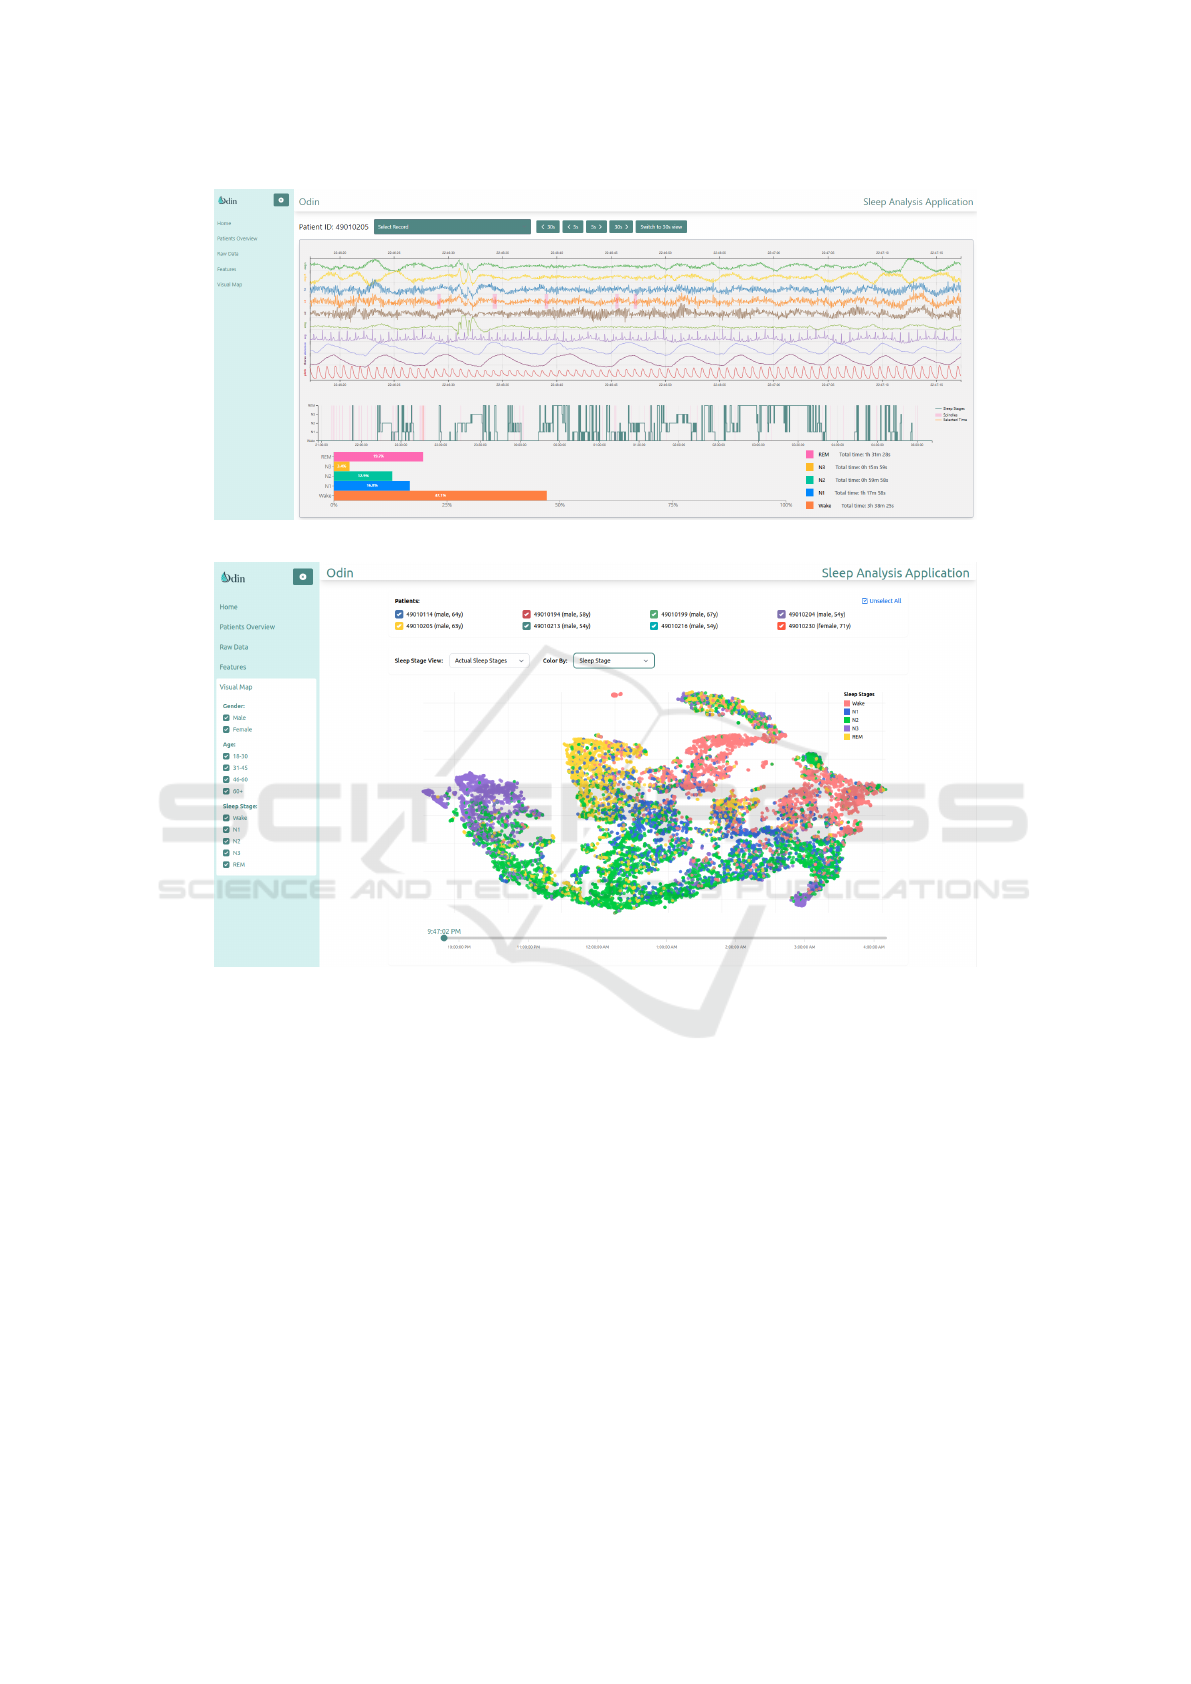
Figure 2: Signal visualization panel.
Figure 3: Interactive t-SNE visualization interface showing the two-dimensional embedding of sleep intervals.
and AI predicted sleep stage coloring are supported.
At the bottom of the screen, there is a timelapse func-
tionality for animating sleep progression in time with
a rolling bar, which allows clinicians to see how these
dots and their corresponding sleep stages are created
throughout the recording.
During daily practice, a clinician would use the
signal visualization panel to examine the stored
polysomnography recordings, and would use the out-
puts of the spindle detection and sleep detection meth-
ods to quickly identify areas of interest in the raw
data, without having to manually examine the whole
signal, which is a tedious process. Furthermore, the
clinical researcher would examine the 2D visualiza-
tion in order to collectively view information from
several patients, to have a comprehensive overview of
the sleep patterns appearing in the complete dataset
and distinguish segments of recordings that divert
from the usual pattern.
4 EVALUATION RESULTS
This section presents evaluation results for the spin-
dle detection, the automated sleep stage identification,
and the two-dimensional visualization. Regular quali-
tative assessments and feedback from CUB clinicians
guided system development and fine-tuning.
4.1 Spindle Detection
Figure 4 shows the detected spindles and their dura-
tion. Since there is not a ground truth set for this
dataset it is difficult to properly evaluate the perfor-
mance in an objective way. By visually inspecting
the results thoroughly and receiving feedback from
IVAPP 2025 - 16th International Conference on Information Visualization Theory and Applications
988
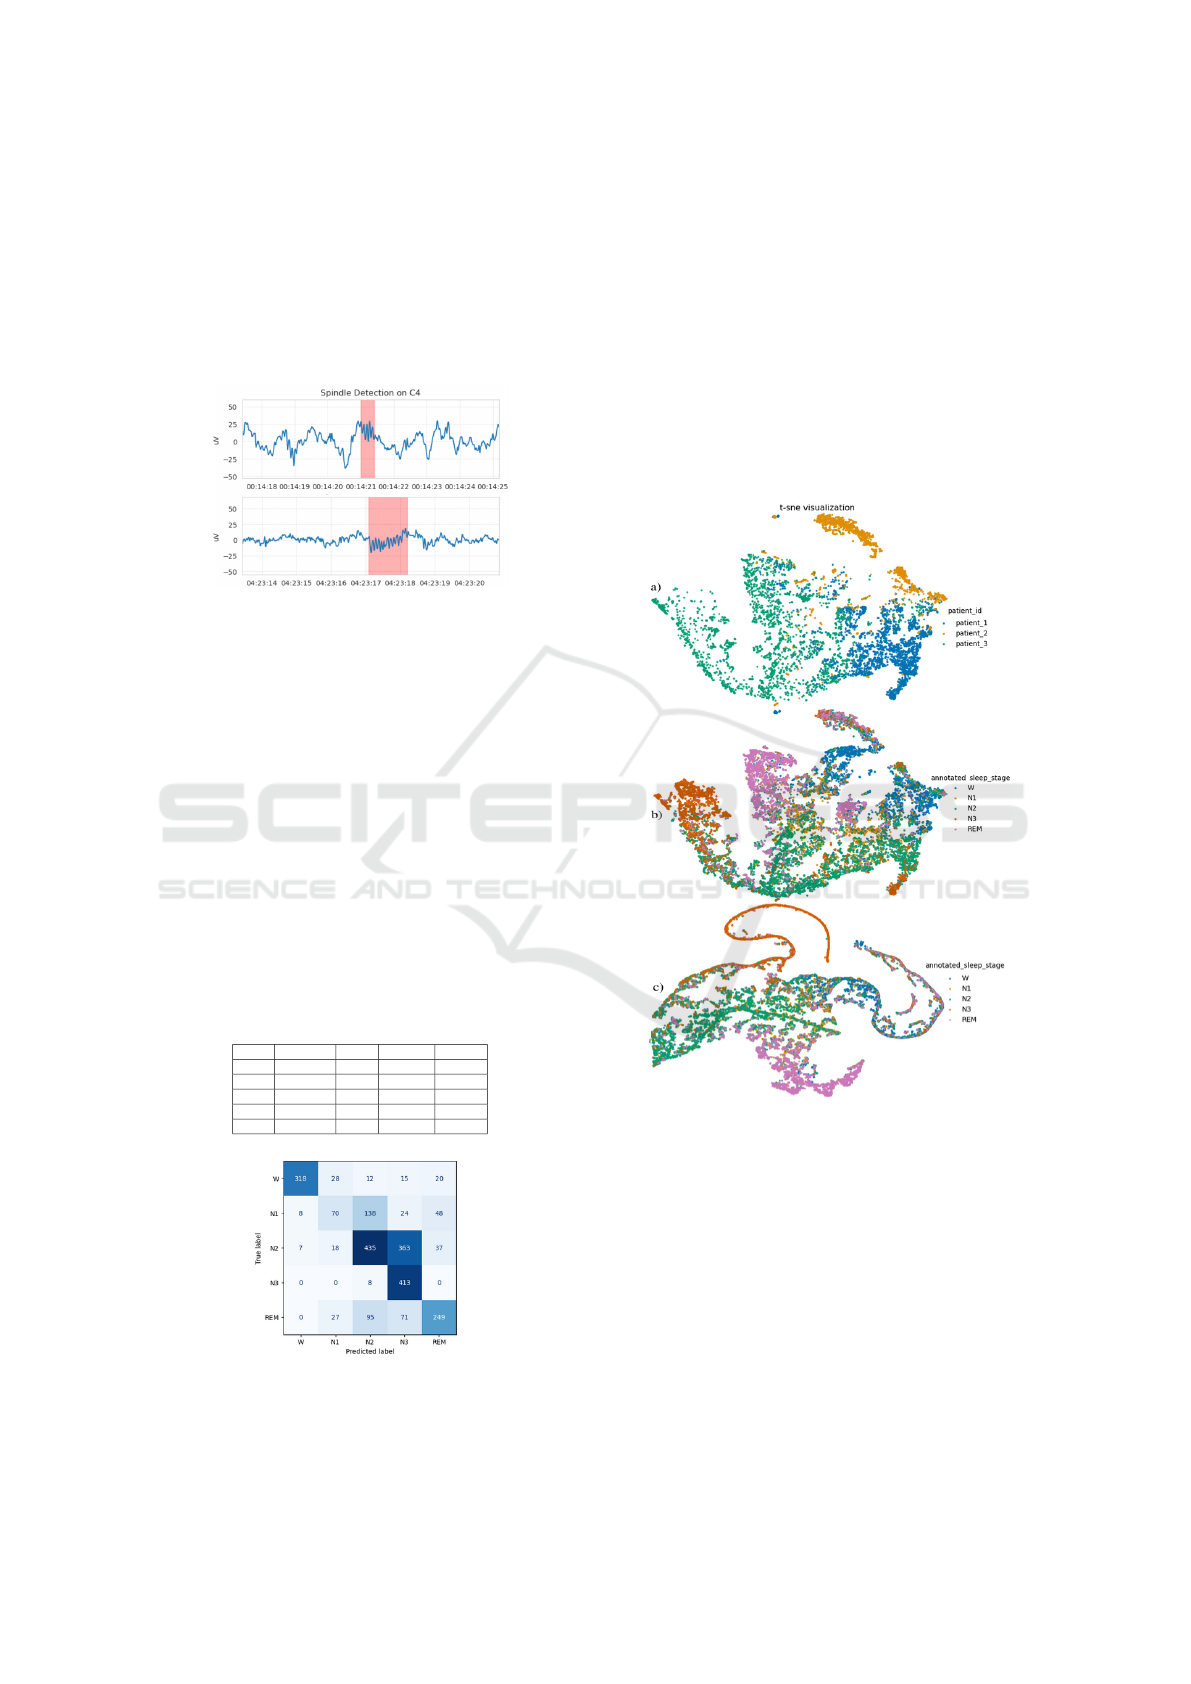
experts, the spindle detection seems adequate to be
used as a recommendation feature in the application,
which could assist sleep technicians in recognizing
these events in a much more quick and efficient way.
The detection of spindles is a very important addi-
tional functionality and despite the lack of labels, it is
included in our implementation to showcase the value
that it can offer.
Figure 4: Spindle detection by the A7 Algorithm.
4.2 Sleep Stage Classification
The final results (Table 2) show that the model has
mediocre performance compared to state-of-the-art
publicly available implementations. Specifically, tak-
ing a closer look into the confusion matrix (Figure
5), the misclassification of ‘N1’ and ‘N2’ observa-
tions seem to cause the drop in performance. The
overall model structure and consistency of labels have
probably played a significant role in its performance,
as many attempts to improve it were not successful.
Despite its mediocre performance, the feature extrac-
tion mechanism can provide useful information to the
sleep technician, even if a misclassification occurs.
Table 2: Scores of sleep stage classification model on the
test set.
precision recall f1-score support
W 0.95 0.81 0.88 393
N1 0.49 0.24 0.32 288
N2 0.63 0.51 0.56 860
N3 0.47 0.98 0.63 421
REM 0.70 0.56 0.63 442
Figure 5: Confusion matrix of sleep scoring model.
4.3 Visualization Evaluation
The two-dimensional representation is presented in
Figure 6. Each dot represents an index of the feature
vector that derives from a 30 second window of raw
data. It should be noted that the two axes do not have
a specific meaning in this case. However, the way
these points are grouped together provides significant
insight into how sleep stages and disorders are formed
among patients in a direct way. Figure 6a presents the
points from three patients, as an example. At a glance,
it is clear that data seem to group at specific areas for
each patient.
Figure 6: Two-dimensional representation of: (a) all fea-
tures of three patients colored by patient, (b) all features of
all patients colored by sleep stage, (c) cnn features colored
by sleep stage.
A representation of all the patients is shown in
Figure 6b, where each dot is colored based on the
annotated sleep stage. It can be observed that sleep
stages cluster in specific areas of the plot, which could
provide very valuable information to sleep techni-
cians about quality of sleep. It is also very interest-
ing that ‘N1’ seems to be the sleep stage in the center
of the plot, which could indicate that it is the most
difficult to distinguish among the others, while ‘N3’
seems to be the most easily distinguished one.
Visual Analytics for the Analysis of Sleep Quality
989

The same procedure is shown in Figure 6c with
only the CNN features. A similar behavior is present,
as sleep stages seem to group in certain areas with
some overlappings. Judging by the coloring of the
manually annotated sleep stages, the CNN features
can group the sleep stages in a relatively accurate
way. Finally, Figure 6c enhances the explainability
of the model, since it shows which classes are most
frequently misclassified and in which areas.
5 CONCLUSIONS
We introduce an advanced sleep monitoring system
which combines AI-based analysis and interactive vi-
sualization tools. Three key components—a spin-
dle detection method, a sleep stage identification
model and a two-dimensional embedding of sleep in-
tervals—combined with raw signal visualization in
an interactive dashboard, enable the system to im-
plement a multi-view approach. The detection of
spindles on raw EEG data is a powerful tool that
can enhance the capabilities of sleep analysis. The
stage classification model demonstrated varying per-
formance across sleep stages which reflects the inher-
ent complexity of sleep classification. Moreover, t-
SNE visualization with large datasets can place lim-
itations due to its high computational cost. Future
work includes the installation of the system at the
CUB premises, and a thorough assessment of its use-
fulness and usability with standardized questionnaires
(e.g. SUS scale) after a pilot usage. In addition, we
will focus on quantitative evaluation of spindle detec-
tion using expert ground truth and extending the 2D
visualization framework for apnea analysis.
ACKNOWLEDGMENT
This work has been supported by the EU H2020
project ODIN (H2020-DT-ICT-12-2020, grant agree-
ment no. 101017331).
REFERENCES
Caballero, H., Westenberg, M., Gebre, B., and Wijk, J.
(2019). V-awake: A visual analytics approach for cor-
recting sleep predictions from deep learning models.
Computer Graphics Forum, 38:1–12.
Chawla, N. V., Bowyer, K. W., Hall, L. O., and Kegelmeyer,
W. P. (2002). Smote: Synthetic minority over-
sampling technique. Journal of Artificial Intelligence
Research, 16:321–357.
Combrisson, E., Vallat, R., Eichenlaub, J.-B., O’Reilly, C.,
Lajnef, T., Guillot, A., Ruby, P. M., and Jerbi, K.
Sleep: An open-source python software for visualiza-
tion, analysis, and staging of sleep data.
Fogel, S. M. and Smith, C. T. (2011). The function of the
sleep spindle: A physiological index of intelligence
and a mechanism for sleep-dependent memory con-
solidation. Neuroscience & Biobehavioral Reviews,
35(5):1154–1165.
Guo, Y., Nowakowski, M., and Dai, W. (2024). Flexsleep-
transformer: a transformer-based sleep staging model
with flexible input channel configurations. Scientific
Reports, 14.
Hochreiter, S. and Schmidhuber, J. (1997). Long short-term
memory. Neural computation, 9:1735–80.
Kaulen, L., Schwabedal, J. T. C., Schneider, J., Ritter, P.,
and Bialonski, S. (2022). Advanced sleep spindle
identification with neural networks. Scientific Reports,
12(1).
Lacourse, K., Delfrate, J., Beaudry, J., Peppard, P., and
Warby, S. C. (2019). A sleep spindle detection al-
gorithm that emulates human expert spindle scoring.
Journal of Neuroscience Methods, 316:3–11. Methods
and models in sleep research: A Tribute to Vincenzo
Crunelli.
Lema
ˆ
ıtre, G., Nogueira, F., and Aridas, C. K. (2017).
Imbalanced-learn: A python toolbox to tackle the
curse of imbalanced datasets in machine learning.
Journal of Machine Learning Research, 18(17):1–5.
Liang, Z., Ploderer, B., Liu, W., Nagata, Y., Bailey, J., Ku-
lik, L., and Li, Y. (2016). Sleepexplorer: A visualiza-
tion tool to make sense of correlations between per-
sonal sleep data and contextual factors. Personal and
Ubiquitous Computing, 20:985–1000.
Loh, H. W., Ooi, C. P., Vicnesh, J., Oh, S. L., Faust, O., Ger-
tych, A., and Acharya, U. R. (2020). Automated de-
tection of sleep stages using deep learning techniques:
A systematic review of the last decade (2010–2020).
Applied Sciences.
Markun, L. C. and Sampat, A. (2023). Clinician-
focused overview and developments in polysomnog-
raphy. Journal of Clinical Sleep Medicine.
Morokuma, S., Hayashi, T., Kanegae, M., Mizukami, Y.,
Asano, S., Kimura, I., Tateizumi, Y., Ueno, H., Ikeda,
S., and Niizeki, K. (2023). Deep learning-based
sleep stage classification with cardiorespiratory and
body movement activities in individuals with sus-
pected sleep disorders. Scientific Reports, 13.
Supratak, A., Dong, H., Wu, C., and Guo, Y. (2017). Deep-
sleepnet: A model for automatic sleep stage scoring
based on raw single-channel eeg. IEEE Transactions
on Neural Systems and Rehabilitation Engineering,
25(11):1998–2008.
Tapia, N. I. and Est
´
evez, P. A. (2020). Red: Deep recur-
rent neural networks for sleep eeg event detection. In
2020 International Joint Conference on Neural Net-
works (IJCNN), pages 1–8.
van der Maaten, L. and Hinton, G. (2008). Visualizing data
using t-sne. Journal of Machine Learning Research,
9(86):2579–2605.
IVAPP 2025 - 16th International Conference on Information Visualization Theory and Applications
990

Wei, L., Lin, Y., Wang, J., and Ma, Y. (2017). Time-
frequency convolutional neural network for automatic
sleep stage classification based on single-channel
EEG. pages 88–95.
Weng, Y.-Y., Lei, X., and Yu, J. (2020). Sleep spindle ab-
normalities related to alzheimer’s disease: a system-
atic mini-review. Sleep Medicine, 75:37–44.
You, J., Jiang, D., Ma, Y., and Wang, Y. (2021). Spindleu-
net: An adaptive u-net framework for sleep spindle
detection in single-channel eeg. IEEE Transactions
on Neural Systems and Rehabilitation Engineering,
PP:1–1.
Visual Analytics for the Analysis of Sleep Quality
991
