
Embedded System for Responsive Optogenetic Control of Spontaneous
Seizures in a Preclinical Temporal Lobe Epilepsy Model
Sofie Lasure
1,2 a
, Lien De Schaepmeester
2 b
, Sielke Caestecker
2 c
, Jeroen Spanoghe
2 d
,
Marijke Vergaelen
2 e
, Rik Verplancke
1 f
, Johannes Vierock
3 g
, Robrecht Raedt
2 h
and
Pieter Bauwens
1 i
1
Center for Microsystems Technology, Imec and Ghent University, Belgium
2
4BRAIN, Department of Head and Skin, Ghent University, Belgium
3
Neuroscience Research Center, Charit
´
e, Universit
¨
atsmedizin zu Berlin, Germany
fi
Keywords:
Epilepsy, Responsive Neuromodulation, Optogenetics, MSP430 Microcontroller, Embedded System.
Abstract:
Aims: Responsive neuromodulation employing optogenetics is a promising therapy which provides spatial and
temporal specificity for temporal lobe epilepsy (TLE), a neurological disorder characterised by the occurrence
of spontaneous seizures. In this study, we evaluated whether seizures could be detected with a self-designed
minimalist embedded system and terminated through activation of the WiChR opsin in the intrahippocampal
kainic acid (IHKA) mouse model of temporal lobe epilepsy. Methods: Mice were injected in the hippocam-
pus with kainic acid to simulate TLE and with the AAV2/9 viral vector to induce expression of the WiChR
opsin. Intracranial EEG was recorded and processed with a low-power microcontroller to detect the seizure
via the amplitude correlation metric. Upon detection, a 473 nm Light Emitting Diode (LED) was activated to
illuminate the hippocampus through an optrode. Results: It was possible to responsively illuminate seizures
with the embedded system and achieve a significant reduction in seizure duration with a pulse train of 10 Hz,
5 ms, 10 mW for 90 s. A brief parameter study was performed although preliminary results were inconclusive.
Conclusions: In this study, we prove that we can responsively suppress seizures in the IHKA mouse model
within the limitations of a minimalist embedded system. Additionally, the WiChR opsin has been demon-
strated to have a high potential for efficient seizure suppression with limited illumination.
1 INTRODUCTION
Temporal lobe epilepsy (TLE) is a chronic neuro-
logical condition characterised by recurrent seizures
originating in the temporal lobe of the brain. While
the use of anti-seizure medication remains the first
line of treatment, neuromodulation offers a promis-
ing alternative for patients whose seizures are not ad-
equately controlled by medication or for whom re-
sective surgery is not an option. Neuromodulation
a
https://orcid.org/0000-0001-8625-5896
b
https://orcid.org/0009-0000-6660-0541
c
https://orcid.org/0000-0001-7398-183X
d
https://orcid.org/0000-0002-4427-0948
e
https://orcid.org/0000-0002-2915-667X
f
https://orcid.org/0000-0002-6642-9454
g
https://orcid.org/0000-0001-7368-5539
h
https://orcid.org/0000-0002-8939-0169
i
https://orcid.org/0000-0001-9398-2485
is a technique where the brain is stimulated, usually
electrically, and has been proven a viable therapy for
several neurological disorders, including TLE. Both
Deep Brain Stimulation (DBS) and the Responsive
Neuromodulation System (RNS) have been FDA-
approved and have shown promise in reducing seizure
frequency and improving quality of life for patients
(Ryvlin and Jehi, 2021; Ebrahim and Tungu, 2022).
However, there remain significant drawbacks to
the use of electrical stimulation. The electrical pulses
affect a large area of the brain, including neurons
and neuronal projections not related to the neurolog-
ical disorder. Optical stimulation can provide a so-
lution as the stimulated area is much smaller, allow-
ing stimulation with an increased spatial specificity.
Optical stimulation would have a limited effect on
the brain activity so it must be used in combination
with techniques like optogenetics or optopharmacol-
ogy (Ebrahim and Tungu, 2022).
With optogenetics, light sensitive proteins
88
Lasure, S., De Schaepmeester, L., Caestecker, S., Spanoghe, J., Vergaelen, M., Verplancke, R., Vierock, J., Raedt, R. and Bauwens, P.
Embedded System for Responsive Optogenetic Control of Spontaneous Seizures in a Preclinical Temporal Lobe Epilepsy Model.
DOI: 10.5220/0013377000003911
Paper published under CC license (CC BY-NC-ND 4.0)
In Proceedings of the 18th International Joint Conference on Biomedical Engineering Systems and Technologies (BIOSTEC 2025) - Volume 1, pages 88-99
ISBN: 978-989-758-731-3; ISSN: 2184-4305
Proceedings Copyright © 2025 by SCITEPRESS – Science and Technology Publications, Lda.

(opsins) are introduced through the use of a viral
vector. These opsins can be activated by illumination,
either exciting or inhibiting a cell’s activity (Medina
et al., 2023). The WiChR opsin is a novel inhibitory
channelrhodopsin that introduces light-sensitive
potassium ion channels, maximally activated by light
pulses with a wavelength around 470 nm. Compared
to other opsins, the WiChR opsin has some major
advantages as the potassium ion channels have a
larger photocurrent during illumination and the
opsins close relatively slowly, allowing for efficient
(Vierock et al., 2022).
Optopharmacology uses light-sensitive com-
pounds which can be locally activated with optical
stimulation. An example of this type of compound is
photocaged N6-cyclopentyladenosine (cCPA) which
can be activated by 405 nm illumination (Craey et al.,
2022; Spanoghe et al., 2024). A novel epilepsy treat-
ment is under development using optopharmacology
in combination with the use of evoked potentials
(EP’s), which are neuronal responses to a stimulation
pulse and are linked to the excitability of the brain.
Controlling the excitability, as extracted from the
EP’s, using responsive activation of cCPA has been
shown to reduce the occurrence of seizures ex vivo
(Craey, 2022).
The final goal when developing responsive neu-
romodulation therapies is twofold: (1) a proof-of-
concept of the therapeutic effect and (2) the ability
to run these therapies on an implantable device. Both
goals present their own unique challenges but are in-
herently linked to each other through the required
hard- and software. The aim of the development of
this embedded system was focused towards an im-
plantable device but adjusted to allow neuromodula-
tion experiments within a preclinical setting. There-
fore, there were two main design considerations: (1)
implementation within an existing EEG recording set-
up and (2) the possibility for miniaturisation to allow
development towards an implantable device.
This paper will describe the design of hard- and
software of this embedded system. This device was
used to conduct a feasability study of a neuromodula-
tion therapy where seizures were suppressed upon de-
tection in the Intrahippocampal Kainic Acid (IHKA)
mouse model of TLE using the novel WiChR opsin,
illustrating that this is possible even with minimalist
hard- and software (Zeidler et al., 2018). Within this
experiment, an initial exploration of the stimulation
parameter space was performed to increase the un-
derstanding of the behaviour of the WiChR opsin and
search for the most efficient illumination protocol.
2 METHODS
2.1 Embedded System
A major design consideration in the development of
this particular embedded system was the outlook for
development towards a thin, flexible, implantable de-
vice. To facilitate this, the number of components had
to be minimised and the components had to be avail-
able in the smallest packaging factor, i.e. as bare dies
for the Integrated Circuits (IC’s) which was a major
limitation in component selection.
Additionally, to ensure a seamless interface within
the existing recording set-up and allow usage as a
more general purpose responsive neuromodulation
system, both hard- and software were designed with
ample connectors and possibilities to modify the sys-
tem depending on a given experiment. The embedded
system takes the amplified and filtered EEG signals
as input and generates an output signal used to drive
a stimulation system. The embedded system gener-
ates output signals which are recorded together with
the EEG-signals to allow monitoring of the function-
ing of the responsive neuromodulation system and ob-
tain a synchronised recording of both. The integration
of the embedded system within the electrophysiology
set-up is illustrated in Figure 1A.
2.1.1 Hardware
The embedded system is based upon designs found
in literature and designed around a low-power micro-
controller unit (MCU) of the MSP430-family from
Texas Instruments (Pederson et al., 2019; Shon et al.,
2017). Besides the microcontroller and the required
components for the programming circuitry, there are
voltage regulators present which convert a single sup-
ply voltage into a double supply rail and generate
3.3 V as required by the MCU. Incoming signals pass
through a voltage offset circuit of 1.65 V to offset the
incoming signals and to ensure they are within the
Analog-to-Digital Converter (ADC) input range, as
shown in Figure 1B. On the output side, two Digital-
to-Analog Converters (DAC’s) are used. The first is
used to transmit the metric used for the responsive
neuromodulation to use as feedback on how the em-
bedded system is performing. The second DAC is
used to control the stimulation parameters. Using a
switch, a choice can be made between voltage and
current pulses. Voltage pulses are generated using a
negative offset and an amplifier as shown in Figure
1C. These can be used for direct stimulation or used
as a trigger for an external stimulation source, e.g. a
laser or Light Emitting Diode (LED) driver.
Embedded System for Responsive Optogenetic Control of Spontaneous Seizures in a Preclinical Temporal Lobe Epilepsy Model
89
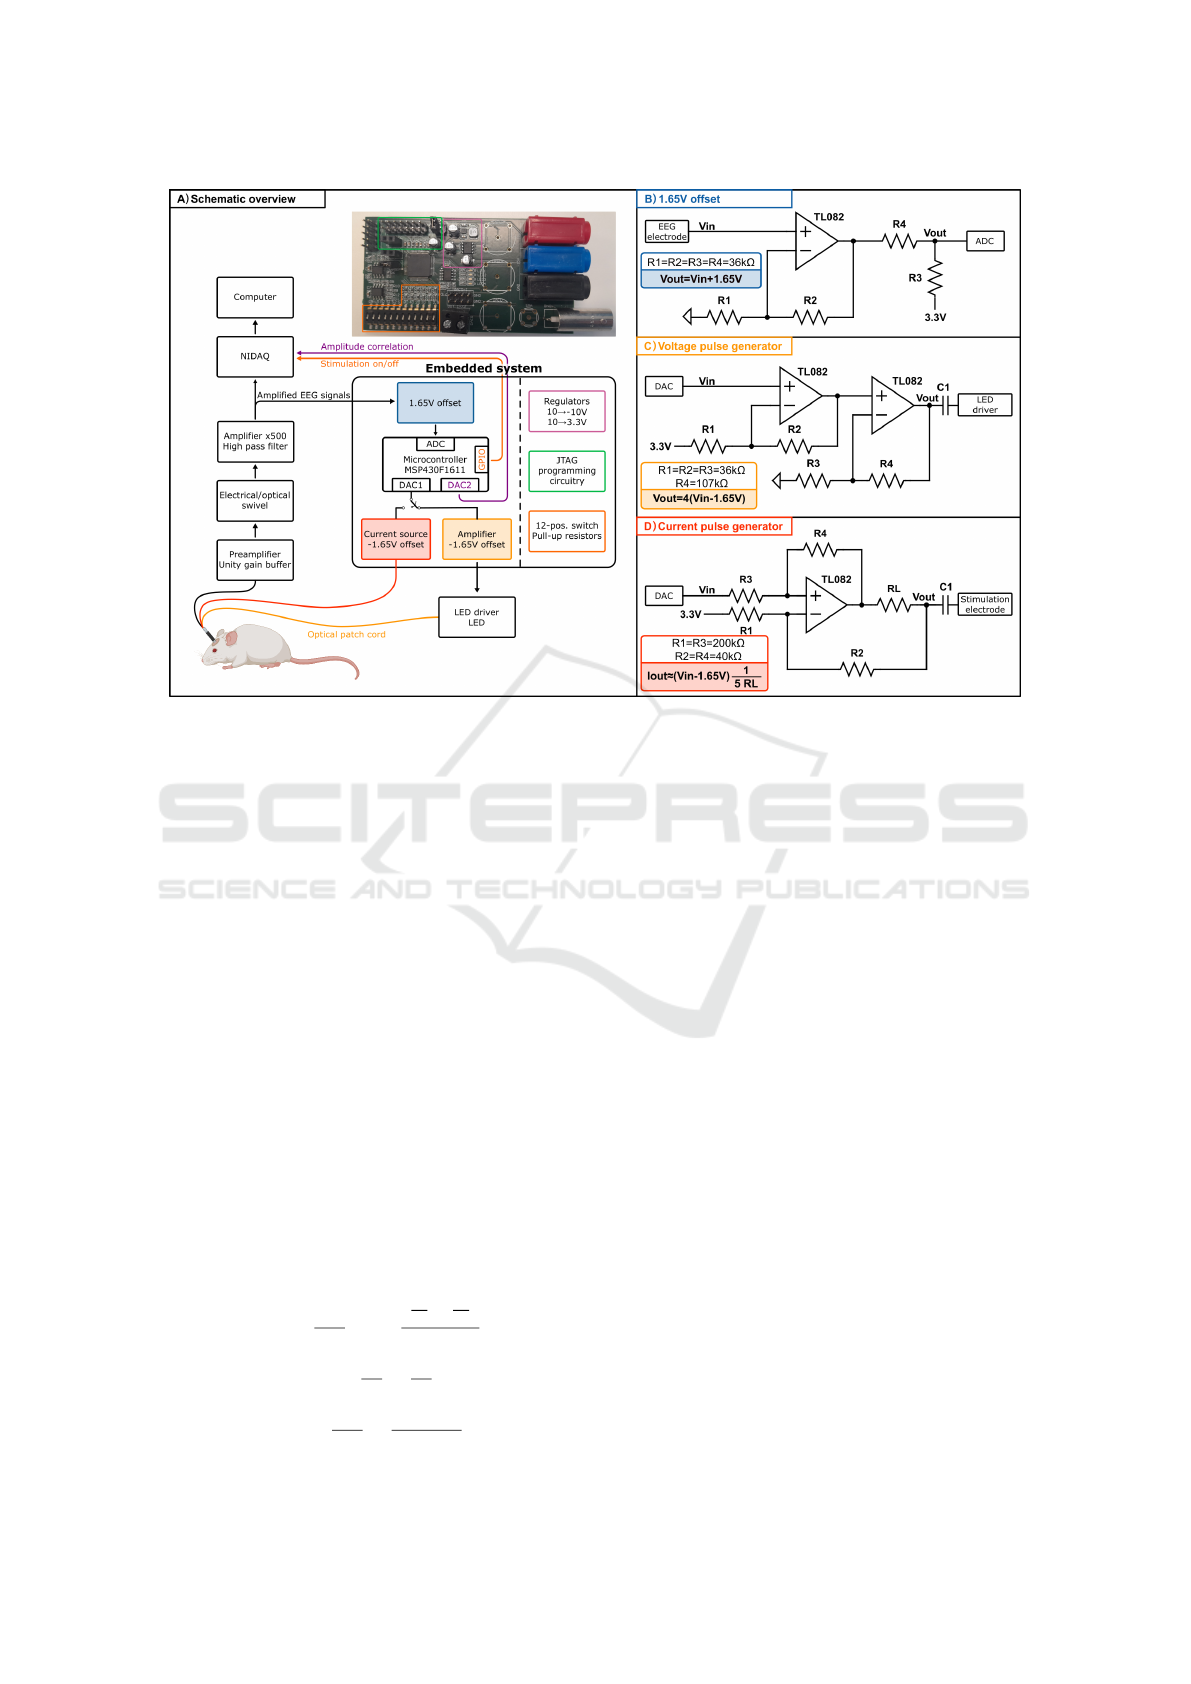
Figure 1: A: Schematic overview of electrophysiology set-up and integration of embedded system within. Build-up of em-
bedded system and picture of realisation. NIDAQ: National Instruments Digital Acquisition Device. B: 1.65 V voltage offset
circuit. C: Voltage pulse generator circuit including -1.65 V offset. D: Howland current source including -1.65 V offset.
Current pulses are generated using a Howland cur-
rent source as shown in Figure 1D (Pederson et al.,
2019; Instruments, 2008). The circuit delivers an out-
put current as shown in Equation 1 where the second
factor is negligible if the R
1
/R
2
= R
3
/R
4
= k. Using
the resistor R
L
, the maximal stimulation current can
be dimensioned but a trade-off must be found between
the range of the output current and the resistance
of the stimulation electrode since they are related as
shown in Equation 2. For a stimulation electrode re-
sistance R
electrode
of 10 kΩ and an opamp supply rail
of 10 V, which results in an opamp output swing and
thus V
out
of 8 V, the output current will be limited to
800 µA. V
in
is limited to +/-1.65 V corresponding to
the output of the MCU DAC after the -1.65 V off-
set which means R
L
will be dimensioned at 825 Ω for
R
1
= R
3
= 200kΩ and R
2
= R
4
= 40kΩ. When di-
mensioning for increasing resistances of the stimula-
tion electrode, R
L
will have to be increased and the
maximal output current will decrease. Increasing the
voltage supply rails can mitigate this trade-off (Instru-
ments, 2008).
I
out
= V
in
1
kR
L
+V
out
(
R
4
R
3
−
R
2
R
1
)
R
2
(1)
with k =
R
1
R
2
=
R
3
R
4
I
out
= V
in
1
kR
L
=
V
out
R
electrode
(2)
A pin header is used to connect an MSP MCU pro-
gramming and debugging probe (MSP-FET, Texas In-
struments, Texas, USA) to reprogram the MCU. Pin
headers, as well as BNC-connectors can be used to
connect incoming and outgoing signals
2.1.2 Seizure Detection Algorithm
Considering the computational limitations of the
MSP430F1611 microcontroller, a relatively simple
yet robust seizure detection algorithm is needed.
Seizures in the IHKA mouse model are characterised
by high frequency spiking activity observed in in-
tracranial EEG-signals, which can be detected using
peak detection. However, as this is computation-
ally expensive, an alternative metric called Amplitude
Correlation (AC) is used as described in literature
(Krook-Magnuson et al., 2013; White et al., 2006).
The amplitude correlation metric is based upon
the use of the signal range in a window with e.g. a
length of 120ms. For each window, the overlap of
the signal range is calculated with respect to those of
the previous N windows. In other words, the ampli-
tude correlation will only be high if the signal range
in the current window is high and similar to the range
in previous window(s), hence the term ”correlation”,
which is illustrated in Figure 2 for a window size of
1 s. As seizures are characterised by a prolonged pe-
riod (≥5 s) of high frequency spiking (Zeidler et al.,
BIODEVICES 2025 - 18th International Conference on Biomedical Electronics and Devices
90

Figure 2: The amplitude correlation (AC) is calculated as
the overlap of the signal range in current window S
n
with
the previous N windows, here illustrated for a window size
of 1 s.
2018), a summation of the amplitude correlation is in-
troduced to avoid a response to brief periods of spik-
ing activity which would be considered a false posi-
tive. High frequency spiking activity for a prolonged
period will increase the summed amplitude correla-
tion and based on a threshold crossing, a seizure de-
tection is initiated. Mathematically, this is expressed
as the following formulas with S representing a win-
dow:
Amplitude correlation AC(S
n
) = (3)
min[max(S
n
),max(max(S
n−1
),max(S
n−2
))]−
max[min(S
n
),min(min(S
n−1
),min(S
n−2
))]
AC
summed,n
=
1
n
sum
n
sum
∑
i=1
AC
n−i
(4)
The amplitude correlation can be tuned by mod-
ifying (1) the window size, (2) the number of win-
dows to calculate the amplitude correlation with and
(3) the number of windows to consider in the summa-
tion. The window size and the number of windows
used to calculate the amplitude correlation affect the
minimal epileptic peak frequency needed for detec-
tion. With windows of 120 ms and 3 windows to con-
sider as used by Krook-Magnuson et al., the spiking
frequency has to be at least 5.5 Hz to have an impact
on the amplitude correlation as seen in Equation 5
(Krook-Magnuson et al., 2013). In the IHKA mouse
model, a minimum spiking frequency of 2 Hz is typi-
cally used to classify seizures (Zeidler et al., 2018) so
the amplitude correlation settings are modified to use
6 windows instead of 3 (including the current win-
dow). Modifying the number of windows included in
the summation affects the minimal required duration
of spiking activity and is set to 42 to correspond to a
period with spiking activity with a minimal duration
of 5 s. With these settings, a seizure with repetitive
spiking of 2 Hz will be detected within approximately
5 s and a seizure with a higher frequency will be de-
tected faster in about 2 s as more windows will have a
high AC.
Spiking f req. =
2 spikes
3 windows · 120ms
= 5.5Hz (5)
2.1.3 Software Implementation
The implementation of the previously described al-
gorithm is relatively simple but becomes increasingly
complex with the inclusion of various features to fa-
cilitate neuromodulation experiments as it must in-
clude the following options: (1) change the detec-
tion/stimulation parameters for each detection, (2) en-
able randomisation of sequence of various elements,
(3) disable stimulation after a set amount of time, (4)
re-enable stimulation with another set of elements and
(5) the option to configure settings during an ongoing
recording.
The incoming EEG-signals are recorded per win-
dow with a duration of 120ms, during which the cur-
rent minimum and maximum are stored. Upon finish-
ing the window, a flag is set to initiate the calculation
of the amplitude correlation. If this is above the ”up”
threshold, an element is started, which can be either a
detection or a stimulation element. A stimulation ele-
ment consists of a pulse train with a certain amplitude,
pulse duration, pulse frequency, stimulation duration
as well as an additional flag which can be used for
special settings, e.g. reduction of pulse duration after
X seconds. An element is only considered as ”fin-
ished” when the amplitude correlation drops below a
”down” threshold to ensure a seizure is fully finished
prior to starting a new element. The elements are de-
fined within a parameter set which specifies the num-
ber of elements and their parameters. As the sequence
of the elements could have a confounding effect on
the results, the sequence is randomised before the ex-
ecution of each series of elements. Finally, there is the
option to customise parameters using a 12-position
switch. The MCU periodically checks the settings
of this switch and adjusts the parameters accordingly.
The exact changes are experiment-dependent and pre-
programmed prior to each experiment.
The software is written in C in Code Composer
Studio (Texas Instruments, Dallas, Texas, USA) and
programmed onto the microcontroller using the MSP-
FET debugging probe (Texas Instruments, Dallas,
Texas, USA). The structure of the software is based
around a simple main-loop and extensive use of in-
terrupts as most of the actions are time-dependent.
Two timers are used, both derived from the Mi-
crocontroller Unit (MCU) clock. The first timer is
configured with a higher clock frequency as it will
control the timing of the ADC (sampling frequency
2kHz) and the stimulation pulses (switching speed
up to 1 kHz). The second timer uses a lower clock
frequency for the long term timing (range seconds-
minutes) to control long-term changes between pa-
rameter sets. An ADC interrupt will control digiti-
sation of the incoming signals. The maximum clock
Embedded System for Responsive Optogenetic Control of Spontaneous Seizures in a Preclinical Temporal Lobe Epilepsy Model
91

frequency of the MCU is 4.9 MHz so allows for pulses
down to 0.2 µs which is sufficient for most stimula-
tion protocols as optical stimulation usually employs
pulses ≥0.5 ms and current pulses for evoked poten-
tials use segments of 200 µs.
2.2 Responsive Seizure Suppression in
the IHKA Mouse Model
2.2.1 Surgical Interventions
All experiments were conducted with male C57Bl/6J
mice (n=12, Janvier, The Netherlands) acquired at
an age of 7 weeks. Animals were treated according
to the European guidelines (directive 2010/63/EU).
All experiments described in the following were ap-
proved by the Animal Experimental Ethical Commit-
tee of Ghent University (ECD 22-39) and complied
with the ARRIVE guidelines. Mice were housed
under environmentally controlled conditions (humid-
ity: 40–60 %, temperature: 20–23 °C), a controlled
12 h/12 h light/dark cycle and with ad libitum access
to food and water.
For the injections and implantations, the animals
were secured in a stereotactic frame (Neurostar Robot
Stereotaxic system, Neurostar, Tubingen, Germany)
using ear bars and brought under anaesthesia, isoflu-
rane (induction 5 %, maintenance 2 %) and medi-
cal O2 (induction 1 l/min, maintenance 0.8 l/min).
Injection of 50 nl kainic acid (200 ng kainic acid
in 50 nl saline) was done to induce status epilepti-
cus with a flow rate of 250 nl/min (Nanoliter 2020,
WPI, Florida, United States) at the stereotactic coor-
dinates AP-2.0 mm relative to bregma; ML+1.5 mm
relative to bregma; DV-1.8 mm relative to dura
(Desloovere et al., 2021). Three weeks thereafter,
1000 nl of the pAAV2/9.hsyn-WiChR1-ts-mScarlet-
er-WPREneu viral vector (titer 8.47E+12 VG/ml) was
injected with a flow rate of 100 nl/min at the same
location. After 2 weeks, the optrode was implanted
at the same location with a depth of DV-1.8 mm rel-
ative to dura. The optrode consisted of a bipolar
depth electrode formed by twisting polyimide-coated
stainless steel wires (ø70 µm, California Fine Wire,
USA) and assembling these with an implantable op-
tical fibre (ø400 µm, length 5 mm, 1.25 mm ferrule,
CFMLC14L05, Thorlabs, Germany) with the elec-
trode tips extending 300 µm beyond the tip of the
optical fibre. An epidural screw electrode (stainless
steel, ø1.57 mm, Bilaney Consultants, Germany) was
placed contralaterally as ground/reference electrode.
After a week of recovery, the recording period was
started.
2.2.2 Electrophysiology
For EEG recording, the implanted electrodes were
referenced to stainless steel microscrew placed on
the contralateral side. The electrode leads and opti-
cal patch cord were connected to an electro-optical
swivel to allow free movement of the animals. These
signals were filtered with a 2nd order high pass fil-
ter at 0.159 Hz and amplified by a factor of 500 prior
to digitisation with a USB-6259 National Instruments
Data Acquisition device (NIDAQ) (National Instru-
ments, Austin, Texas, USA) which stored the ac-
quired data locally on a computer for offline analy-
sis. The digitisation had an accuracy of 16-bits over
a range of +/-10 V and thus has a resolution of +/-
305 µV, which means the resolution on the original
(non-amplified) signals was +/-305 µV / 500 = +/-
0.61 µV.
The outgoing signals from the embedded system
were digitised by the same USB-6259 National In-
struments data acquisition device, namely the ampli-
tude correlation used to detect the seizures and the
signal from a General Purpose Input Output (GPIO)-
pin, which corresponded to the detection/stimulation
action of the microcontroller as shown in Figure 1A.
In case of a seizure detection without stimulation, the
GPIO-pin was set to high during the detection. In case
of stimulation, the GPIO-pin was set to high/low in
accordance with the actual stimulation pulses that are
given.
The output of the responsive neuromodulation
system was a 5 V-pulse which connected to an LED
driver (T-Cube™LED driver, Thorlabs, Germany) via
a BNC cable, driving a 470 nm fiber-coupled LED
(M470F4 & M470F3, Thorlabs, Germany). This LED
was coupled to a rotary joint patch cord (ø400 µm,
NA 0.39, ceramic ferrule ø1.25 mm, RJPSL4, Thor-
labs, Germany), which coupled to the implanted optic
fibre cannula with a ceramic sleeve (ADAL1, Thor-
labs, Germany). As relatively short pulses were used,
the accuracy had to be verified by measuring the op-
tical output power at the ferrule of the patch cord us-
ing a photometer (PM400, Thorlabs, Germany) prior
to implantation as shown in Figure 3. There was a
small delay at the on- and offset of the pulses but
the difference between the ideal and actual pulse was
small enough to be considered irrelevant for this ex-
periment.
2.2.3 Recording Protocol
The animals were attached to the recording set-up
non-stop for 6 days to minimise risks associated with
disconnecting and reconnecting the animals and the
associated risk of inter-day variability caused by a
BIODEVICES 2025 - 18th International Conference on Biomedical Electronics and Devices
92
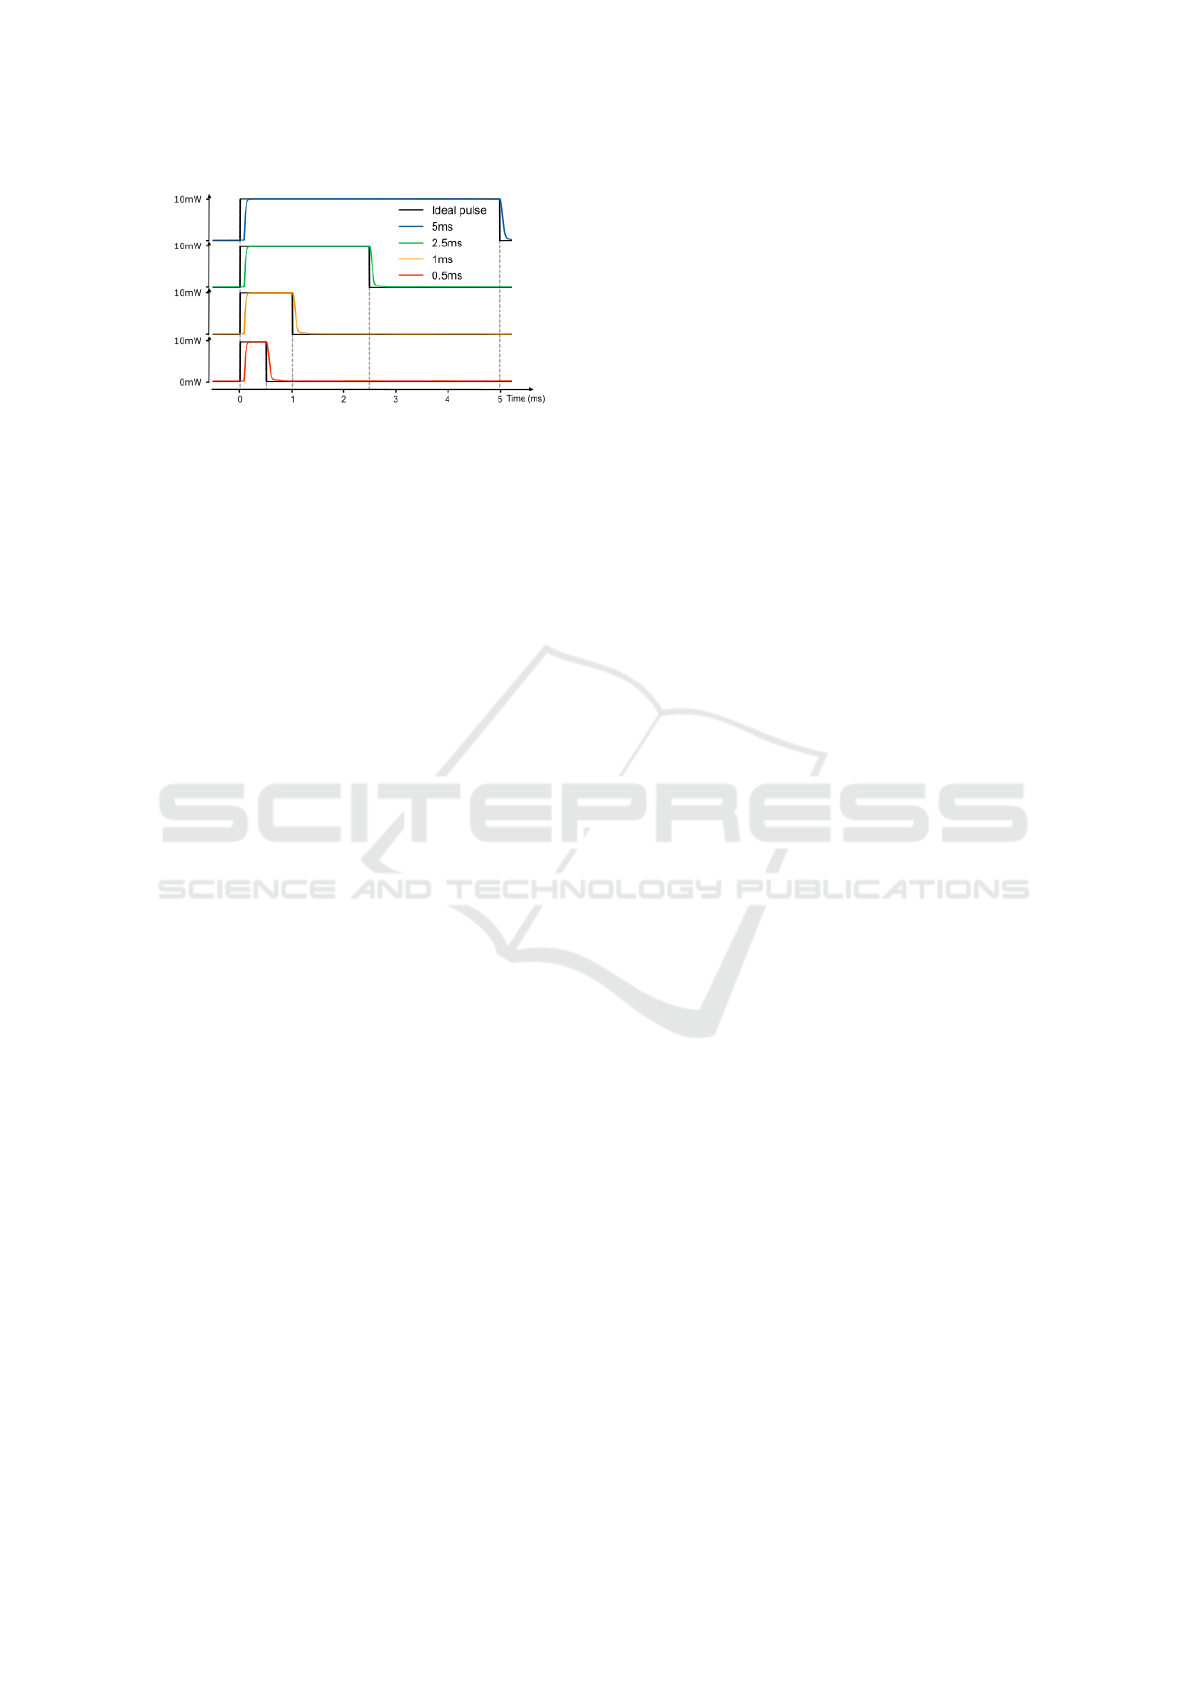
Figure 3: Measurement of optical output power of stimula-
tion pulses of varying duration (0.5, 1, 2.5, 5) ms using T-
Cube LED driver and M470F4 LED (Thorlabs, Germany)
compared to target pulse.
varying coupling quality. Freedom of movement of
the animals was enabled by the use of the rotary patch
cord and electrical swivel.
In each stimulation day, a comparison between
a maximum of 6 parameters was made with the ad-
dition of 2 detection elements for reference. In the
IHKA mouse model, animals usually have a seizure
rate of 16 seizures/hour (Zeidler et al., 2018). During
an 8-hour recording, the occurrence of 160 seizures
could be expected which would result in 20 samples
of (non-)suppressed seizures for each stimulation el-
ement, providing sufficient data to perform the re-
quired statistics. After 8 hours of responsive seizure
suppression, the system switches to seizure detection
only for 16 hours to negate potential long-term effects
of the illumination. The elements within a stimula-
tion day occurred in a randomised order to eliminate
the potential confounding effects of the stimulation
elements on each other. The elements were sampled
without repetition to ensure the same rate of occur-
rence for each element.
For the detection parameters, a detection thresh-
old for the amplitude correlation of 1.11 mV was cho-
sen as a baseline to provide a good balance between
detection speed and avoidance of false positives. Re-
ducing the detection threshold avoids false negatives
but provides difficulties with analysis as it would be
unclear whether the seizure was suppressed or there
would not have been a seizure in the first place. The
”down” threshold to consider a seizure was finished
was set as the detection threshold minus 0.32 mV.
The starting point for the stimulation parameters
were based on those indicated in the original WiChR
publication by Vierock et al. (Vierock et al., 2022):
(1) a wavelength of 473 nm, (2) a pulse frequency
of 10 Hz and (3) a pulse duration of 5 ms. For the
stimulation power, 10 mW was chosen to ensure suf-
ficient illumination of the hippocampus, as measured
at the ferrule of the rotary patch cord. After coupling
into the implanted fibre, a loss of 11.6+/-4.1 % was
measured before implantation resulting in a mean out-
put power of 8.8 mW at the tip of the implanted fibre
(not accounting for the influence of scar tissue forma-
tion due to the implantation). In combination with a
maximum duty cycle of 20 %, these settings provide
no concern for tissue heating as this would be lim-
ited to 1 °C according to simulations by Acharya et al
(Acharya et al., 2021). The stimulation duration was
fixed at 90 s, corresponding to the 99 % percentile of
seizure duration seen in the IHKA mouse model to en-
sure the entire seizure was suppressed (Zeidler et al.,
2018).
The parameters of interest to vary during this
study were the pulse frequency and pulse duration as
indicated by early parameter explorations and single
neuron simulations by Weyn et al. which showed that
an increased pulse frequency increases the inihibitory
effect while maintaining the duty cycle (Weyn et al.,
2024). To study these parameters, a recording pro-
tocol was established as illustrated in Figure 4. The
first day served to validate the autonomous seizure
detection. In the following 4 days, the pulse duration
was varied with each detection in the range 1, 2, 3,
4, 5 and 6 ms for four different detection thresholds:
1.11, 1.03, 0.95 and 0.87 mV as the speed of detec-
tion was hypothesised to affect the minimal effective
pulse duration. For day 2, the highest pulse duration
that did not work (T
suppression
) was extracted as the
lowest pulse duration resulting in a significant reduc-
tion in seizure duration (Welch’s t-test, p<0.05) and
resulting in a seizure duration reduction of ≥75 %.
On day 6, both the pulse duration and frequency
were varied. The effective pulse duration T
suppression
was repeated along with T
suppression
/2 to validate the
(non)-effectiveness. Based on T
suppression
, the pulse
frequency was multiplied with a factor x2.5 and x5,
adjusting the pulse duration to maintain the duty cy-
cle. Finally, an element is tested where the stimu-
lation quantity is reduced after 5 s by decreasing the
pulse duration with a factor 1/2 to verify whether the
suppressive effect can be maintained with reduced
stimulation after the initial suppression. An example
of these variations with T
suppression
of 5 ms is illus-
trated in Figure 4.
2.2.4 Immunohistochemistry
Immunohistochemistry, a technique using antibod-
ies to visualise proteins in tissue, was performed to
analyse the hippocampal structure and the expres-
sion of the WiChR opsin. The protocol as previ-
ously described, (Desloovere et al., 2021), was fol-
lowed, with different antibodies to stain for microglia
(Iba-1) and RFP (Red Fluorescent Report protein), the
tag attached to the WiChR opsin. For Iba-1, rab-
Embedded System for Responsive Optogenetic Control of Spontaneous Seizures in a Preclinical Temporal Lobe Epilepsy Model
93
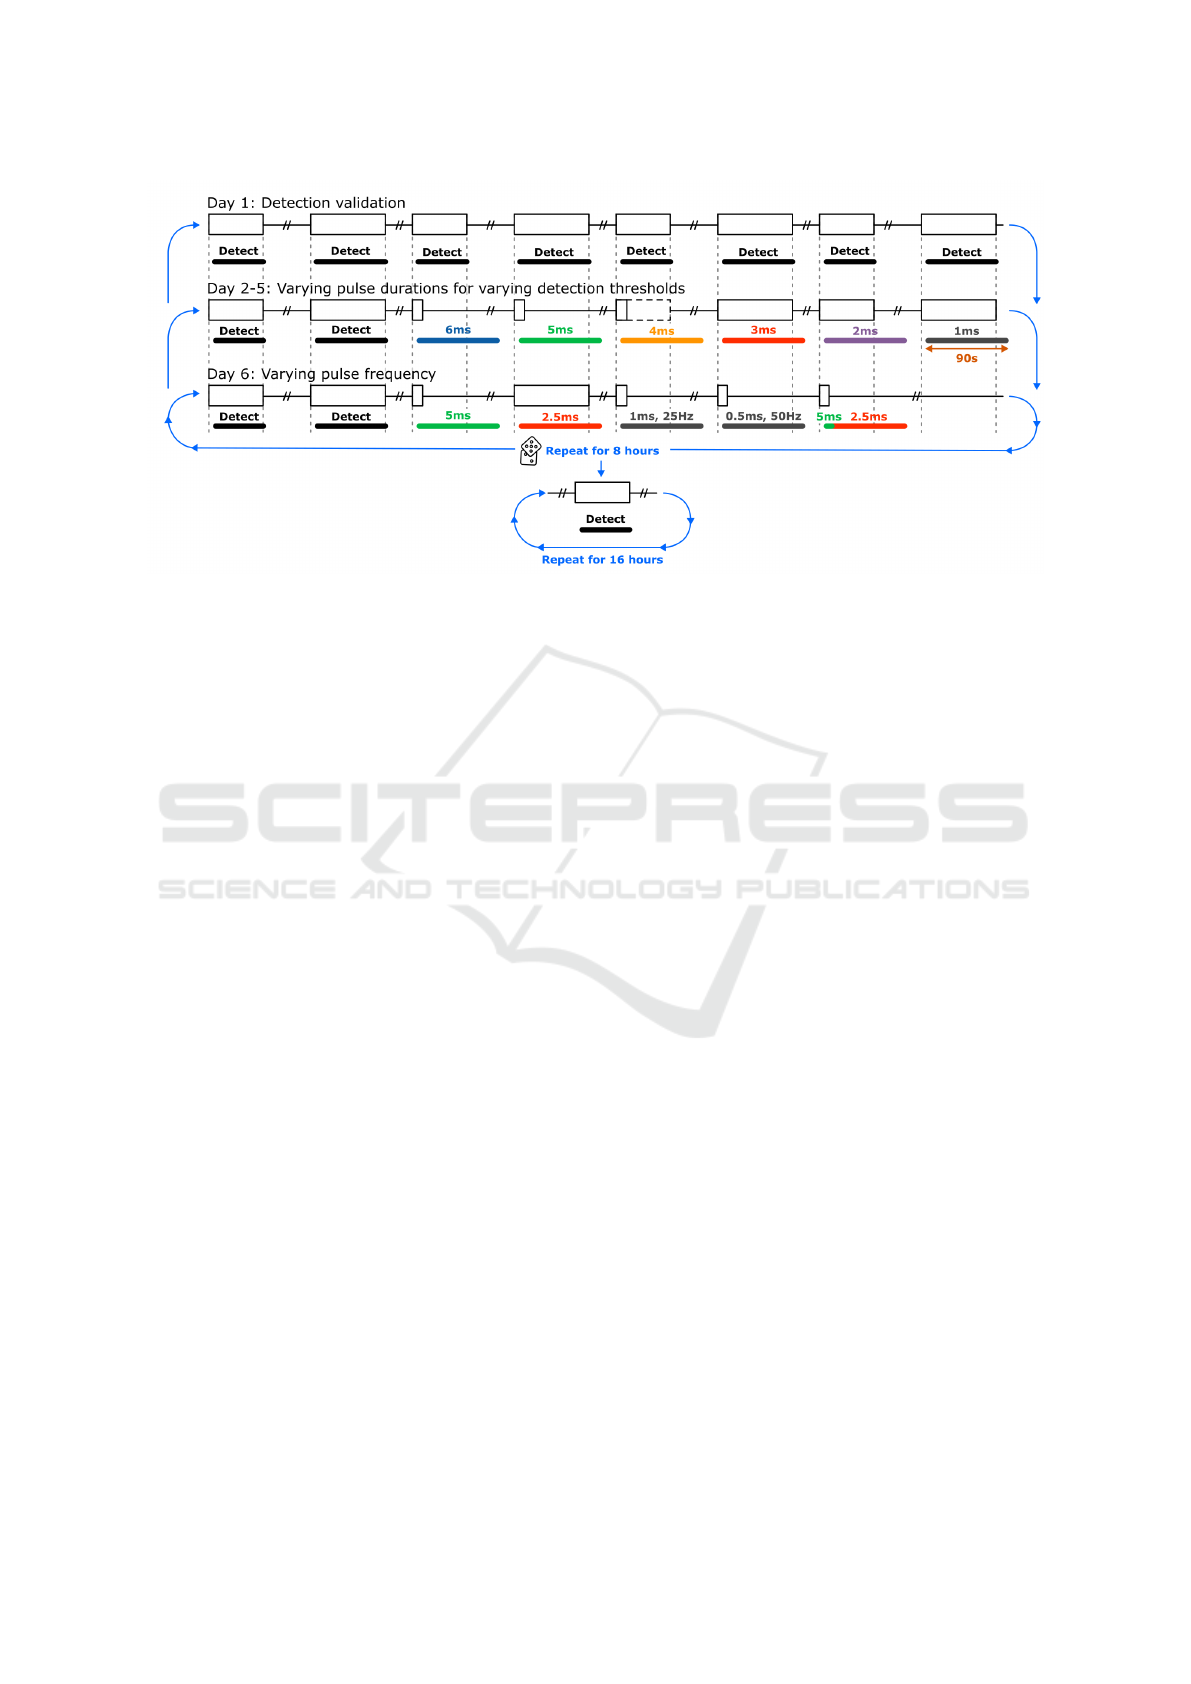
Figure 4: Schematic of recording protocol to evaluate influence of illumination parameters where each block represents a
(suppressed) seizure. Unless specified otherwise, illumination is done with a power of 10 mW, a pulse frequency of 10 Hz and
a stimulation duration of 90 s. The elements within a day are randomised within each repetition. After 8 hours of responsive
stimulation, the protocol switches to detection only for at least 16 hours.
bit anti Iba1 (Abcam Limited, Cambridge, United
Kingdom, 1:1000) was used as the primary anti-
body and goat anti-rabbit 488 nm (Novus Biologi-
cals, Abingdon, United Kingdom, 1:1000) as the sec-
ondary antibody. Staining for RFP was performed
using chicken anti-RFP (Thermo Fisher Scientific,
Massachusetts, United States, 1:1000) as the primary
antibody and goat anti-chicken 594 nm as the sec-
ondary antibody (Abcam Limited, Cambridge, United
Kingdom, 1:1000). Slides were scanned with a flu-
orescent microscope (Panoramic 250, 3D Histech,
40×magnification) and automatically stitched.
2.2.5 Data Analysis
All data was manually annotated in a blind manner
(i.e. by only viewing the animal’s EEG signals with-
out the signals from the responsive neuromodulation
system). A seizure was quantified as repetitive spik-
ing with a minimum spiking frequency of 2 Hz and a
minimum duration of 7 s. A seizure was considered
finished if followed by a period of 7 s without any
spikes. Low frequency spiking activity which gen-
erally precedes a seizure was not annotated as part
of the seizure. To quantify the detection quality, the
manual and automatic annotations obtained from day
1 in the recording protocol (Figure 4) are compared
by calculating the percentage of correspondence, the
sensitivity and specificity.
Seizures with optogenetic inhibition were anno-
tated as described before if possible with the fol-
lowing considerations: (1) lower amplitude repetitive
spiking during the stimulation was considered to be
part of the same seizure as it is an indication that the
seizure is only partially suppressed and (2) high fre-
quency spiking activity during stimulation ≥5 s after
the original seizure ended, with duration ≥5 s were
annotated as a new seizure.
For each recording day, there were a number
of samples for each set of parameters within that
day. These were compared within an animal to ver-
ify whether they were significantly different using
Welch’s t-test (p ≤0.05 to reject null-hypothesis) as
the variances proved unequal according to Levene’s
variance test (p≤0.05). To mitigate the influence of
the detection speed on the results, the time to detec-
tion was subtracted from the seizure duration. As a
consequence, the output metric would be more accu-
rately called the ”seizure duration after stimulation”
but the term ”seizure duration” will be used for con-
ciseness.
3 RESULTS
Of the initial 12 mice, only 2 showed the sponta-
neous seizures as expected in the IHKA mouse model,
coded SL038 and SL040, and could be used to anal-
yse the seizure detection and consequent optogenetic
seizure suppression. This sample size is too small for
inter-animal analysis and statistics so all following re-
sults remain limited to a comparison within each ani-
mal.
BIODEVICES 2025 - 18th International Conference on Biomedical Electronics and Devices
94
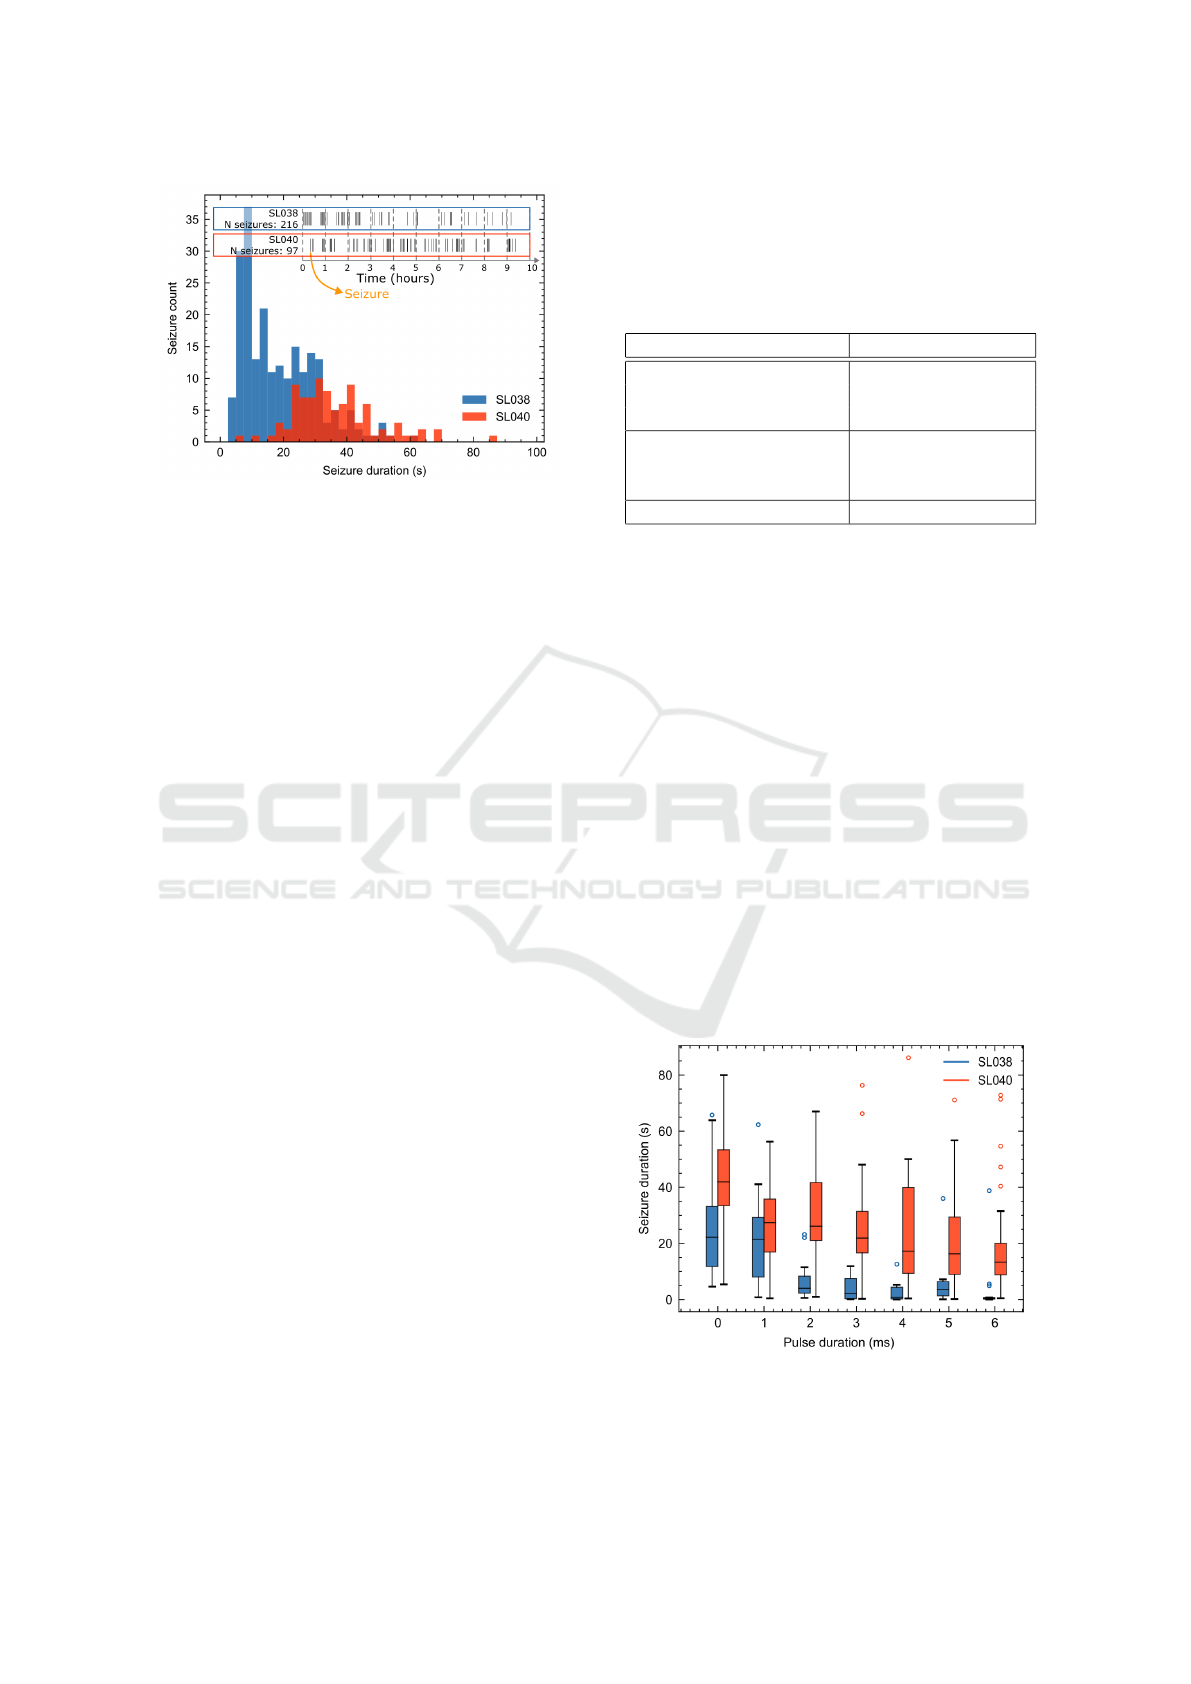
Figure 5: Comparison of seizure characteristics between
SL038 and SL040 with histograms of seizure duration and
a timeline displaying the occurrence of seizures across the
10 hour recording.
3.1 Seizure Detection
Firstly, a comparison was made between the online
calculation of the amplitude correlation by the MCU
and an offline calculation performed in Python using
the same settings for the computation to validate the
online calculation by the embedded system. For a
1-hour recording, this showed a correlation between
the online and offline correlation with a Pearson R²
of 97.5 % and a mean error of 0.82 µV, illustrating a
strong correspondance between the online and offline
calculations.
Table 1 shows the results of the autonomous
seizure detection of these two animals. A clear dif-
ference can be seen between the two animals under
consideration, SL038 and SL040, which can be at-
tributed to a difference observed between the charac-
teristics of the spontaneous seizures as illustrated in
Figure 5. SL038 shows a high number of seizures
>20 seizures/hour with a relatively short duration.
Figure 7A shows a representative EEG-trace with
these repetitive occurrences of high frequency spiking
activity which fall just around the criteria to be classi-
fied as seizures. The seizure detection algorithm was
tuned to respond to activity longer than 5 s so encoun-
ters difficulties annotating these short seizures with a
duration between 5-10 s, leading to a relatively low
sensitivity of 42.5 %. Despite this, the seizure detec-
tion algorithm achieved an accuracy of 91.3 % and a
specificity of 98.0 %.
SL040 displays longer and less frequency sponta-
neous seizures with an average duration 36.5 s and a
rate of almost 10 seizures/hour (Zeidler et al., 2018).
These were easier to detect automatically, which is re-
flected in the increased accuracy (97.8 %), sensitivity
(85.8 %) and specificity (99.0 %) compared to SL038.
For both animals, the optimisation towards the avoid-
ance of false positives is reflected in a higher speci-
ficity compared to the sensitivity.
Table 1: Results of autonomous seizure detection using the
amplitude correlation metric and a detection threshold of
1.11 mV.
SL038 SL040
Nr of seizures 216 97
Mean seizure duration 19.3 s 36.5 s
Standard deviation +/-11.6 s +/-13.2 s
Accuracy 91.3 % 97.8 %
Sensitivity 42.5 % 85.8 %
Specificity 98.0 % 99.0 %
Median time to detection 5.4 s 4.0 s
3.2 Seizure Suppression
Figure 7A-B shows EEG traces for SL038 and SL040
showing representative examples of spontaneously
occurring and suppressed seizures. For SL038, an
immediate suppression can be seen without the occur-
rence of spiking activity during the stimulation period
for a pulse duration of 5ms. For SL040, the effect
of the illumination does not lead to complete seizure
suppression as shown by a comparison of the resulting
seizure duration in Figure 6. The reduction in seizure
duration for 5ms pulses is 51.6 %, which is below the
target of 75 %. Therefore, the protocol in Figure 4
was modified for SL040 to use a pulse duration of 2.5,
5, 7.5, 10, 15 and 20 ms instead of the original 1, 2, 3,
4, 5 and 6 ms. The difference in effect between SL038
and SL040 could be linked to the differences seen in
the characteristics of their spontaneous seizurs.
Figure 7C-D shows a detailed image of the ef-
fect of the illumination on the seizure duration, illus-
Figure 6: Comparison of resulting seizure duration for
a varying stimulation pulse duration between SL038 and
SL040.
Embedded System for Responsive Optogenetic Control of Spontaneous Seizures in a Preclinical Temporal Lobe Epilepsy Model
95
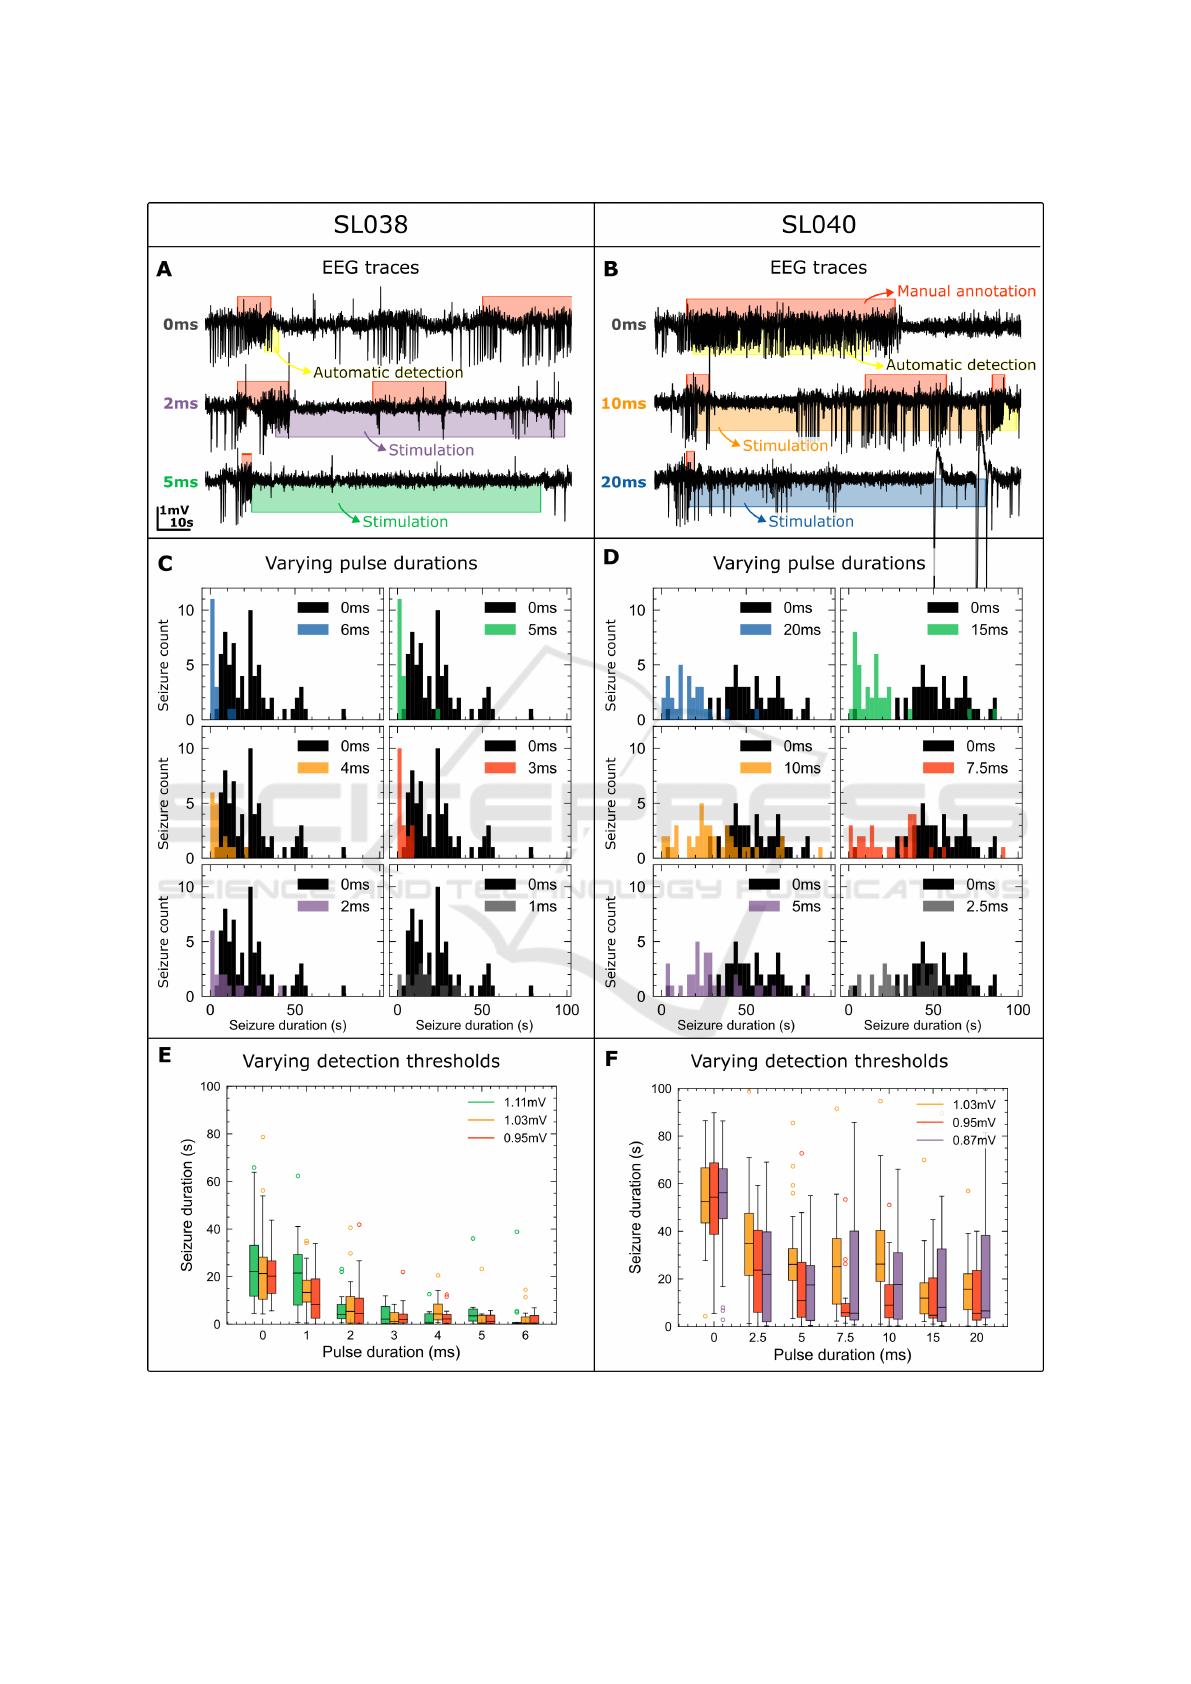
Figure 7: A-B: Typical seizures and effect of 10 Hz illumination with insufficient and sufficient pulse duration for SL038 and
SL040. C-D: Histograms of resulting seizure duration for a varying pulse duration for SL038 and SL040. E-F: Box plot of
resulting seizure duration for various detection thresholds for SL038 and SL040.
BIODEVICES 2025 - 18th International Conference on Biomedical Electronics and Devices
96
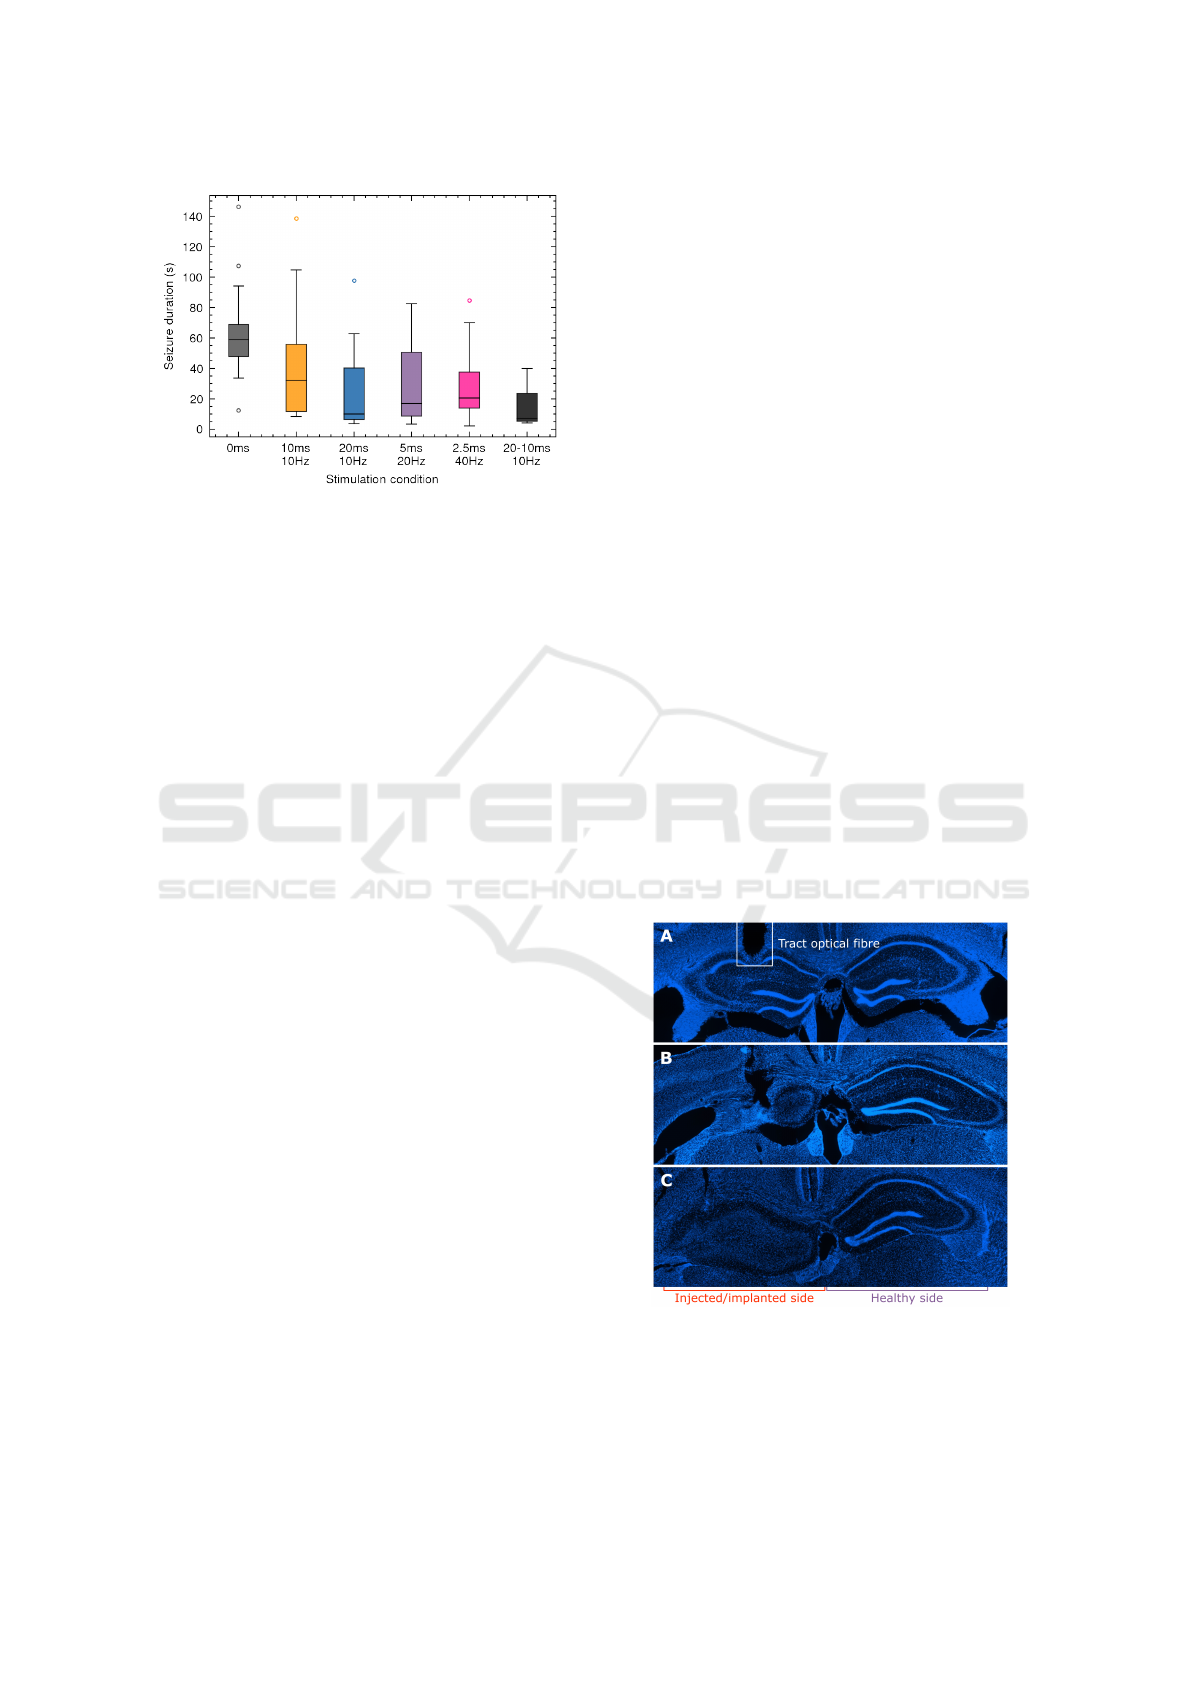
Figure 8: Box plot of reduction in seizure duration for
various combinations of pulse duration and frequency for
SL040.
trating the inter seizure variability, especially for the
shorter pulses and especially for SL040. For SL038,
every pulse duration ≥2ms has a significant effect
(p≤0.0001) and pulses ≥5 ms result in a mean result-
ing seizure duration of 3.5 s, or a reduction of 85.5 %
compared to no stimulation which indicates a com-
plete, immediate suppression and was hence selected
as the T
suppression
pulse duration. The same analy-
sis is performed for SL040 and shows a significant
difference between the unstimulated and stimulated
seizures (p≤0.0001) for each pulse duration. How-
ever, only a pulse duration ≥15 ms achieves a reduc-
tion in seizure duration ≥70 % and therefore, 20 ms
was chosen as T
suppression
pulse duration to ensure suf-
ficient suppression.
A comparison of the stimulation effect between
the various thresholds can be seen in Figure 7E-F and
shows no significant difference in the effect on the
seizure between the varying thresholds (p>0.05). A
threshold of 1.11 mV is not included in the analysis
for SL040 as only 14 seizures occurred during these
8 hours of responsive neuromodulation, resulting in
insufficient data quantity for an accurate comparison.
The analysis of stimulation day 6 with varying
pulse duration and frequency could only be performed
for SL040 due to a loss of signal in SL038, likely
cause by a displacement of the depth electrode. For
SL040 there is a significant difference between un-
stimulated and stimulated seizures (p≤0.05) but no
significant difference between the various stimulation
settings (p>0.05) as illustrated in Figure 8. This re-
sult is questionable however as these results were only
obtained for a single animal, which showed a reduced
stimulation effect compared to SL038 so this must be
considered as an initial observation. Additional data
is required from multiple animals to attain a decisive
conclusion, especially considering the evident inter-
animal variability in seizure characteristics.
3.3 Immunohistochemistry
Of the original 12 mice, only 2 showed spontaneous
seizures which is below expectation as the IHKA
mouse model is generally very reliable (Zeidler et al.,
2018). An explanation had to be found to ensure
the safety of the embedded system and this could
be found in the results of the immunohistochem-
istry. Initial analysis of these images shows that from
the 10 animals without spontaneous seizures, 4 have
either no hippocampal lesion or show very limited
degradation of the neuronal cell layers in the dentate
gyrus, illustrated in Figure 9A, which explains the
lack of spontaneous seizures. The remaining 6 ani-
mals showed a severe hippocampal lesion where the
injected side was almost entirely degraded as shown
in Figure 9B, again providing a different but suitable
explanation for the lack of spontaneous seizures. Fig-
ure 9C shows the histology of SL040 exhibiting a
hippocampal lesion as expected in the IHKA mouse
model. None of the histology images showed any in-
dications there might have been an issue with the em-
bedded system, which could be seen as e.g. a corti-
cal lesion caused by an unwanted electrical pulse sent
through the electrodes
The inter-animal variability within this experi-
ment could be attributed to a variety of explanations
(or a combination thereof) which will be investigated
further, including (1) a potential issue with the injec-
Figure 9: Immunohistochemistry images of DAPI staining
in transversal plane around injection/implantation location.
A: Example of animal without seizures with minimal hip-
pocampal lesion. B: Example of animal without seizures
with major hippocampal damage. C: Example of animal
with seizures and typical kainic acid lesion.
Embedded System for Responsive Optogenetic Control of Spontaneous Seizures in a Preclinical Temporal Lobe Epilepsy Model
97
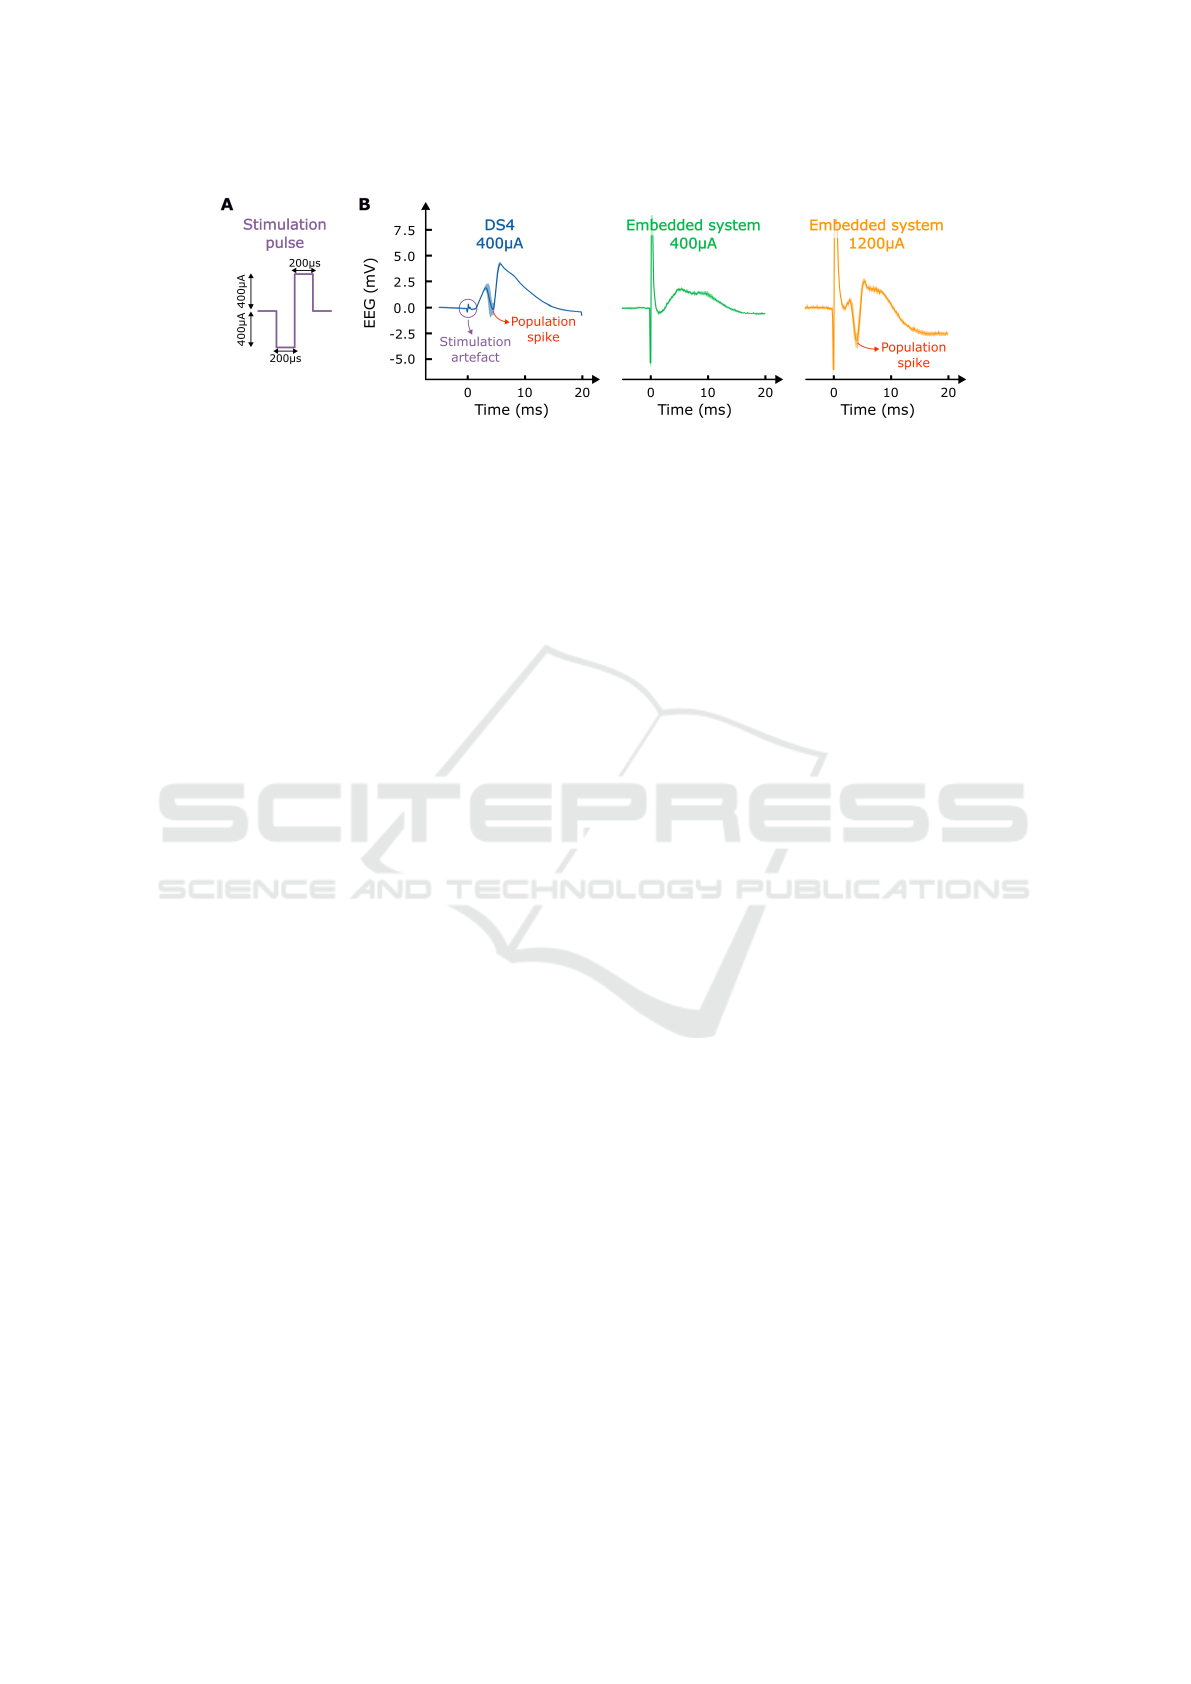
Figure 10: A: Schematic of biphasic current pulse. B: EEG-traces of evoked potentials averaged over 5 repetitions for
stimulation pulses generated by the DS4 stimulator (400 µA) and the embedded system (400 and 1200 µA).
tion of the kainic acid and/or the WiChR viral vector,
(2) potential toxicity due to the combination of the
WiChR viral vector and the kainic acid, (3) the rela-
tively high titer of the WiChR viral vector and/or (4)
a severe immune response triggered by the implanta-
tion of the relatively large optical fibre (ø400µm). A
follow-up study will aim to tackle these potential is-
sues.
3.4 Evoked Potentials
A final experiment was conducted with the aim to test
the ability of the embedded system to deliver accu-
rate biphasic current pulses to generate evoked poten-
tials for potential use in a responsive neuromodulation
experiment based upon brain excitability. The experi-
ment was performed simultaneously with an acute ex-
periment under anaesthesia as described by Spanoghe
et al. (Spanoghe et al., 2024). For stimulation, a
biphasic current pulse with a phase duration of 200 µs
and a current amplitude of +/-400 µA was generated
using the DS4 current stimulator (Digitimer, United
Kingdom) as shown in Figure 10A. At the end of the
experiment, the DS4 stimulator was replaced by the
embedded system to allow a direct comparison. Pre-
vious bench top testing showed that both systems pro-
vided an identical stimulation pulse over a 10 kΩ re-
sistor.
However, in vivo, there was a difference as the ad-
dition of the embedded system in the recording set-
up introduced noise within the recording, likely due
to grounding issues. These experiments were per-
formed under anaesthesia, which forms a less con-
trolled environment for EEG recording compared to
the environment for housing and chronic EEG record-
ings as used in the previously described chronic re-
sponsive neuromodulation experiment. As a conse-
quence, the 400 µA pulses from the embedded system
were more noisy and resulted in a different evoked
potential compared to the DS4 stimulator as shown in
Figure 10B for 5 averaged repetitions of this stimula-
tion pulse. The evoked potentials from the embedded
system show an increased stimulation artefact and the
evoked potential does not contain a population spike,
i.e. the negative peak generated by collective gener-
ation of action potentials by the neurons. When in-
creasing the stimulation amplitude to 1200 µA, it was
possible to generate an evoked potential with a popu-
lation spike.
4 CONCLUSION
The embedded system has been demonstrated to be
functional and can be used for responsive neuromod-
ulation experiments using electrical or optical stimu-
lation modalities though more optimisation is needed
for the use of biphasic current pulses with a short
phase duration. The design of this embedded system
shows the feasibility of performing chronic respon-
sive neuromodulation reliably with a minimalist hard-
and software design.
The seizure detection algorithm using the ampli-
tude correlation metric is simple yet surprisingly ef-
fective. An improvement can be made by the imple-
mentation of the use of an adaptive threshold based on
the use of a long-term average of the amplitude cor-
relation to mitigate inter-animal variability in signal
strength. For the future clinical application however,
this type of responsive neuromodulation using seizure
detection will be insufficient as you allow the seizure
to start before intervening. Ideally, the seizure would
be predicted or forecasted and preventive stimulation
would be used (Mormann et al., 2007; Baud et al.,
2022).
The therapeutic potential of seizure suppression
using the WiChR opsin is evident as seen by the
quick suppressive effect using only limited stimula-
tion. However, experimental difficulties limited the
scope of this study to an analysis of only 2 animals
which is insufficient to draw conclusions, especially
considering the inter-animal variability which was ev-
BIODEVICES 2025 - 18th International Conference on Biomedical Electronics and Devices
98

ident in this study. Future experiments will aim to in-
crease the number of animals included in the study
to allow more thorough analysis and statistics on the
seizure suppression and the influence of the stimula-
tion parameters.
AUTHOR CONTRIBUTIONS
SL - System design, data analysis, writing; LDS, JS,
MV, SC - Surgical interventions, animal welfare; JV
- Design and supply of WiChR viral vector; RV, RR,
PB - Supervision, funding acquisition
REFERENCES
Acharya, A. R., Vandekerckhove, B., Larsen, L. E., Del-
beke, J., Wadman, W. J., Vonck, K., Carette, E.,
Meurs, A., Vanfleteren, J., Boon, P., Missinne, J., and
Raedt, R. (2021). In vivo blue light illumination for
optogenetic inhibition: effect on local temperature and
excitability of the rat hippocampus. Journal of neural
engineering, 18.
Baud, M. O., Proix, T., Gregg, N. M., Brinkmann, B. H.,
Nurse, E. S., Cook, M. J., and Karoly, P. J. (2022).
Seizure forecasting: Bifurcations in the long and
winding road. Epilepsia.
Craey, E. (2022). A-novel-photocaged-adenosine-a1-
receptor-agonist-for-closed-loop-optical-control-of-
hippocampal-neurotransmission-and-suppression-of-
epileptiform-bursts-in-an-ex-vivo-slice-model-for-
epilepsy.
Craey, E., Hulpia, F., Spanoghe, J., Manzella, S., Larsen,
L. E., Sprengers, M., Bundel, D. D., Smolders, I.,
Carrette, E., Delbeke, J., Vonck, K., Boon, P., Calen-
bergh, S. V., Wadman, W. J., and Raedt, R. (2022).
Ex vivo feedback control of neurotransmission using
a photocaged adenosine a1 receptor agonist. Interna-
tional journal of molecular sciences, 23.
Desloovere, J., Boon, P., Larsen, L. E., Goossens, M. G.,
Delbeke, J., Carrette, E., Wadman, W., Vonck, K., and
Raedt, R. (2021). Chemogenetic seizure control with
clozapine and the novel ligand jhu37160 outperforms
the effects of levetiracetam in the intrahippocampal
kainic acid mouse model. Neurotherapeutics, 19:342.
Ebrahim, A. A. and Tungu, A. (2022). Neuromodulation
for temporal lobe epilepsy: a scoping review. Acta
Epileptologica, 4:1–11.
Instruments, T. T. (2008). An-1515 a comprehensive study
of the howland current pump (rev. a) — enhanced
reader.
Krook-Magnuson, E., Armstrong, C., Oijala, M., and
Soltesz, I. (2013). On-demand optogenetic control of
spontaneous seizures in temporal lobe epilepsy. Na-
ture Communications 2013 4:1, 4:1–8.
Medina, R., Ho, A., Reddy, R., Chen, J., and Castellanos, J.
(2023). Narrative review of current neuromodulation
modalities for spinal cord injury. Frontiers in Pain
Research, 4.
Mormann, F., Andrzejak, R. G., Elger, C. E., and Lehnertz,
K. (2007). Seizure prediction: the long and winding
road. Brain : a journal of neurology, 130:314–333.
Pederson, D. J., Quinkert, C. J., Arafat, M. A., Somann,
J. P., Williams, J. D., Bercich, R. A., Wang, Z., Albors,
G. O., Jefferys, J. G., and Irazoqui, P. P. (2019). The
bionode. ACM Transactions on Embedded Computing
Systems (TECS), 18:400.
Ryvlin, P. and Jehi, L. E. (2021). Neuromodulation for re-
fractory epilepsy. Epilepsy currents, 22:11–17.
Shon, A., Chu, J. U., Jung, J., Kim, H., and Youn, I. (2017).
An implantable wireless neural interface system for
simultaneous recording and stimulation of peripheral
nerve with a single cuff electrode. Sensors (Basel,
Switzerland), 18.
Spanoghe, J., Boon, P., Vergaelen, M., Colvenaer, M. D.,
Mariman, T., Vonck, K., Carrette, E., Wadman, W.,
Craey, E., Larsen, L. E., Sprengers, M., Missinne, J.,
Calenbergh, S. V., Bundel, D. D., Smolders, I., and
Raedt, R. (2024). Photopharmacological activation of
adenosine a1 receptor signaling suppresses seizures in
a mouse model for temporal lobe epilepsy. bioRxiv,
page 2024.07.04.602052.
Vierock, J., Peter, E., Grimm, C., Rozenberg, A., Chen,
I. W., Tillert, L., Scalise, A. G. C., Casini, M., Au-
gustin, S., Tanese, D., Forget, B. C., Peyronnet, R.,
Schneider-Warme, F., Emiliani, V., B
´
ej
`
a, O., and
Hegemann, P. (2022). Wichr, a highly potassium-
selective channelrhodopsin for low-light one- and
two-photon inhibition of excitable cells. Science Ad-
vances, 8.
Weyn, L., Tarnaud, T., Schoeters, R., Becker, X. D., Joseph,
W., Raedt, R., and Tanghe, E. (2024). Computa-
tional analysis of optogenetic inhibition of ca1 neu-
rons using a data-efficient and interpretable potassium
and chloride conducting opsin model. bioRxiv, page
2024.10.17.618665.
White, A. M., Williams, P. A., Ferraro, D. J., Clark, S.,
Kadam, S. D., Dudek, F. E., and Staley, K. J. (2006).
Efficient unsupervised algorithms for the detection of
seizures in continuous eeg recordings from rats af-
ter brain injury. Journal of Neuroscience Methods,
152:255–266.
Zeidler, Z., Brandt-Fontaine, M., Leintz, C., Krook-
Magnuson, C., Netoff, T., and Krook-Magnuson, E.
(2018). Targeting the mouse ventral hippocampus in
the intrahippocampal kainic acid model of temporal
lobe epilepsy. eNeuro, 5:ENEURO.0158–18.2018.
Embedded System for Responsive Optogenetic Control of Spontaneous Seizures in a Preclinical Temporal Lobe Epilepsy Model
99
