
An Integrated Building Management Platform for Investment into
Renewable Energy System and SRI Compliance
Giuseppe Rocco Rana
a
, Giuseppe Mastandrea
b
, Marco Antonio Insabato
c
,
Reshma Penjerla
d
and Luigi D’Oriano
e
Energy@Work, Bari, Italy
Keywords: Smart Readiness Indicator, Renewable Energy Systems, Building Management System (BMS) Integration,
Optimization Algorithms, Energy Efficiency, Investment Advisor, Energy Simulation,
Decision-Making Tools, Sustainable Buildings.
Abstract: The goals of ecological transition in habitations require an increasing number of considerations to ensure that
newly installed systems or building management solutions are economically advantageous and effective in
terms of energy savings and production. The increasing variety and supply of renewable energy systems, and
the increasing demand for them require tools that meet the needs of building stakeholders (e.g., building
owners and facility managers) to ease the transition as well as provide consistent metrics to measure the
validity and integrated simulation to facilitate investment decisions and track ecological transition progress
over time. This paper introduces a comprehensive toolset with multiple features, including the simulation and
management of Renewable Energy Systems (RES), the Building Management System (BMS) integration, and
the calculation and simulation of the Smart Readiness Indicator (SRI). This toolset collectively assesses the
readiness of a building toward an ecological transition. Specifically, the system includes: (1) an Advanced
SRI Calculation Engine, which implements both simplified (Method A) and detailed (Method B) SRI
calculations for various European regions providing precise evaluations of smart building capabilities across
domains such as heating, cooling, ventilation, lighting, and energy monitoring; (2) a continuous tracking of
building’s smart readiness evolution enabled by seamless BMS Integration that allows real-time monitoring
of building systems and allows a continuous tracking of a building's smart readiness evolution; and finally (3)
an Optimized Investment Advisor which offers tailored recommendations for investments in smart building
upgrades, renewable energy installations, and energy storage systems, employing advanced optimization
algorithms to ensure cost-effectiveness and energy efficiency. Developed as part of the INSPIRE, an
experiment under the SUSTAIN EU project Open Call for smart building innovations, this toolset aims to
enhance decision-making processes, improve resource allocation, and foster a holistic approach to achieve
smart, sustainable, and energy-efficient buildings.
1 INTRODUCTION
The INSPIRE (INteroperable open and modular
energy management System with integrated
Performance Improvement and optimization SRI
calculation and support for energy and REnewable
investments) endeavors to establish a modular,
interoperable energy management system that
incorporates an advanced Smart Readiness Indicator
(SRI) calculator and supports investments in
renewable energy sources. This initiative is focused
on enabling building users to achieve independence
from fossil fuels by using the SRI (SRI
Implementation Tools, s.d.) to assess and enhance
a
https://orcid.org/0000-0002-3353-3239
b
https://orcid.org/0000-0002-1579-8030
c
https://orcid.org/0000-0002-6490-5277
d
https://orcid.org/0009-0008-9868-5955
e
https://orcid.org/0000-0003-0208-5776
346
Rana, G. R., Mastandrea, G., Insabato, M. A., Penjerla, R. and D’Oriano, L.
An Integrated Building Management Platform for Investment into Renewable Energy System and SRI Compliance.
DOI: 10.5220/0013379000003896
In Proceedings of the 13th International Conference on Model-Based Software and Systems Engineering (MODELSWARD 2025), pages 346-353
ISBN: 978-989-758-729-0; ISSN: 2184-4348
Copyright © 2025 by Paper published under CC license (CC BY-NC-ND 4.0)
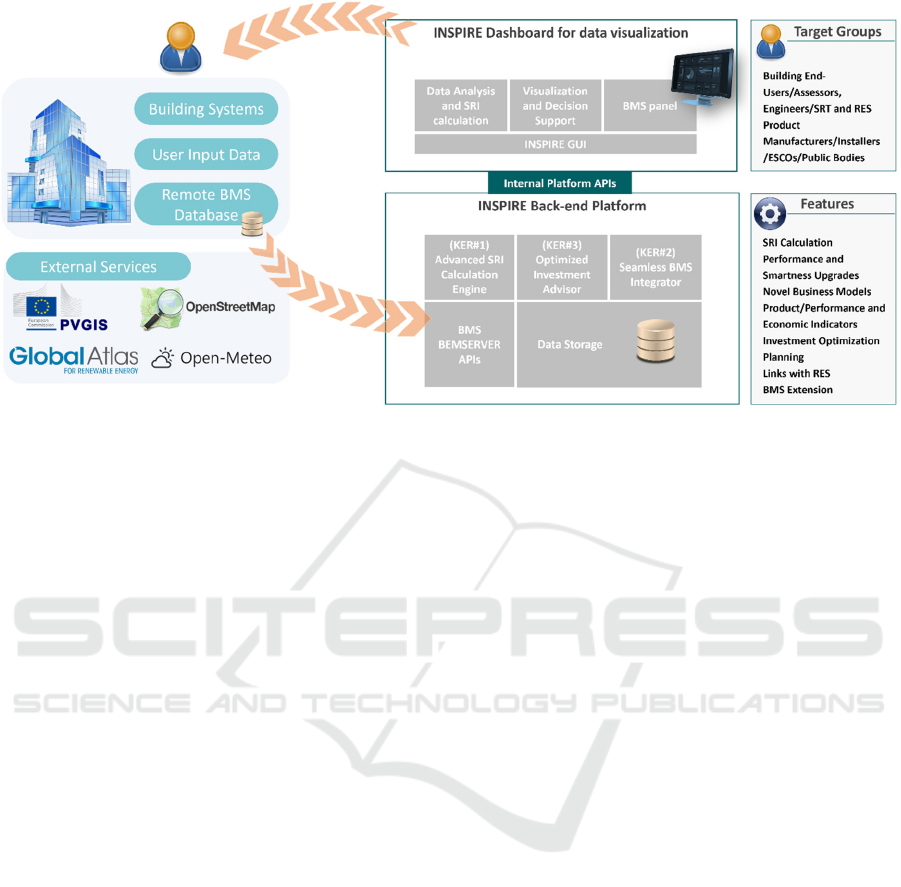
Figure 1: Conceptual architecture of the INSPIRE platform.
building capabilities, thereby facilitating investments
in renewable energy systems (RES) and smart
technologies integrated with advanced IT systems.
The system comprises three primary software
components. The first, an Advanced SRI Calculation
Engine, offers a user-friendly platform for deep
evaluation of a building’s readiness for smart
technologies. The second component, the Seamless
BMS Integrator, leverages the BEMServer open-
source solution to enable real-time insights and
operational optimization, representing a significant
advancement from static to dynamic SRI assessments
through responsive building management. Lastly, the
Optimized Investment Advisor component evaluates
installations of RES (Verda et al., 2022) and smart
devices to develop balanced investment plans that
emphasize energy efficiency and reduce
environmental impact. Collectively, these
components illustrate the INSPIRE integrated
approach to promoting sustainable and intelligent
building environments.
2 LITERATURE REVIEW
The development of tools to assess a building's
readiness for ecological transition aligns with the
European Smart Readiness Indicator (SRI)
framework, which emphasizes energy efficiency,
smart technology integration, and user-centric
adaptability. Several recent studies have highlighted
the strengths and limitations of the SRI methodology
across diverse contexts. For instance,
(Apostolopoulos et al., 2022) explored retrofitting
scenarios to enhance smart readiness in various
building typologies, demonstrating cost-effective
pathways to improve SRI scores but revealing
inconsistencies in service applicability and subjective
assessment criteria. Similarly, (Papadopoulos et al.,
2024) proposed simplified financial indicators to
bridge technical and economic considerations,
promoting accessibility and adoption among diverse
stakeholders. Comparative analyses, such as those
by(Samaras et al., 2024), underscore the regional
variations in SRI adoption readiness, highlighting
gaps in policy frameworks and technological
infrastructure across EU countries. These studies
collectively underscore the need for a comprehensive,
adaptable assessment toolkit that integrates SRI
frameworks with real-time data, financial metrics,
and multi-criteria decision-making models to ensure
broader applicability and alignment with ecological
goals. The tools presented in this paper contribute to
this evolving landscape by offering enhanced
methodologies and comparative insights, addressing
previously noted limitations in SRI's adaptability and
practical implementation.
3 SOFTWARE ARCHITECTURE
The Software Architecture is meticulously designed
to consolidate various components to augment
building intelligence, energy efficiency, and
investment optimization through streamlined front-
end and back-end interactions.
The architecture comprises a number of
components, organised as follows:
An Integrated Building Management Platform for Investment into Renewable Energy System and SRI Compliance
347
Dashboard for Data Visualization: This
dashboard employs HTML, CSS, and JavaScript to
craft a user-friendly interface that supports data
analysis, Smart Readiness Indicator (SRI)
calculations, and visualizations. It incorporates tools
such as OpenLayers for map integration, Ol-
Geocoder for geocoding services, and DataTables for
managing lists of buildings. The GUI enables
building managers to effectively visualize data and
interface with the Building Management System
(BMS).
Back-end Platform: The back-end platform is
engineered to facilitate critical functionalities
including the Advanced SRI Calculation Engine,
Optimized Investment Advisor, and Seamless BMS
Integrator. This platform is integral in performing
calculations that optimize investments and enhance
building intelligence and energy production
capacity. It integrates external data and utilizes APIs
for real-time monitoring and data acquisition from
IoT devices. The back-end supports the front-end
dashboard through sophisticated data processing
and decision-making tools, aimed at maximizing
energy efficiency and optimizing smart building
operations.
3.1 SRI Calculator
The Smart Readiness Indicator (SRI) is a European
Commission initiative under the Energy Performance
of Buildings Directive, designed to measure a
building’s capacity to utilize smart technologies that
facilitate decarbonization and enhance living comfort
and efficiency.
It evaluates a building's 'smartness' based on its
ability to sense, interpret, communicate, and actively
respond to the dynamics of technical systems,
external environmental factors (including energy
grids), and occupant needs.
The methodology for calculating the SRI is based
on the multi-criteria assessment method defined in
Commission Delegated Regulation (EU) 2020/21551
(Delegated Regulation - 2020/2155 - EN - EUR-Lex,
s.d.) and provide two main Methods, the simplified
one (Method A) which is based on a limited,
simplified catalogue of 27 services and the Method B,
based on lists full catalogue of 54 services.
The formula for calculating the SRI can generally
be simplified as follows:
𝑆𝑅𝐼 =
∑
𝑊
,
⋅
𝑆
,
∑
𝑊
,
∗ 100
(1)
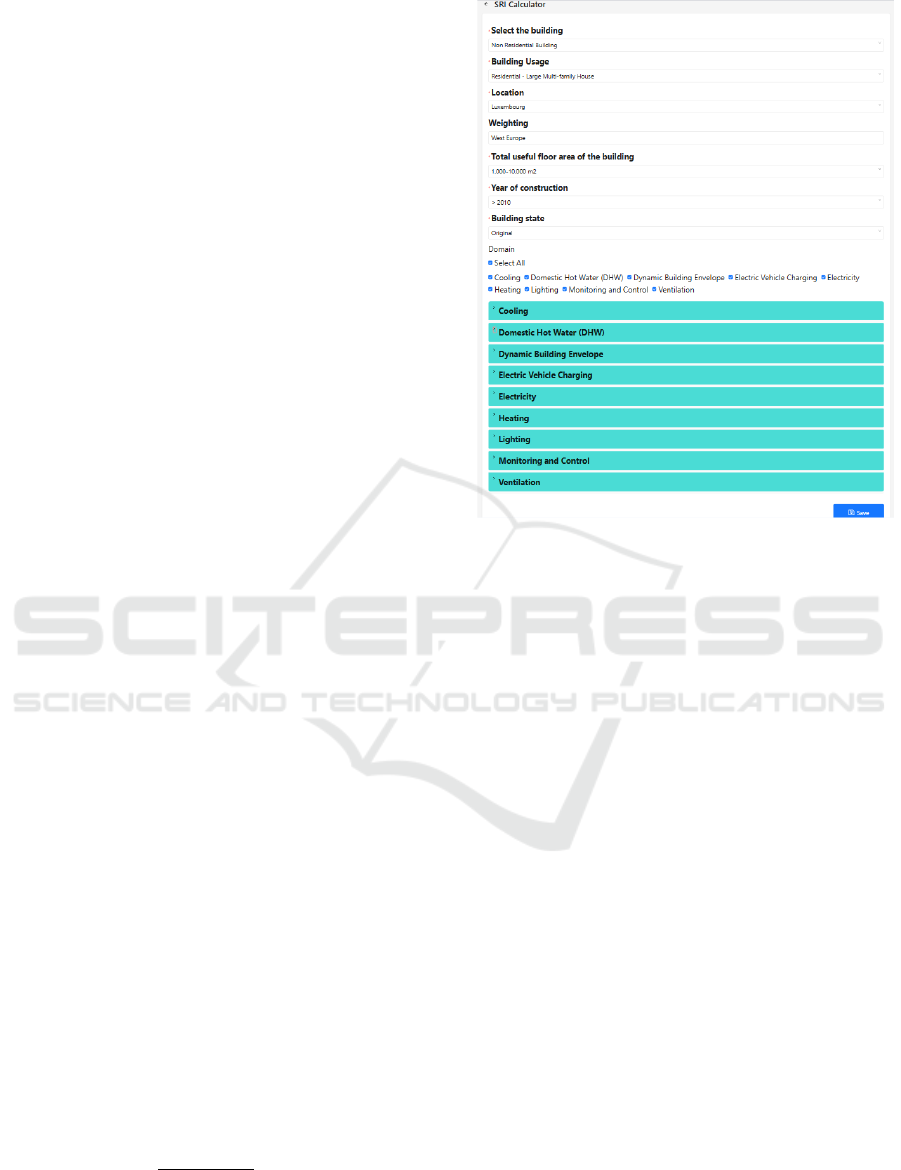
Figure 2: User-Friendly Data Input Interface for the SRI
Calculator.
Where:
• 𝑊
,
: Weight assigned to service i under the
country-specific framework.
• 𝑆
,
: Score of service i under the country-
specific framework, which may include
adjustments for local definitions or
thresholds.
•
∑
𝑊
,
: Total weight of all services after
country-specific adjustments.
• The result is multiplied by 100 to express the
SRI as a percentage.
This formula encapsulates the weighted average
score of services adjusted for local conditions,
expressed as a percentage.
A detailed SRI calculation tool using Method B
has been implemented across all regions. The tool has
developed and integrated essential components for
calculating total SRI scores, impact scores, domain
scores, detailed (partial) scores, and aggregated
scores. All data are stored in a PostgreSQL database,
managed through the Flask framework, with HTTP
REST APIs enabling interactions with the Optimized
Investment Advisor tool.
3.2 SRI Optimisation Component
The Optimized Investment Advisor tool delivers
investment recommendations by leveraging SRI
MODELSWARD 2025 - 13th International Conference on Model-Based Software and Systems Engineering
348
scores, budget limitations, and specific device
catalogues relevant to Italy, the Netherlands, and
Cyprus. It employs sophisticated optimization
algorithms, such as the Knapsack Branch and Bound
method (Bednarczuk et al., 2018), to propose optimal
investment strategies that improve building
intelligence. These recommendations are seamlessly
integrated with the comprehensive SRI score
obtained from the SRI Calculation Engine.
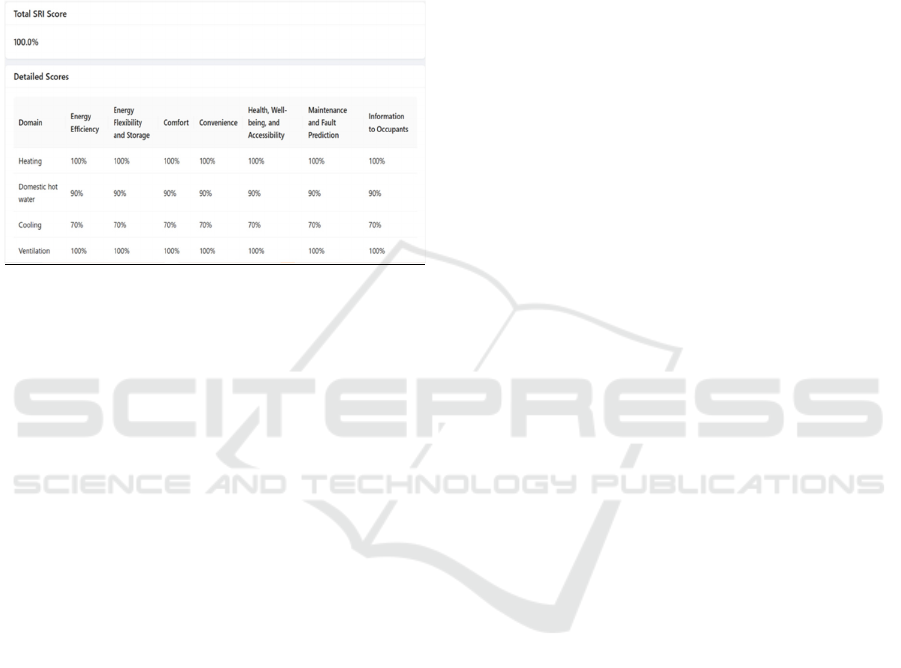
Figure 3: User-Friendly Interface of SRI Calculator Results.
Below is a detailed description of the
mathematical structure used for the calculations on
the backend, which outlines how the optimization
process is approached.
Objective:
Maximize the total “profit” (Total SRI Score):
Maximize ∑
n
i=1
p
i
x
i
(2)
Constraints:
The total “weight” (cost) of the selected items (smart
devices) must not exceed the capacity (Budget):
∀𝐶 ∑
n
i=1
w
i
x
i ≤
W (3)
Variables:
n: Number of items (smart devices).
w
i
: Weight (cost) of item
p
i
: Profit (total SRI score) of item
x
i
: Binary decision variable indicating whether item
i is selected (1) or not (0).
W: Maximum capacity (budget).
𝐶: Cost type (Main Automation Cost, Installation
Cost, Operational and Management Cost).
3.3 RES Optimiser
The RES optimizer provides the possibility to
determine the best set of renewable energy systems,
in order to maximise renewable energy production
and incentivise self-consumption as well as
production, in order to reduce reliance on the grid,
given the market costs per kWh. The optimisation
consists of minimising the LCOE using Constrained
Integer Linear Programming techniques (Omu et al.,
2013) as well as a Constrained Search Problems
(Hannan et al., 2020), (Khan et al., 2020), (Yang et
al., 2022). A number of devices are available as
possible solutions for the energy optimiser, said
options being photovoltaic panels, wind turbines,
energy storage battery solutions, and micro co-
generation plants to replace the older, less efficient
boilers.
3.3.1 Building Selector
The building selector consists of providing an
interface in order to find the building of interest on
which to perform the analysis and optimisation of the
potential Renewable Energy Systems to apply. The
building selection then saves the building according
to its coordinates, its local total irradiance value, and
thus the potential performance with solar energy
system, as well as the degree days in order to assess
the potential heating energy required to activate the
systems. Last but not least, the intuitive shape
selection allows users to delineate the area of the
building that will be used for their optimizations.
3.3.2 Optimization
The optimisation procedure allows users to select
their preferred RES (Renewable energy systems) as
well as provide further information about the building
layout, about whether the building has a sloped or flat
roof, the height of the available façade as well as roof
availability percentage.
Next, there is the selection of potential RES to
include in the optimisation. These are in turn divided
into:
• Photovoltaics (PVs): based on the irradiance
values obtained from PVgis (PVGIS data
sources & calculation methods, s.d.) and
considerations about PV panel degradation over
ten years of use, reflecting the typical decline in
energy production efficiency as PV panels age,
the total power per PV is estimated and used to
determine energy production
• Vertical Axis Wind Turbines (VAWT): the
reason for VAWTs is their smaller form factor
compared to the industrial case, allowing for
decentralised wind energy production.
Determining their energy is dependent on the
maximisation of the energy produced by the
rotor according to the Betz principle (van Kuik,
2007) and then the obtained energy production
is used in the main optimisation function
An Integrated Building Management Platform for Investment into Renewable Energy System and SRI Compliance
349

• Micro Combined Heat and Power (μCHP):
through the modelling of the internal building
spaces, as well as the energy class in accordance
to European and Italian standard as well as
degree days estimation, it is possible to obtain a
linear model of the shape factor and estimate the
produced thermal energy and thus the recovered
electrical energy of a μCHP within the
optimisation
• Energy Storage: It is considered according to
the type of profile the building is assigned to
(office, apartment, warehouse) in order to
determine the self-consumption and thus the
sizing of the battery to maximise storage or
minimise battery draw.
Finally, the system is optimised in accordance to
the following objective function:
𝐿𝐶𝑂𝐸 =
∑
𝐶
⋅
∈
𝑛
∑
𝐺
⋅
∈
𝑛
(4)
Where:
𝐶
: cost per unit of the individual RES
𝐺
: revenue per unit fo the individual RES
LCOE standing for Levelized Cost of Energy.
The feature of this function is being able to balance
supply and demand of energy, to minimise costs and
maximise self-consumption, thus reducing energy
draw from the grid. Data about the building such as
roof size, internal space, façade width and such
determine spatial constraints and energy needs.
3.4 Building Management System
Integration
In order to provide a complete solution, an existing
building management has been incorporated through
its core component and an API: Bemserver (Bourreau
et al., 2019). BEMserver is an open source, AGPL-
3.0 licensed, building management system with built
in functionalities to manage buildings, districts, and
apartments, as well as datetime data. This datetime
data enables real-time insights and enhanced analysis,
particularly in evaluating the impact of
recommendations provided by tools such as
acquisition campaigns. These campaigns are
designed to monitor and assess the system’s
performance, allowing building managers to verify
improvements in self-consumption or enhancements
in the Smart Readiness Indicator (SRI) metric. This,
in turn, boosts the building’s interconnectivity and
overall efficiency.
4 TESTS AND RESULTS
4.1 SRI Calculator Validation
The analysis in the table below showcases the
assessment of differences between SRI scores derived
from the EU Excel sheet for SRI calculation (SRI
Package v4.5) and those calculated using the
INSPIRE tool for buildings in Italy, across multiple
levels of the different domains. Each domain's
functionalities were tested independently to ensure
accuracy, maintaining a 100% efficiency baseline for
all her domains. The results for each level were then
aggregated and averaged to determine the overall
variance within the domain. This structured approach
allows for a precise evaluation of the SRI tool's
performance in comparison to the baseline data. The
table also includes a breakdown of average
percentage differences across various building
domains, highlighting the minor discrepancies
observed and providing a clear overview of the tool’s
consistency and reliability in SRI score calculations.
Table 1: Comparison of SRI Scores Across Europe: EU
Excel for SRI calculation vs. INSPIRE Tool.
Average value of the Differences (In Percentage) for all the Regions
Domains West
Europe
South
Europe
North
Europe
South
East
Europe
North
East
Europe
Heating 0.08% 0.02% 0.02% 0.03% 0.09%
Cooling 0.09% 0.03% 0.02% 0.11% 0.01%
Ventilation 0.02% 0.01% 0.05% 0.01% 0.01%
Domestic
Hot Water
0.07% 0.06% 0.10% 0.03% 0.08%
Lighting 0.01% 00% 0.01% 0.0% 0.0%
Dynamic
Building
Envelope
0.0% 0.0% 0.01% 0.0% 0.0%
Electricity 0.08% 0.02% 0.04% 0.06% 0.10%
Electric
Vehicle
Charging
0.14% 0.14% 0.08% 0.14% 0.14%
Monitoring
and control
0.06% 0.03% 0.06% 0.04% 0.01%
4.2 SRI Optimizer Validation
The SRI Optimizer has been tested and the tests
implemented have confirmed that the knapsack
algorithm provides accurate and optimal solutions for
the given inputs, maximizing the Smart Readiness
Indicator (SRI) scores within specified budget
constraints, by correcting the minor issues in the
MODELSWARD 2025 - 13th International Conference on Model-Based Software and Systems Engineering
350

functions of the optimizer and proving its effectiveness
in decision support for smart device investments.
Table 2: Comparison of different tests implemented to
validate the SRI Optimizer.
Country
Avg. Invest.
costs
Avg.
Initial SRI
Avg.
Final
SRI
Avg. Final
investment
% SRI
error
IT
5000
20 23 4988,1 0,15
50 55 4993,16 0,06
10000
20 26 9971,65 0,79
50 59 9911,57 1,59
50000
20 57 48432,3 5,72
50 98 49086,7 2,17
100000
20 100 92240,6 15,52
50 100 99378,5 6,21
NL
5000
20 23 4991,69 0,21
50 55 4976,42 0,12
10000
20 28 9956,66 7,19
50 59 9955,73 3,22
50000
20 47 49454,87 14,45
50 100 48756,88 24,86
100000
20 100 94501,81 21,99
50 100 98651,08 26,98
CY
5000
20 24 4986,55 0,25
50 54 4999,33 0,01
10000
20 27 9975,58 0,89
50 58 9968,23 0,50
50000
20 59 49578,4 10,14
50 83 49708,34 4,81
100000
20 100 99847,47 12,20
50 100 97842,96 5,39
To facilitate enhanced Smart Readiness Indicator
(SRI) scores and elevate the building's smart
capabilities, users are prompted to select their country
of interest currently available options include Italy, the
Netherlands, and Cyprus. Additionally, users must
specify their preferred cost type, choosing from Main
Automation Cost, Installation Cost, or Operational
Management Cost, along with their budget constraints.
Utilizing the Knapsack Branch and Bound algorithm,
coupled with a comprehensive device catalogue, the
system strategically optimizes SRI scores by
minimizing costs within the defined budgetary limits.
The optimization outcomes are presented in terms of
total equipment purchase cost and optimized SRI
scores, accompanied by recommended investments.
This allows users to meticulously review and consider
suggestions for further enhancements, thereby
fostering informed decision-making to improve the
building’s smartness effectively.
The Table 2 presents the results of tests conducted
for Italy (IT), the Netherlands (NL), and Cyprus (CY)
to evaluate the performance of the SRI optimizer
across different investment sizes (€5,000, €10,000,
€50,000, and €100,000) and initial SRI values (20 and
50). For each scenario, the average final SRI and
average final investment calculated by the optimizer
are reported, alongside the percentage error in SRI
compared to the traditional calculation method using
the EC spreadsheet. The data show that the SRI error
generally increases with larger investments and
higher SRI targets, with significant discrepancies
observed particularly in the Netherlands at higher
investment levels. This highlights the varying
accuracy of the optimizer across different contexts
and its performance relative to established methods.
4.3 RES Optimiser Validation
The RES Optimiser has been validated in accordance
to a test set consisting of a variety of conditions in
terms of location within Italy, as the Degree Day data
was the most available, as well as provide diverse
conditions in terms of climate due to the length of the
country.
Outside of that, a number of conditions have been
tested, namely:
Table 3: Input variables.
Parameter Name Value set
Building profile Medium size apartment
Medium office
Warehouse
Interior space 220 m
2
440 m
2
1760 m
2
Energy consumption per
square meter
80 €/m
2
120 €/m
2
160 €/m
2
Energy classes D
G
BIPV Installation Not expected
Installed on roof
Installed on wall
μCHP Not expected
Expected
Location
(latitude, longitude)
40.74805 17.38009
41.87028 13.12521
45.58191 12.76365
40.304750 18.222830
An Integrated Building Management Platform for Investment into Renewable Energy System and SRI Compliance
351

As a result, the following algorithms were compared:
COBYLA: gradient free optimization
algorithm (Powell, 1994)
SLSQP: Sequential Least Squares Quadratic
programming (Joshy & Hwang, 2024)
SHGO: simplicial homology global
optimization(Endres et al., 2018)
CP-SAT: Constraint satisfiability
programming(Python Reference, s.d.)
TRUST CONSTRAINT: global search
problem for inequality Constraints (Yuan,
2015)
The results are as follows, on average
Table 4: Algorithm results in terms of success rate, average
iteration number and objective function output.
Algorithm
Success
Rate
Iterations LCOE
COBYLA 95.88% 766 0.59
SLSQP 33.33% 3740 0.55
SHGO 100% 250 0.61
CP-SAT 100% N.A. 0.92
TRUST
CONSTRA
INT
24.28% 898 0.77
Table 5: performance of the algorithms in terms of roof
usage, investment usage and energy savings.
Algorithm
roof
occup. %
Invest.
usage %
energy
savings %
COBYLA 25.15 79.86 48.9
SLSQP 17.41 56.2 33.52
SHGO 27.98 79.75 48.93
CP-SAT 49.57 74.38 25.25
TRUST
CONSTr.
38.93 111.25 48.71
4.4 BMS Communication Validation
The BMS API has been validated in terms of
integration for the inclusion of data. A number of tests
have been performed using synthetic data, where a
sample building has been created, being in a specific
district, with a number of apartments, all being
included in an acquisition campaign. Being integrated
in the main website for data acquisition. Said data has
been used in order to test the integration level of the
BMS with the rest of the tools.
5 CONCLUSIONS
This paper highlights the successful development and
implementation of the INSPIRE project toolset. The
integration of the Advanced SRI Calculation Engine
and the Optimized Investment Advisor has
demonstrated its potential to enhance decision-
making processes, optimize investments, and provide
insights into a building's transition. Furthermore, the
inclusion of the Continuous Tracking System enabled
by a seamless BMS integration has opened a dynamic
assessment and tracking of a building's smart
readiness evolution. These insights can contribute to
proposing a refinement of existing SRI frameworks,
bridging the gap between static evaluations (Methods
A and B) and a more dynamic, performance-based
approach envisioned for future Method C by the EU
Commission. Future developments will be addressed
to enhance optimization algorithms and broaden
system integrations to support diverse SRI-based
business models. Finally, these tools have created a
holistic framework that empowers stakeholders to
achieve measurable progress in the ecological
transition of buildings: by offering robust decision-
making tools and scalable solutions, the toolset can
facilitate sustainable building practices across various
contexts.
ACKNOWLEDGEMENTS
This research was part of the INSPIRE experiment,
funded by the Open Call of the SUSTAIN project
(Grant Agreement No 101074311) and also builds
upon the results of activities conducted by
Energy@Work as a partner in the EasySRI project
(Grant Agreement No. 101077169).
REFERENCES
Apostolopoulos, V., Giourka, P., Martinopoulos, G.,
Angelakoglou, K., Kourtzanidis, K., & Nikolopoulos,
N. (2022). Smart readiness indicator evaluation and
cost estimation of smart retrofitting scenarios—A
comparative case-study in European residential
buildings. Sustainable Cities and Society, 82, 103921.
https://doi.org/10.1016/j.scs.2022.103921
Bednarczuk, E. M., Miroforidis, J., & Pyzel, P. (2018). A
multi-criteria approach to approximate solution of
multiple-choice knapsack problem. Computational
Optimization and Applications, 70(3), 889–910.
https://doi.org/10.1007/s10589-018-9988-z
MODELSWARD 2025 - 13th International Conference on Model-Based Software and Systems Engineering
352

Bourreau, P., Chbeir, R., Cardinale, Y., Corchero, A.,
Lafréchoux, J., Frédérique, D., Salameh, K., Calis, G.,
Constantinou, R., & Kallab, L. (2019). BEMServer: An
Open Source Platform for Building Energy
Performance Management. 1, 256–264. https://doi.
org/10.35490/EC3.2019.176
Delegated regulation—2020/2155—EN - EUR-Lex. (s.d.).
https://eur-lex.europa.eu/eli/reg_del/2020/2155/oj
Endres, S. C., Sandrock, C., & Focke, W. W. (2018). A
simplicial homology algorithm for Lipschitz
optimisation. Journal of Global Optimization, 72(2),
181–217. https://doi.org/10.1007/s10898-018-0645-y
Hannan, M. A., Tan, S. Y., Al-Shetwi, A. Q., Jern, K. P., &
Begum, R. A. (2020). Optimized controller for
renewable energy sources integration into microgrid:
Functions, constraints and suggestions. Journal of
Cleaner Production, 256, 120419. https://doi.org/10.
1016/j.jclepro.2020.120419
Joshy, A. J., & Hwang, J. T. (2024). PySLSQP: A
transparent Python package for the SLSQP
optimization algorithm modernized with utilities for
visualization and post-processing (arXiv:2408.13420).
arXiv. https://doi.org/10.48550/arXiv.2408.13420
Khan, I. U., Javaid, N., Gamage, K. A. A., Taylor, C. J.,
Baig, S., & Ma, X. (2020). Heuristic Algorithm Based
Optimal Power Flow Model Incorporating Stochastic
Renewable Energy Sources. IEEE Access, 8, 148622–
148643. IEEE Access. https://doi.org/10.1109/
ACCESS.2020.3015473
Omu, A., Choudhary, R., & Boies, A. (2013). Distributed
energy resource system optimisation using mixed
integer linear programming. Energy Policy, 61, 249–
266. https://doi.org/10.1016/j.enpol.2013.05.009
Papadopoulos, P., Koukaras, P., Giama, E., Ioannidis, D.,
Papadopoulos, A. M., & Fokaides, P. A. (2024).
Enhancing Smart Readiness through Simplified
Financial Indicators. 2024 9th International
Conference on Smart and Sustainable Technologies
(SpliTech), 1–5. https://doi.org/10.23919/SpliTech
61897.2024.10612317
Powell, M. J. D. (1994). A Direct Search Optimization
Method That Models the Objective and Constraint
Functions by Linear Interpolation. In S. Gomez & J.-P.
Hennart (A c. Di), Advances in Optimization and
Numerical Analysis (pp. 51–67). Springer Netherlands.
https://doi.org/10.1007/978-94-015-8330-5_4
PVGIS data sources & calculation methods. (s.d.).,
https://joint-research-centre.ec.europa.eu/photovoltaic-
geographical-information-system-pvgis/getting-started-
pvgis/pvgis-data-sources-calculation-methods_en
Python Reference: CP-SAT | OR-Tools. (s.d.). Google for
Developers. Recuperato 22 novembre 2023, da
https://developers.google.com/optimization/reference
/python/sat/python/cp_model
Samaras, P., Stamatopoulos, E., Arsenopoulos, A., Sarmas,
E., & Marinakis, E. (2024). Readiness to Adopt the
Smart Readiness Indicator Scheme Across Europe: A
Multi-Criteria Decision Analysis Approach. 2024 IEEE
International Workshop on Metrology for Living
Environment (MetroLivEnv)
, 268–273. https://doi.org/
10.1109/MetroLivEnv60384.2024.10615377
SRI implementation tools. (s.d.). https://energy.ec.europa.
eu/topics/energy-efficiency/energy-efficient-buildings/
smart-readiness-indicator/implementation-tools_en
van Kuik, G. A. M. (2007). The Lanchester–Betz–
Joukowsky limit. Wind Energy, 10(3), 289–291.
https://doi.org/10.1002/we.218
Verda, V., Guelpa, E., Lanzini, A., Colangelo, A., Simonetti,
M., Moschos, I., Katsaros, N., Mastandrea, G., D’Oriano,
L., Kompougias, I., Buzzetti, M., Del Pero, C., Virtuani,
A., Lisco, F., Cattaneo, G., Despeisse, M., Morbiato, T.,
Hamilton, L., Kiartzis, S., … Cretu, M. (2022).
Integration of innovative and conventional renewable
technologies in nearly Zero-Energy Buildings. DTU
Construct. https://iris.polito.it/handle/11583/2995472?
mode=complete
Yang, Y., Bremner, S., Menictas, C., & Kay, M. (2022).
Modelling and optimal energy management for battery
energy storage systems in renewable energy systems: A
review. Renewable and Sustainable Energy Reviews,
167, 112671. https://doi.org/10.1016/j.rser.2022.
112671
Yuan, Y. (2015). Recent advances in trust region
algorithms. Mathematical Programming, 151(1), 249–
281. https://doi.org/10.1007/s10107-015-0893-2.
An Integrated Building Management Platform for Investment into Renewable Energy System and SRI Compliance
353
