
ScaleVis: Interactive Exploration of Measurement Instrument
Verification Data
Haris Memi
´
c
1
, Sanjin Radoš
2 a
, Almira Softi
´
c
3 b
and Krešimir Matkovi
´
c
4 c
1
Institute of Metrology of Bosnia and Herzegovina, Sarajevo, Bosnia and Herzegovina
2
Austrian Federal Computing Center, Vienna, Austria
3
University of Sarajevo, Faculty of Mechanical Engineering, Sarajevo, Bosnia and Herzegovina
4
VRVis Research Center, Vienna, Austria
Keywords:
Interactive Visual Exploration, CMV, Non-Automatic Weighing Instrument Verification Data.
Abstract:
Legal metrology ensures consumer protection from inaccurate measurements by regulating numerous instru-
ments, some under EU harmonized legislation and others governed by national decisions based on the In-
ternational Organization for Legal Metrology (OIML) recommendations. Verification laboratories produce
measurement reports, often in unstructured PDF formats. Exploring and analyzing these reports remains in-
herently tedious and error-prone due to their format as numerous unstructured PDF files. To address these
challenges, we introduce ScaleVis, a system combining standard and specialized visualizations to facilitate
the exploration and analysis of measurement data including spatial information relevant to eccentricity mea-
surements. The system incorporates data cleaning to resolve inconsistencies from manual entry and provides
insights into measurement trends and deviations. Focusing on non-automatic weighing instruments, we ana-
lyze verification results to identify significant deviations in linearity and eccentricity. This study focuses on the
analysis of non-automatic weighing instruments from various manufacturers and application domains. Using
verification results from competent laboratories, we examine the metrological behavior of these instruments,
identifying the ranges of linearity and eccentricities with the largest deviations from prescribed errors. A use
case with domain experts underscores ScaleVis’s potential to streamline data analysis in legal metrology, with
initial feedback indicating strong utility and effectiveness.
1 INTRODUCTION
Metrology systems have different arrangements in re-
lation to whether they are centralized or decentralized
(distributed). This paper describes a distributed le-
gal metrology system, i.e., metrological controls are
performed by laboratories that are authorized to per-
form verifications of measuring instruments on behalf
of the state in accordance with national regulations.
These laboratories are required to inform the com-
petent state institution about the verifications carried
out by sending test reports confirming the compliance
of the inspected measuring instruments in accordance
with the prescribed requirements. Laboratories sub-
mit reports in the prescribed format to fulfill require-
ments set by normative documents. Based on these
a
https://orcid.org/0000-0002-5620-9407
b
https://orcid.org/0000-0003-2636-7348
c
https://orcid.org/0000-0001-9406-8943
reports, a document database with the measurement
results of all measuring instruments used has been es-
tablished. However, the database represents only an
history archive of data without any detailed overall
analysis. Therefore, aware of the significant momen-
tum in the digitalization of all processes and services
offered on the market, digitalization in the field of le-
gal metrology is also necessary (Oppermann et al.,
2022). Existing databases can gain an additional pur-
pose for various analyses that ultimately contribute to
protecting the end consumer and speeding up moni-
toring processes. Efficient means of exploration and
analysis are urgently needed.
In this work, we focus on non-automatic weigh-
ing instruments (NAWIs), verified in accordance with
the requirements outlined in OIML Recommendation
R76. Measurement data from three different types of
NAWIs (precision scales, accuracy class II) produced
by different manufacturers are analyzed to reveal load
points that are most susceptible to significant errors,
1000
Memi
´
c, H., Radoš, S., Softi
´
c, A. and Matkovi
´
c, K.
ScaleVis: Interactive Exploration of Measurement Instrument Verification Data.
DOI: 10.5220/0013380700003912
Paper published under CC license (CC BY-NC-ND 4.0)
In Proceedings of the 20th International Joint Conference on Computer Vision, Imaging and Computer Graphics Theory and Applications (VISIGRAPP 2025) - Volume 1: GRAPP, HUCAPP
and IVAPP, pages 1000-1007
ISBN: 978-989-758-728-3; ISSN: 2184-4321
Proceedings Copyright © 2025 by SCITEPRESS – Science and Technology Publications, Lda.

identify trends where certain load points may consis-
tently exhibit larger errors, and enable comparisons
between NAWIs from different manufacturers.
Interactive visual analysis is a well-established ap-
proach for understanding complex data. To facilitate
insights into measurement reports, we employ a coor-
dinated multiple views system. Our focus is on errors
reported in three standard procedures: measurement
errors under increasing load, errors under decreasing
load, and eccentricity error measurements. Ideally,
a scale should display consistent weight readings re-
gardless of the load’s position. Since eccentricity er-
ror measurement involves a spatial component, we ac-
count for this aspect when designing the correspond-
ing visualization. In addition to the eccentricity error
view, the system incorporates histograms, parallel co-
ordinates, and box plots. All views are integrated into
the coordinated multiple views system, enabling com-
posite brushing to seamlessly link and explore data
across multiple perspectives. We also briefly describe
the preprocessing steps, which include extracting and
cleaning data from the PDF files.
The system’s design is the outcome of close col-
laboration between visualization and metrology ex-
perts. Through numerous discussion sessions, we
identified key tasks and requirements, which are en-
capsulated in task abstractions and requirements spec-
ification. These insights guided the development of
our visualization mappings and interaction design.
In this paper, our primary focus is not on introduc-
ing novel visualization techniques, but rather on lever-
aging the capabilities of coordinated multiple views
(CMV) to explore complex metrology data. Given the
vast amount of unstructured data available in various
institutes that handle legal metrology, new exploration
methods are urgently needed. The main contributions
of this paper can be summarized as follows:
• ScaleVis, an interactive analysis tool for metrol-
ogy data.
• Task abstractions and requirements analysis for
measurement reports used in legal metrology.
• A use case that illustrates the usefulness of the
proposed approach.
2 RELATED WORK
Interactive Visual Analysis (IVA) is an iterative ap-
proach to derive insights from large, multifaceted
datasets, with linking and brushing as its core con-
cept (Kehrer and Hauser, 2013), (Weber and Hauser,
2014). Introduced by Becker and Cleveland (Becker
and Cleveland, 1987), brushing was expanded by
Martin and Ward in XmdvTool, enabling logical oper-
ations like AND, OR, XOR, and NOT for composite
brushes (Ward, 1994), (Martin and Ward, 1995). Co-
ordinated and Multiple Views (CMV) extends this by
synchronizing multiple data views, where actions like
zooming, highlighting, or filtering in one view auto-
matically update others (Roberts, 2007).
Aigner et al. (Aigner et al., 2011) provide an
overview of tools and techniques for visualizing time-
oriented data, including curve views and timelines.
Although our data is load-dependent rather than time-
dependent, we employ curve views, commonly used
for temporal data.
Parallel coordinates plots (Inselberg, 1985) effec-
tively display multidimensional data and are increas-
ingly recognized beyond the visualization commu-
nity. Our domain experts quickly adopted them due to
their intuitive nature and minimal need for data trans-
formation (Siirtola and Räihä, 2006).
While interactive visualization has been applied
across various domains (Reina et al., 2020), its use in
measurement-instrument verification is limited. This
paper bridges that gap by introducing coordinated
multiple views for metrology. Though visual ana-
lytics tools are widely used (Heer and Shneiderman,
2012), their application in metrology has mainly fo-
cused on consolidating data. We offer a novel contri-
bution by advancing data analysis for legal metrology
in a close collaboration with metrology experts.
The National Institute of Standards and Technol-
ogy (NIST) emphasizes digitalization as a key driver
for advancing measurement systems and compliance
in legal metrology. As a significant challenge shap-
ing the future of metrology, digitalization enables in-
novations like AI integration and data-sharing net-
works for managing and visualizing measurement
data, highlighted at the 2023 International Confer-
ence on Weighing. National metrology institutes are
developing strategies focused on digital, machine-
readable certificates for verification and testing labo-
ratories (Eichstädt et al., 2021), alongside algorithms
to enhance data quality.
Studies have analyzed measurement results to
assess non-conformity risks in NAWIs and evalu-
ate risks for manufacturers and customers (Medina,
2018). These analyses include measurement results
obtained in processes of type approval, verifications,
and inspections. Also, there are related analysis, con-
sidering influences on measuring results like environ-
mental conditions and measurement uncertainty ob-
tained in processes of verification and calibration in
laboratory controlled conditions and working on-side
conditions (Memi
´
c et al., 2023).
ScaleVis: Interactive Exploration of Measurement Instrument Verification Data
1001

3 BACKGROUND
Measurements are integral to daily life, whether
tracking time, shopping, refueling, or monitoring
health metrics. Metrology, the science of measure-
ment, encompasses scientific, legal, and industrial
branches. Legal metrology ensures accuracy and reli-
ability, protecting consumers from fraud by maintain-
ing measurements within prescribed maximum per-
missible errors (mpe). Countries determine priori-
ties and instruments under state metrological supervi-
sion. WELMEC, the European Regional Metrology
Organization, provides details on measuring instru-
ments subject to legal metrology, including their reg-
ular verification intervals to ensure compliance with
mpe. EU directives MID (2014/32/EU) and NAWID
(2014/31/EU) govern harmonized instruments.
The OIML suggests expanding legal metrology to
include additional instruments. This paper analyzes
verification results of non-automatic weighing instru-
ments (NAWIs) over an extended period. NAWIs,
widely used in medical, retail, pharmaceutical, and in-
dustrial settings, are governed by the EU directive and
verified per EN 45501 or OIML R76 standards. Ac-
credited laboratories, meeting ISO/IEC 17020, pro-
vided data for this study. Verification confirms com-
pliance through tests like repeatability, linearity, and
eccentricity, ensuring adherence to prescribed errors.
Table 1 provides an example of measurement re-
sults following the OIML R76-2 recommendation,
with error E calculated using these results. The mea-
surement error for linearity and eccentricity is deter-
mined by:
E = I + 1/2e − ∆L − L (1)
To calculate the corrected error, the error E
0
(mea-
sured with an unloaded or near-zero load receptor)
must be subtracted:
E
c
= E − E
0
(2)
During verification, NAWIs must satisfy the condi-
tion:
|E
c
| ≤ |mpe| (3)
4 ANALYSIS TASKS AND
REQUIREMENTS
In this paper, we focus on exploration and analy-
sis of linearity and eccentricity. The linearity test is
carried out throughout the entire measurement range
of NAWI, i.e., the load points are evenly distributed
throughout the entire measurement range and the
maximum permissible error (mpe). The minimum
Figure 1: Predefined load placement positions for the ec-
centricity test on rectangular and round scales. The scale
should show the same value regardless of load placement.
number of load points taken into account when deter-
mining linearity errors is five, considering the small-
est and largest weighing capacity. Eccentricity testing
takes place in five load points, as shown in Figure 1,
with a load corresponding to one-third of the maxi-
mum capacity of the subject NAWI.
At the highest level, experts are primarily con-
cerned with determining whether a measuring de-
vice meets the required normative document (OIML
R 76). This initial assessment is straightforward—
checking if all errors fall below the prescribed thresh-
olds. While this analysis is essential, the extensive
raw measurement data offers a wealth of additional
insights. For a more exploratory approach, it is not
enough to merely classify a device as compliant or
non-compliant. Examining the distribution of the fi-
nal corrected errors (Ec), even in cases where the
thresholds are not exceeded, provides deeper insights
and fosters a better understanding of the measurement
data. The complete analysis refers to the requirements
of final corrected errors (in further text referred to “er-
ror”) in comparison to maximum permissible errors.
This is precisely the goal of our work: to enable such
in-depth exploration and provide tools that facilitate a
comprehensive understanding of metrological data.
To inform our design, we engaged in a collabo-
ration between visualization and metrology experts.
Through numerous meetings and discussions, we
identified key analysis tasks. Following the approach
outlined by Brehmer and Munzner (Brehmer and
Munzner, 2013), we systematically analyzed these
tasks to derive essential requirements for our visual-
ization design.
T1. Understand linearity errors, explore their devel-
opment based on load, and analyze distributions
categorized by manufacturer and time.
T2. Understand eccentricity errors and analyze their
distributions based on spatial positions.
T3. Compare distributions of eccentricity and linear-
ity errors.
T4. Gain an overview of the available data, includ-
ing the number of manufacturers, years of mea-
surement, temperature, and other supplementary
IVAPP 2025 - 16th International Conference on Information Visualization Theory and Applications
1002

Table 1: An example of measurement results provided by approved laboratories, following the OIML R76-2 recommendation.
The down arrow (↓) denotes measuring results obtained by progressively increasing loads, while the up arrow (↑) indicates
measuring results obtained by progressively decreasing loads.
Load Indication Addition load Error corrected Error mpe
L in g I in g ∆L in g E in g E
c
in g in g
↓ ↑ ↓ ↑ ↓ ↑ ↓ ↑
0 0.0 0.0 0 0 0 0 0 0 0.025
5 5.0 5.0 0 0 0 0 0 0 0.05
50 50.0 50.0 0 0 0 0 0 0 0.05
200 200.0 200.0 0 0 0 0 0 0 0.05
300 300.0 300.0 0 0 0 0 0 0 0.05
400 400.01 400.01 0 0 0.01 0.01 0.01 0.01 0.05
600 600.01 600.01 0 0 0.01 0.01 0.01 0.01 0.1
610 610.02 610.02 0 0 0.01 0.02 0.02 0.02 0.1
data recorded in the measurement files.
Based on the tasks described above, the following de-
sign requirements are specified:
R1. Depict all linearity errors aligned to each other
to be able to identify patterns.
R2. Visualize distributions of eccentricity errors tak-
ing spatial arrangement onto account.
R3. Provide means to see eccentricity errors correla-
tions.
R4. Visualize distribution of errors and compare
them.
R4a. Support comparison of error development
over time.
R4b. Support comparison of error differences
based on manufacturer.
R5. Visualize supplementary data to easy understand
their distribution.
5 VISUALIZATION DESIGN
To address all the identified requirements, we em-
ploy a coordinated multiple views system. The data
is structured in a table where each row corresponds to
a measurement. For each measurement, we include
supplemental data (e.g., year of measurement, serial
number, age of the scale), maximum linearity error
for an increasing load, maximum error for a decreas-
ing load, eccentricity loads and their corresponding
errors, and, as a special element, the linearity mea-
surement data itself, represented as a measurement
data curve. A similar data model has been described
by Konyha et al. (Konyha et al., 2006).
Figure 2 provides a screenshot of the proposed
views configuration. The histograms on the left dis-
play supplemental data and fulfill requirement R5, al-
lowing experts to easily interpret the information.
The views in the second column of Figure 2 fo-
cus on eccentricity errors. The top view, referred to
as the eccentricity error view, visualizes error distri-
butions at each measurement point (R2). Initially, we
attempted to represent these using five histograms in a
row, but aligning each histogram with its correspond-
ing position required additional effort. By overlaying
the histograms on a map of the measurement points,
the correspondence became immediately clear.
While the eccentricity error view effectively
shows the distributions of individual errors, it does not
clearly convey how the errors from a single measure-
ment are related (R3). To address this, we propose us-
ing a parallel coordinates plot. This standard plot type
supports highlighting when hovering with the mouse,
making it easier to explore individual measurements.
Such interaction is particularly useful because the er-
rors have discrete values due to the digital nature and
limited precision of the scales being examined. No-
tably, we maintained the axis order from one to five,
as reordering (e.g., placing the axis one in the middle)
proved confusing for domain experts. This confusion
likely arose because left and right axes could not be
placed unambiguously in that arrangement.
The curve views display linearity errors for all
measurements (R4). Since measurements can involve
different load values depending on a scale’s range, we
provide an option to normalize all data, mapping the
horizontal axis to a standardized range from 0 to 1.
Displaying all curves simultaneously allows users to
examine errors within the context of the entire dataset.
To address scalability issues, the view supports den-
sity mapping: when many curves are present, they are
rendered with reduced opacity. This approach high-
lights the main trends effectively while retaining visi-
bility of the overall dataset. Finally, we also show the
ScaleVis: Interactive Exploration of Measurement Instrument Verification Data
1003
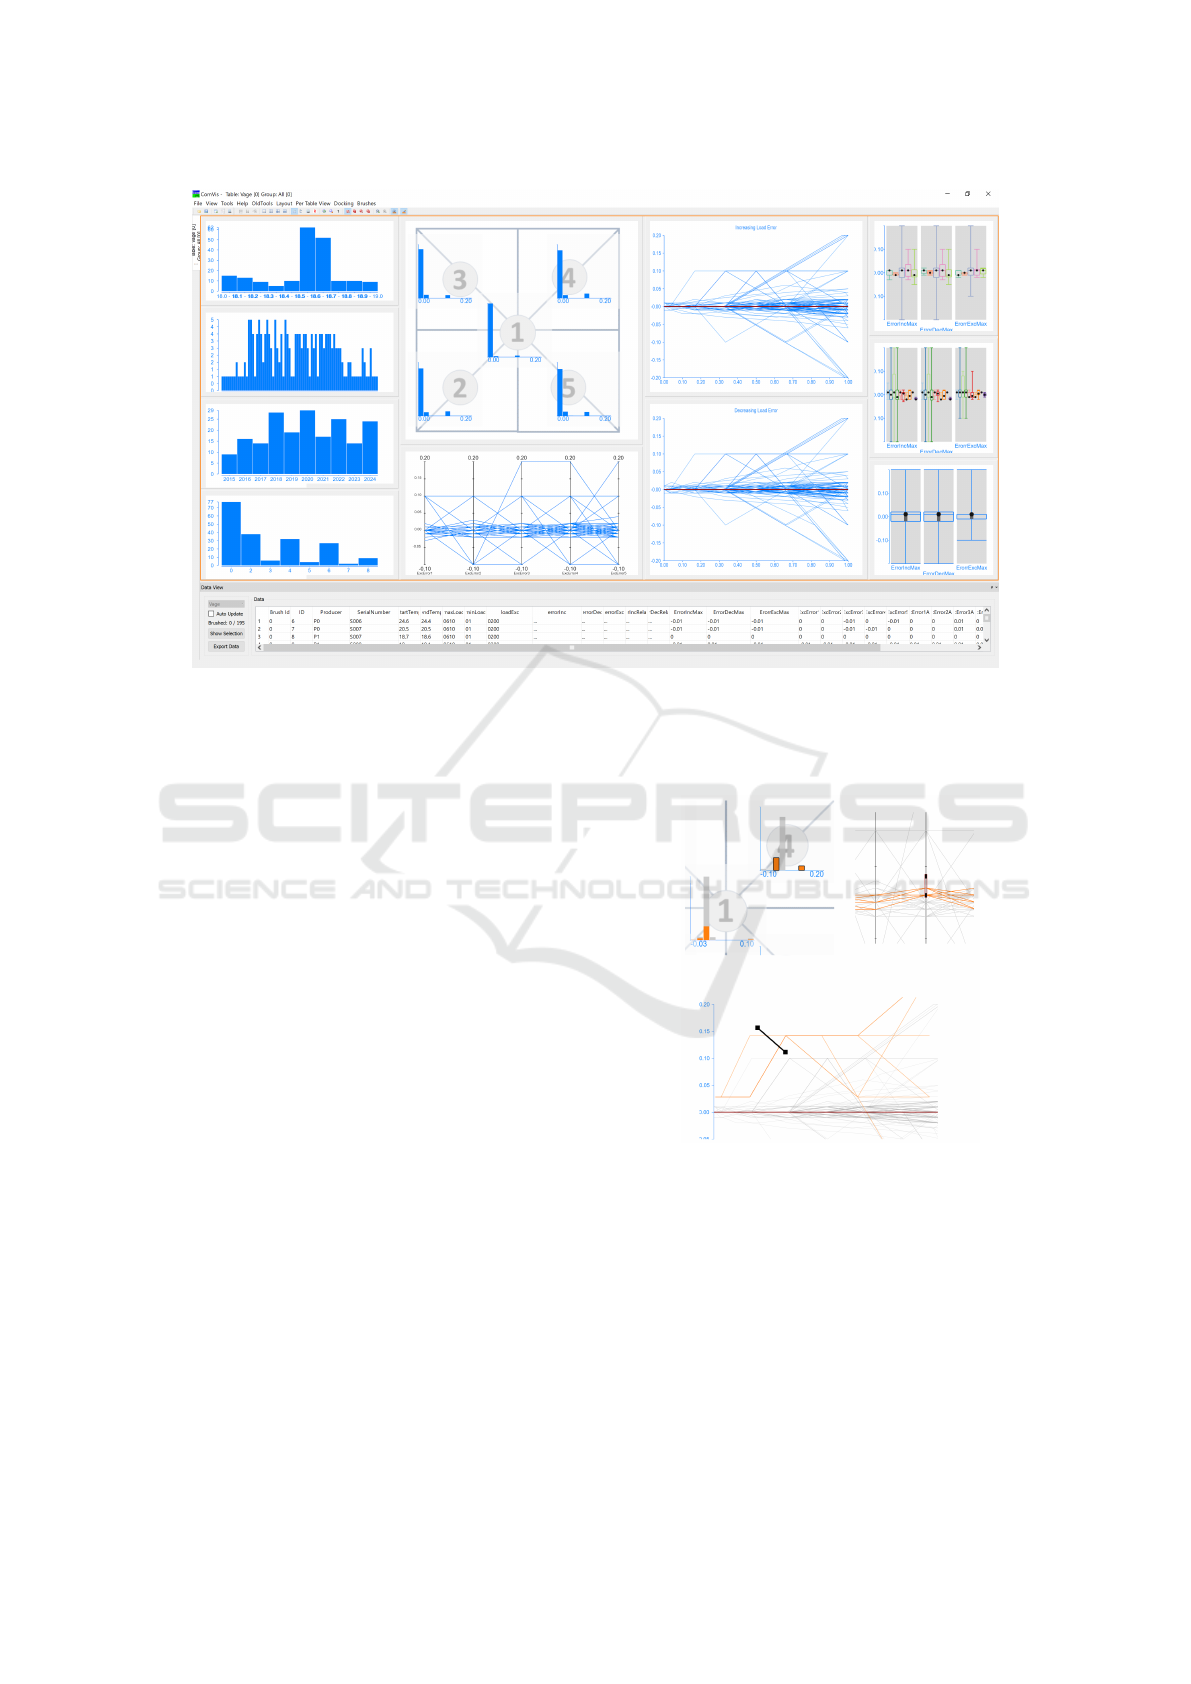
Figure 2: A screenshot of the view configuration used in one of the exploration sessions. The histograms on the left display
various supplemental data. The central left column shows eccentricity errors, while the central right column presents linearity
measurement errors for both increasing and decreasing loads. The box plots on the right show the distribution of errors in
relation to the manufacturer (top), scale age (middle), and error distributions for all measurements (bottom). The table at the
bottom shows the values of all dimensions.
zero line in red, so that users can easily see positive
and negative errors.
On the right side of Figure 2, box plots illustrate
the distributions of maximum linearity errors for in-
creasing and decreasing load measurements, as well
as for eccentricity tests. For eccentricity, the bottom
view features a box plot for each error type and five
separate box plots corresponding to the five eccen-
tricity measurement positions. The two upper plots
present error distributions for all three error types,
split by manufacturer (top) and scale age (middle),
addressing requirements R4a and R4b.
The data view at the bottom provides a tabular
overview of all measurement data. When drill-down
exploration is performed using composite brushing,
the view display only the selected subset of data.
5.1 Interaction
All views in the system support linking and brushing,
the fundamental principle of coordinated multiple
views. Users can interactively select a subset of data
in any view, and the corresponding items in all other
views are automatically highlighted. Brushes can be
combined using Boolean operations, enabling flexible
and complex data exploration. The histograms allow
for bin-based selections. In the parallel coordinates
plot, brushing is performed by marking an interval
Figure 3: Users can brush histogram bins by clicking, select
curves with a line brush, and define ranges in the parallel
coordinates plot. Brushes are graphically represented, mov-
able, and resizable, as shown by the black-bordered bins,
parallel coordinates brush, and line brush in the curve view.
Multiple brushes can be combined with Boolean operations.
along any axis. The curve views feature a specialized
line brush, where the user draws a line, and all curves
that intersect it are brushed. Figure 3 demonstrates
these brushing techniques.
IVAPP 2025 - 16th International Conference on Information Visualization Theory and Applications
1004
6 USE CASE
We describe a use case conducted by two visualiza-
tion researchers and two metrology researchers, all
of whom coauthor this paper. For this use case, we
collected measurement reports from several approved
laboratories in PDF format. These reports do not fol-
low a standardized template; each laboratory uses its
own format, but the format remains consistent for all
tests conducted by a given laboratory. The reports
are manually filled in by human operators, and as a
result, they sometimes contain typographical errors,
empty rows, or missing data. These inconsistencies
highlight typical challenges encountered when deal-
ing with data of unknown quality. The first step in our
use case is data pre-processing.
6.1 Data Pre-Processing
Measurement reports from the NAWI Verification
Data are stored in PDFs with inconsistent formats,
varying in content, table structure, and result order.
To address this, we developed Python scripts to ex-
tract data efficiently, ensuring consistency and repro-
ducibility. These scripts currently support four widely
used report templates based on the country of ori-
gin and can be extended for additional templates.
Scanned documents are not included but could be sup-
ported in the future.
We processed 195 reports, creating an
anonymized dataset by replacing manufacturers
and serial numbers with randomized values to ensure
privacy. While all measurements meet legal require-
ments, further analysis offers valuable insights for
domain experts.
6.2 Interactive Visual Analysis
Once the data is processed, it can be loaded and anal-
ysis begins. The histograms of the supplemental data
show, for example, how many scales are represented
only once in the data set (each scale has to be tested
on a biannual basis), how many are tested twice, etc.
The highest number of tests is five, in our data set.
6.2.1 Exploring the Eccentricity Error
The eccentricity error view indicates different error
distributions depending on the position. We show dis-
tribution of absolute errors (see Figure 2). Ideally,
all data would fall into the leftmost bin, representing
minimal errors. The central part of the scales, position
1 are most precise (which was somehow expected).
Positions 4 and 5 exhibit slightly worse behavior com-
pared to positions 2 and 3.
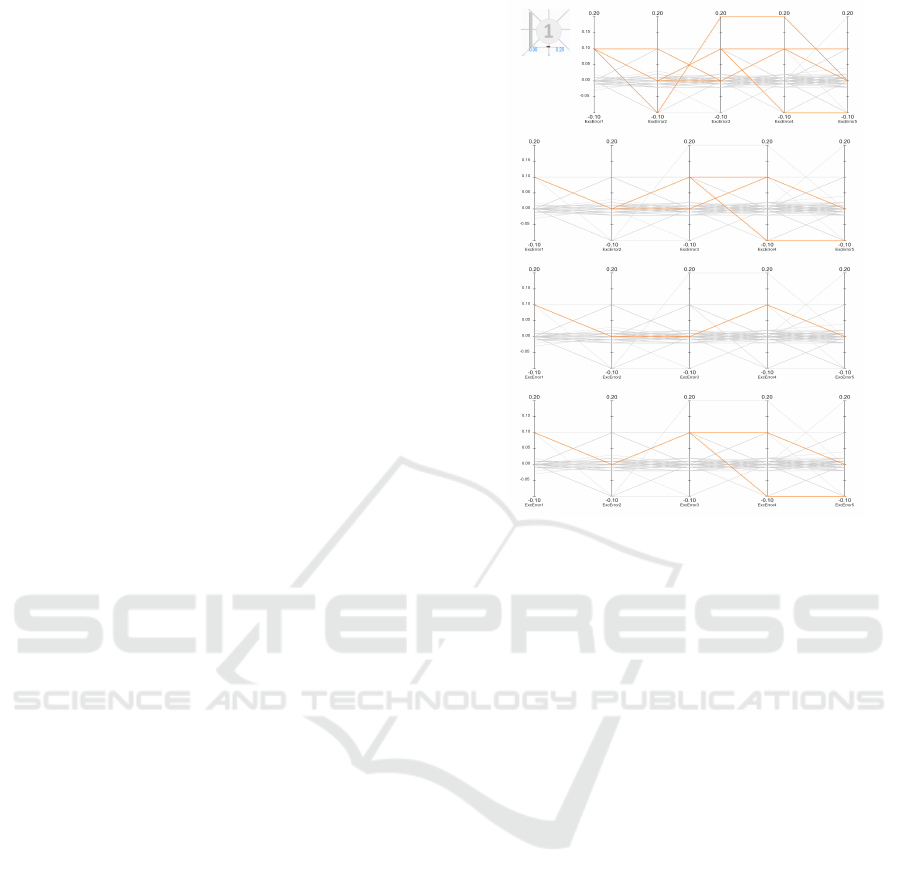
Figure 4: Exploring eccentricity errors across positions: We
begin by brushing the high errors at position 1 by selecting
the corresponding bin in the histogram, then refine the focus
to cases with near-zero errors at position 2, identifying five
distinct patterns before examining individual cases.
We brush high eccentricity errors at position one
and examine the parallel coordinates to identify the
other eccentricity errors associated with these cases.
There are five measurements with the high error at
the position 1. Figure 4 shows the brushed bin and
the corresponding parallel coordinates in the top row.
The parallel coordinates plot shows the original
error values, not the absolute ones. Notably, the five
selected measurements display distinct patterns. To
explore further, we drill down and refine the brush.
Figure 4 also shows the results of these refinements.
First, we analyze cases with medium errors at position
2. Three such cases are identified, and they again ex-
hibit different error patterns. Further refinement iso-
lates individual cases, allowing us to observe how er-
rors vary across positions. One case in the final visu-
alization shows a positive error at position 3, followed
by negative errors at positions 4 and 5, for example.
These inconsistencies may stem from factors like
measurement changes, operator errors, or other influ-
ences. Identifying such cases without visualization
would be extremely challenging. Once detected, these
cases can be thoroughly examined. If inconsistencies
frequently occur for a particular scale type or are con-
sistently reported by the same laboratory, further in-
vestigation may be required.
ScaleVis: Interactive Exploration of Measurement Instrument Verification Data
1005
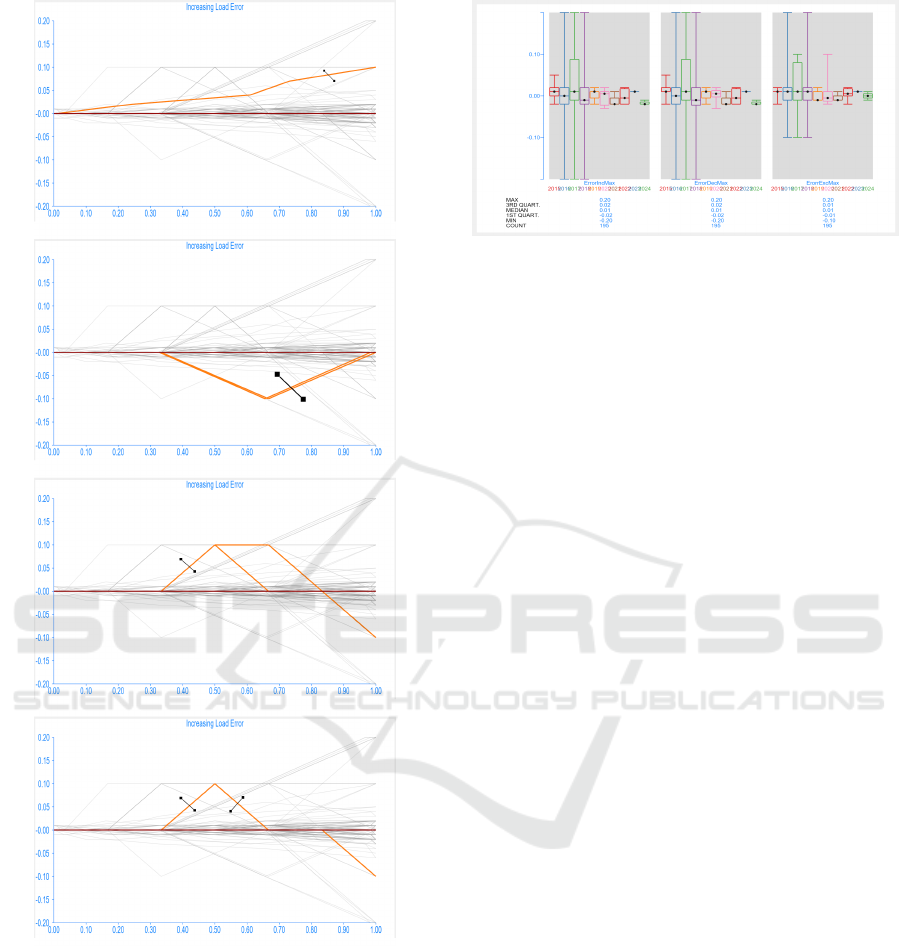
Figure 5: Exploring increasing load errors: While the er-
ror typically rises with load (top), some cases show unusual
patterns, such as mid-measurement increases followed by
decreases (second view) or early rises that fall to zero or
negative values (third and fourth views). The line brush aids
in selecting and analyzing these cases efficiently.
6.2.2 Exploring the Increasing Load Error
The curve view shows data for a series of measure-
ments with increasing and decreasing load. As the
load approaches the scale limits, we expect the ab-
solute value of the error to rise. In the curve view
(see Figure 2), we observe that most measurements
Figure 6: Box plots illustrate descriptive statistics, showing
aggregated maximums of three measurements. Increasing
and decreasing load measurements display similar behav-
ior, while eccentricity exhibits consistent medians early on
before oscillating in later years.
exhibit consistently low errors. However, there are
a few cases with unusual behavior. Let us examine
these cases now.
We use the line brush to select and analyze the
curves. Figure 5 illustrates some interesting findings.
The top view in Figure 5 shows a curve with a rela-
tively high error for the largest load, where the error
rises as the load increases. Although the error is high
at the end, this behavior is expected.
The second view in Figure 5 highlights cases with
a large negative error occurring mid-measurement, an
unusual behavior with unclear causes. The next view
in Figure 5 shows cases with a high positive error mid-
measurement. Refinement reveals two behaviors: the
error either drops to zero and turns negative or stays
high briefly before becoming negative Such oscilla-
tions in error warrant further investigation.
6.2.3 Errors Across the Years
Finally, the box plots reveal several interesting in-
sights. Figure 6 displays the distributions of the ag-
gregated maximum values for increasing load, de-
creasing load, and eccentricity measurements over the
years. The years correspond to when the measure-
ments were performed. This view also provides quan-
titative data, if needed.
We observe different patterns in the data distri-
butions for the loads. The increasing and decreasing
load measurements exhibit oscillating median values.
Larger minimum and maximum values were reported
in the earlier years.
For the eccentricity load, the median remains very
consistent during the first four years (2015–2018) be-
fore starting to oscillate. The largest minimum and
maximum values also appear in the early years, but
not consistently across all of them.
IVAPP 2025 - 16th International Conference on Information Visualization Theory and Applications
1006

7 CONCLUSION
ScaleVis provides many benefits for the end user as
well as in supervision of laboratories by metrology
institutes in process of verification. Analysis of mea-
surement data is a demanding task, but digitaliza-
tion and visualization of metrology reports provides
a faster insight into instruments deviations from the
expected behavior, such as changes in the curve when
testing linearity and eccentricity at different loads.
While these deviations are minor compared to per-
missible errors, visualization highlights instruments
requiring further monitoring, crucial in sensitive ap-
plications like healthcare. Factors like hysteresis or
improper handling often cause data deviations, im-
proving the efficiency of metrological supervision.
Visualization quickly detects anomalies in metrologi-
cal characteristics for further investigation.
We used interactive visualization to explore the
metrology data. The feedback from domain experts
has been very positive, and we see the work presented
in this paper as the beginning of a collaboration with
the metrology experts who coauthored this paper.
Due to time constraints and data sensitivity, we
started with a relatively small set of reports. Now that
the usefulness of the approach has been demonstrated,
we expect to gain access to a much larger corpus of
data. The system has been designed to scale effec-
tively with additional data, and all views have been
proven to function with significantly larger datasets.
Given the scales’ precision and digital data limi-
tations, errors are numerically represented but from a
limited set (e.g., 0.1, 0.2. . . with no intermediate val-
ues). To address overlapping data, we plan to explore
scattering techniques in future research.
ACKNOWLEDGMENTS
The VRVis GmbH is funded by BMK, BMAW, Tyrol,
Vorarlberg and Vienna Business Agency in the scope
of COMET - Competence Centers for Excellent Tech-
nologies (911654) which is managed by FFG.
REFERENCES
Aigner, W., Miksch, S., Schumann, H., and Tominski, C.
(2011). Visualization of time-oriented data, volume 4.
Springer.
Becker, R. A. and Cleveland, W. S. (1987). Brushing scat-
terplots. Technometrics, 29(2):127–142.
Brehmer, M. and Munzner, T. (2013). A multi-level ty-
pology of abstract visualization tasks. IEEE Trans-
actions on Visualization and Computer Graphics,
19(12):2376–2385.
Eichstädt, S., Keidel, A., and Tesch, J. (2021). Metrology
for the digital age. Measurement: Sensors, 18:100232.
Heer, J. and Shneiderman, B. (2012). Interactive dynamics
for visual analysis. Commun. ACM, 55(4):45–54.
Inselberg, A. (1985). The plane with parallel coordinates.
The Visual Computer, 1(2):69–91.
Kehrer, J. and Hauser, H. (2013). Visualization and visual
analysis of multifaceted scientific data: A survey. Vi-
sualization and Computer Graphics, IEEE Transac-
tions on, 19(3):495–513.
Konyha, Z., Matkovic, K., Gracanin, D., Jelovic, M., and
Hauser, H. (2006). Interactive visual analysis of fami-
lies of function graphs. IEEE Transactions on Visual-
ization and Computer Graphics, 12(6):1373–1385.
Martin, A. R. and Ward, M. O. (1995). High dimen-
sional brushing for interactive exploration of multi-
variate data. In Visualization, 1995. Visualization ’95.
Proceedings., IEEE Conference on, pages 271–.
Medina, N. (2018). Legal requirements for nawis: are they
good enough for customers’ protection? Journal of
Physics: Conference Series, 1065(8).
Memi
´
c, H., Bošnjakovi
´
c, A., Džemi
´
c, Z., and Softi
´
c, A.
(2023). Ocjena uskla
¯
denosti u oblasti zakonskog
mjeriteljstva na osnovu rezultata kalibracije Confor-
mity Assessment in the Field of Legal Metrology
Based on Calibration Results. In Jašarevi
´
c, S. and Br-
darevi
´
c, S., editors, Quality 2023, pages 151–158.
Oppermann, A., Eickelberg, S., Exner, J., Bock, T.,
Bernien, M., Niepraschk, R., Heeren, W., Baer, O.,
and Brown, C. (2022). Digital transformation in
metrology: Building a metrological service ecosys-
tem. Procedia Computer Science, 200:308–317.
Reina, G., Childs, H., Matkovi
´
c, K., Bühler, K., Waldner,
M., Pugmire, D., Kozlíková, B., Ropinski, T., Ljung,
P., Itoh, T., Gröller, E., and Krone, M. (2020). The
moving target of visualization software for an increas-
ingly complex world. Computers & Graphics, 87:12–
29.
Roberts, J. C. (2007). State of the art: Coordinated & multi-
ple views in exploratory visualization. In Andrienko,
G., Roberts, J. C., and Weaver, C., editors, Proc. of
the 5th International Conference on Coordinated &
Multiple Views in Exploratory Visualization. IEEE CS
Press.
Siirtola, H. and Räihä, K.-J. (2006). Interacting with paral-
lel coordinates. In Interacting with Computers.
Ward, M. O. (1994). Xmdvtool: integrating multiple meth-
ods for visualizing multivariate data. In VIS ’94: Pro-
ceedings of the conference on Visualization ’94, pages
326–333, Los Alamitos, CA, USA. IEEE Computer
Society Press.
Weber, G. and Hauser, H. (2014). Interactive visual ex-
ploration and analysis. In Hansen, C. D., Chen, M.,
Johnson, C. R., Kaufman, A. E., and Hagen, H., edi-
tors, Scientific Visualization, Mathematics and Visual-
ization, pages 161–173. Springer.
ScaleVis: Interactive Exploration of Measurement Instrument Verification Data
1007
