
Exploring Histopathological Image Augmentation Through
StyleGAN2ADA: A Quantitative Analysis
Glenda P. Train
1 a
, Johanna E. Rogalsky
2 b
, Sergio O. Ioshii
3 c
,
Paulo M. Azevedo-Marques
2 d
and Lucas F. Oliveira
1 e
1
Department of Informatics, Federal University of Paran
´
a (UFPR), Brazil
2
Interunit Graduate Program in Bioengineering, University of S
˜
ao Paulo (USP), Brazil
3
Pathological Anatomy Laboratory, Erasto Gaertner Hospital, Brazil
{glendaproenca, johanna.elisabeth8}@gmail.com, sergio.ioshii@pucpr.br, pmarques@fmrp.usp.br, lferrari@inf.ufpr.br
Keywords:
Breast Cancer, Estrogen Receptor, Progesterone Receptor, Digital Pathology, Data Augmentation,
Classification, Artificial Intelligence, Deep Learning, Medical Image Processing.
Abstract:
Due to the rapid development of technology in the last decade, pathology has entered its digital era with the
diffusion of WSIs. With this improvement, providing reliable automated diagnoses has become highly de-
sirable to reduce the time and effort of experts in time-consuming and exhaustive tasks. However, with the
scarcity of publicly labeled medical data and the imbalance between data classes, it is necessary to use various
data augmentation techniques to mitigate these problems. This paper presents experiments that investigate the
impact of adding synthetic IHC images on the classification of staining intensity levels of cancer cells with
estrogen and progesterone biomarkers. We tested models SVM, CNN, DenseNet, and ViT, trained with and
without images generated by StyleGAN2ADA and AutoAugment. The experiments covered class balancing
and adding synthetic images to the training process, improving the classification F1-Score by up to 14 per-
centage points. In almost all experiments using StyleGAN2ADA images, the F1-Score was enhanced.
1 INTRODUCTION
Cancer is a term that defines a large group of dis-
eases characterized by the rapid creation of abnor-
mal cells that grow beyond their usual limits and
can spread to other body regions. The widespread
spread of these abnormal cells is the main cause of
death from cancer. According to the World Health
Organization (WHO), the global cancer incidence ex-
ceeded 19 million cases, reaching almost 10 million
deaths in 2020 (WHO, 2022). In 2022, Breast Can-
cer (BC) occupied the second position for incidence
and ranked fourth place for mortality, as reported
by the International Agency for Research on Cancer
(IARC) (IARC, 2023).
To reach a diagnosis, the immunohistochemistry
(IHC) process analyses the biopsy samples concern-
ing the Estrogen Receptor (ER) and the Proges-
a
https://orcid.org/0009-0003-8417-7179
b
https://orcid.org/0009-0003-2282-3606
c
https://orcid.org/0000-0002-7871-4463
d
https://orcid.org/0000-0002-7271-2774
e
https://orcid.org/0000-0002-8198-0877
terone Receptor (PR) biomarkers. These receptors
are proteins inside or on cells that can bind to certain
substances in the blood (American Cancer Society,
2021), leading cancerous cells to overexpress them
and thereby promote uncontrolled cell growth (Yip
and Rhodes, 2014).
The Allred score assesses the hormone receptor
expression by summing up the Proportion Score (PS),
which indicates the relative proportion of cancer cells
in the tissue (Mouelhi et al., 2018), and the Intensity
Score (IS), which evaluates the intensity of cell stain-
ing (Kim et al., 2016). The PS score ranges from 0 to
5, and the IS score has values 0 (negative), 1+ (weakly
positive), 2+ (moderately positive), and 3+ (strongly
positive) (Rogalsky et al., 2021). Since the score re-
lies on the pathologist’s or histopathologist’s experi-
ence and professional training, this process is suscep-
tible to human error and fatigue, which may lead to
misdiagnoses (Han et al., 2017).
The creation of Whole-Slide Images (WSIs)
marked the beginning of the pathology digital era and
prompted researchers to automate diagnosis and assist
in IHC image reporting (Laurinavicius et al., 2016).
In this context, automatic classification to categorize
Train, G. P., Rogalsky, J. E., Ioshii, S. O., Azevedo-Marques, P. M. and Oliveira, L. F.
Exploring Histopathological Image Augmentation Through StyleGAN2ADA: A Quantitative Analysis.
DOI: 10.5220/0013382300003912
Paper published under CC license (CC BY-NC-ND 4.0)
In Proceedings of the 20th International Joint Conference on Computer Vision, Imaging and Computer Graphics Theory and Applications (VISIGRAPP 2025) - Volume 3: VISAPP, pages
839-846
ISBN: 978-989-758-728-3; ISSN: 2184-4321
Proceedings Copyright © 2025 by SCITEPRESS – Science and Technology Publications, Lda.
839

the characteristics of the disease more specifically and
segmentation to determine the location of cancer cells
in IHC images have emerged (Mouelhi et al., 2018;
Cordeiro et al., 2018; Tang et al., 2019; Rogalsky
et al., 2021; Rmili et al., 2022; Mridha et al., 2022;
Choi et al., 2023; Krinski et al., 2023).
Recent interest from IHC medical imaging re-
searchers has led to significant progress. Al-
though, challenges remain for medical image sets
as they often lack variability and have imbalanced
classes (Mukherkjee et al., 2022). However, data aug-
mentation techniques with image-processing methods
and the generation of synthetic images provided by
Generative Adversarial Networks (GANs) are helping
to address these issues by generating new synthetic
images from existing datasets (Krinski et al., 2023;
Osuala et al., 2023).
Therefore, to enhance the automation of
breast cancer diagnosis, we investigated the Style-
GAN2ADA network to generate images for each
class of the IS score to produce high-quality medical
data. Then, we compare them with the AutoAugment
model generated images. In addition, we defined and
applied four classification methods to categorize the
Estrogen Receptor (ER) and Progesterone Receptor
(PR) biomarkers patches. To this end, we performed
a quantitative analysis of the results, combining data
augmentation techniques and classification methods
and evaluating them through f1-score.
2 MATERIALS AND METHODS
2.1 Datasets
In this paper, we used the dataset from the Rogal-
sky study (Rogalsky, 2021), which includes IHC-
DAB WSIs from 78 patients evaluated for ER and
PR biomarkers. The author provided 1801 (ER) and
1625 (PR) patches with a dimension of 400x300 pix-
els, selected from a ROI with 40x increase (discard-
ing non-pathogenic regions). Each patch received the
cancer intensity score (IS) according to the opinion
of experts. Fig. 1 presents image samples from both
datasets (first row), and Table 1 shows the IS class
distributions.
Table 1: Distribution of IS classes from Estrogen Receptor
(ER) and Progesterone Receptor (PR) images that compose
the HistoBC-HR dataset of Rogalsky (2021).
Exam Type 0 1+ 2+ 3+ Total
ER 414 149 293 945 1801
PR 515 171 226 713 1625
2.2 Data Augmentation
Medical image datasets often have low variability and
high imbalance between classes (Mukherkjee et al.,
2022). For instance, our dataset presented a limitation
in the number of samples as class 1+ has only 149 ex-
amples, and, at the same time, class 3+ contains 945
images, demonstrating the imbalance between classes
1+ and 3+. Data Augmentation (DA) techniques have
recently addressed these challenges, including image-
processing methods and synthetic image generation
provided by GANs as well (Osuala et al., 2023). In
this paper, we investigated two techniques: AutoAug-
ment and StyleGAN2ADA (step 1 in Fig. 2).
2.2.1 AutoAugment
In the context of our research, we used AutoAugment
provided by the Pytorch library, comprised of pre-
trained weights on the CIFAR-10 dataset. The idea of
AutoAugment is to automate the search for data aug-
mentation policies, optimizing the selection of trans-
formations, the probability of applying them, and the
magnitude of the operation. We considered trans-
formations such as rotations, translations, brightness
adjustments, color changes, and equalizations with
different probabilities of use and magnitudes. We
chose the pre-trained AutoAugment to compose these
image-processing forms of data augmentation, using
operations without requiring manual adjustments to
determine which ones to apply and at what magni-
tudes. For more details about the transformations,
consult Cubuk et al. (2019).
2.2.2 StyleGAN2ADA
Generative Adversarial Networks (GANs) are recent
techniques for generating synthetic images, consist-
ing of two networks: a generator that creates new im-
ages and a discriminator that distinguishes real from
fake (Osuala et al., 2023). Amidst current archi-
tectures, the Style Generative Adversarial Network
with Adaptive Discriminator Augmentation (Style-
GAN2ADA) stand out for generating high-quality im-
ages and addressing the overfitting issues of its pre-
decessors. This network tackles the challenges aris-
ing from limited datasets by incorporating image-
processing data augmentation techniques during the
training process, thereby diversifying and increasing
the number of dataset samples (Karras et al., 2020).
To evaluate the StyleGAN2ADA, we separated
the same-class images from the dataset, forming four
training sets (0, 1+, 2+, and 3+) for each type of
exam (ER and PR). Then, we trained a specific Style-
GAN2ADA for each class and generated new syn-
VISAPP 2025 - 20th International Conference on Computer Vision Theory and Applications
840
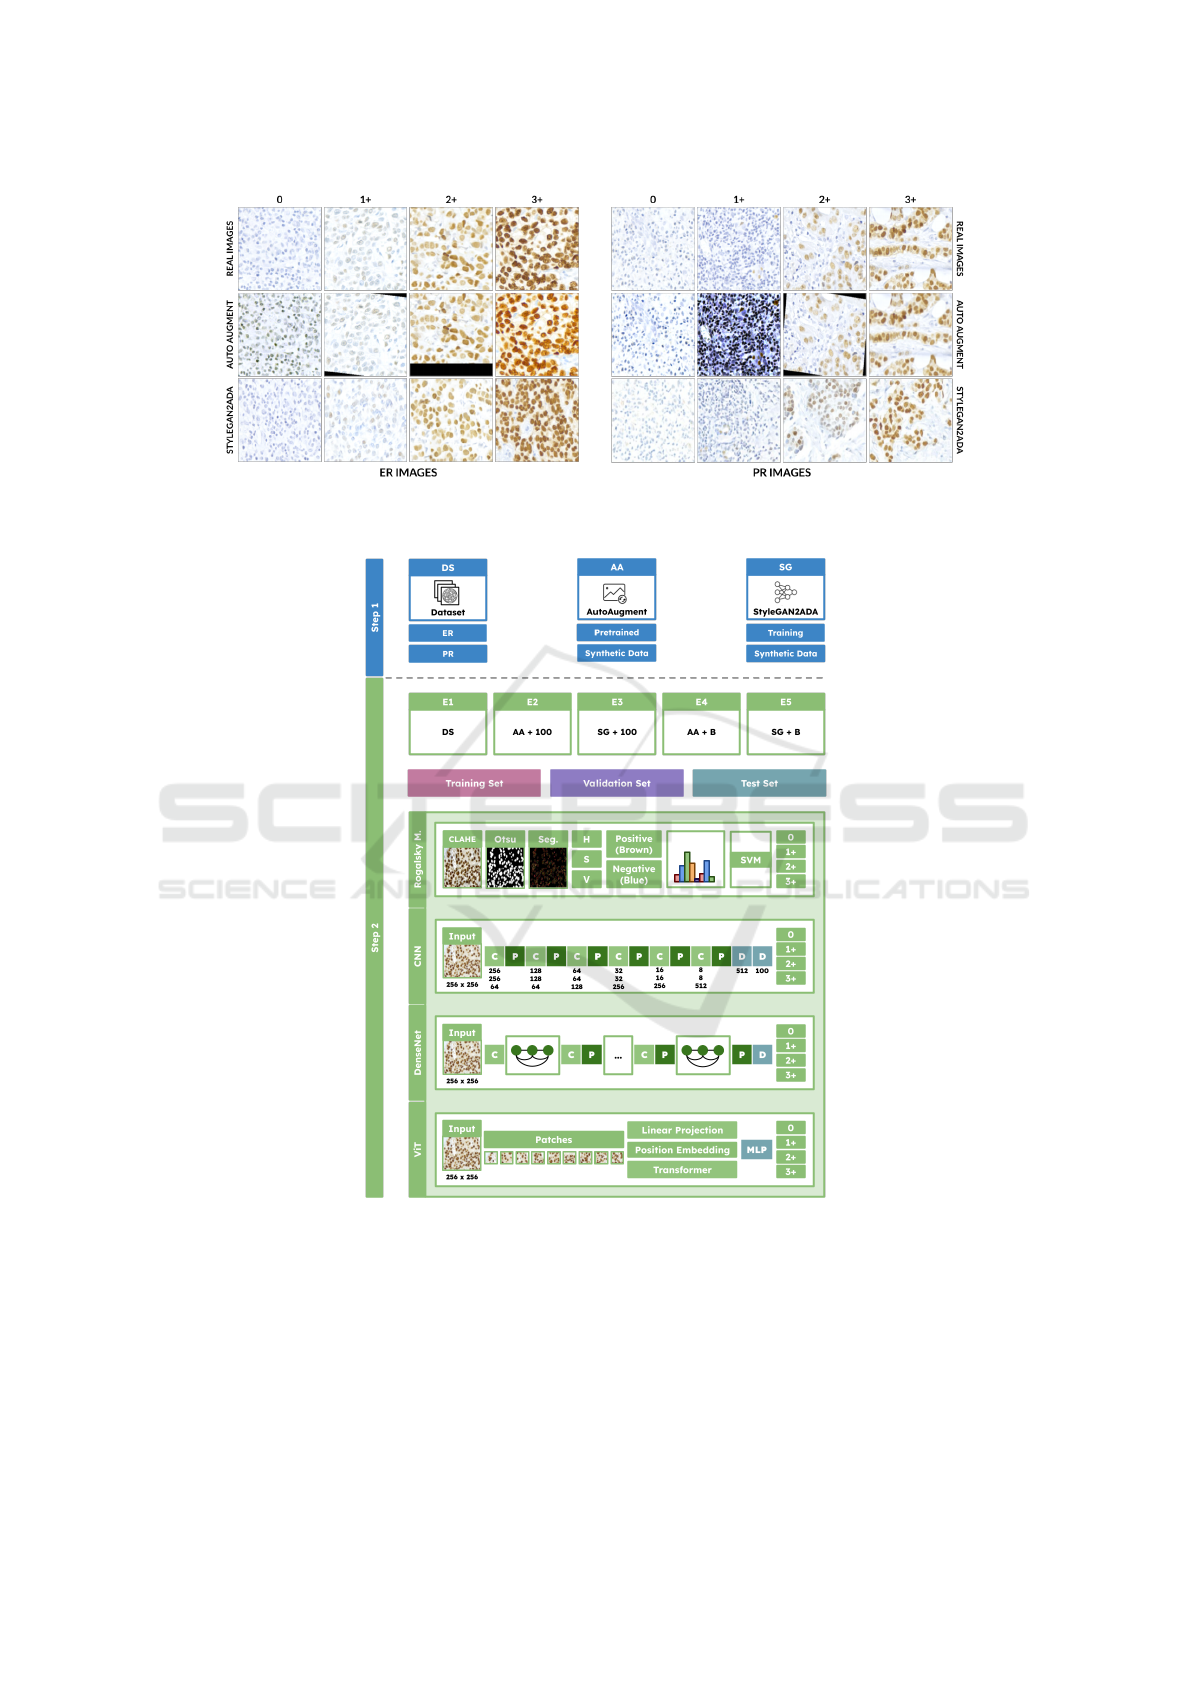
Figure 1: Examples of real images, synthetic images obtained by AutoAugment, and images generated by StyleGAN2ADA
on the Estrogen Receptor (ER) and Progesterone Receptor (PR) dataset.
Figure 2: Overview of the proposed work. Step 1 uses the ER and PR image datasets, applying AutoAugment (AA) with
pre-trained weights for data augmentation, and also trains a StyleGAN2ADA (SG) to generate synthetic data for each IS class.
Step 2 organizes the data into five experiments: E1, consisting solely of the original dataset; E2, the original dataset with the
addition of 100 images produced by AA to the training set; E3, the original dataset with 100 synthetic images generated by
SG; E4, with class balancing in the training set using AA-generated images; and E5, also balancing the classes but using
SG-generated images. Based on these experiments, cross-validation defines the training, validation, and testing sets, with
the validation and testing sets consisting of real data. Finally, IS score classification uses the Rogalsky Methodology, CNN,
DenseNet, and ViT models (’C’ stands for Convolution, ’P’ for Pooling, and ’D’ for Dense Layer). The evaluation of the
experiments was performed using the f1-score.
Exploring Histopathological Image Augmentation Through StyleGAN2ADA: A Quantitative Analysis
841

thetic images of both biomarkers and all intensity
scores. In this step, we used the Pytorch library
to implement StyleGAN2ADA, with 1500 training
epochs and 0.5 as the data augmentation hyperpa-
rameter (truncation) to create new artificial images.
We defined these values after running smaller experi-
ments on a validation set.
2.3 Classification
2.3.1 Rogalsky Methodology (RM)
As a first step to achieve the IS classification, we
adapted the methods proposed by Rogalsky (Rogal-
sky, 2021). On each patch we applied the Contrast
Limited Adaptive Histogram Equalization (CLAHE)
method followed by a thresholding, starting with a
Gaussian blur filter to flatten gradients and avoid
noise amplifications. Then, we converted the image
to grayscale and passed it through the Otsu technique
(see Fig. 2). With this initial segmentation of the cells,
we transformed the images from the original color
space to the HSV color space, splitting the H, S, and V
channels. After this, we extracted the positive cells (in
brown) and negative cells (in blue) with color decon-
volution (mask values available in Rogalsky (2021)).
From the deconvolution images, we calculated in-
tensity histograms, which underwent MinMax nor-
malization to keep values between 0 and 100. The
intensity histograms served as features for the train-
ing, validation, and test sets. The training stage con-
sisted of passing the training and validation sets to a
Support Vector Machine (SVM) model. During this
phase, the validation set optimized the model’s hy-
perparameters. Finally, we delivered the test set to
the trained SVM and calculated general and per-class
f1-scores. We repeated this process five times, using
the 5-fold cross-validation method.
2.3.2 Proposed CNN
With the rise of IHC WSIs, Deep Learning mod-
els, particularly CNNs, gained prominence for their
ability to automatically extract features, often outper-
forming manually adjusted methods for feature ex-
traction (Cordeiro, 2019; Mridha et al., 2022). Given
this scenario, we proposed a CNN based on the ar-
chitecture from Tang et al. (2019), which uses a
lightweight CNN capable of accurately classifying
IHC images. The patches were normalized and re-
sized to 256x256 pixels, and the architecture included
6 Convolutional and Max Pooling layers, along with
2 Dense layers (Fig. 2). The convolutional layers
had 64, 64, 128, 256, 256, and 512 neurons, with a
dropout rate of 0.2, a learning rate of 0.00008, the
Adam optimizer, early stopping, and the Multi-Label
Soft Margin Loss function. The network outputted the
probability of the image belonging to each IS class,
and its performance was evaluated using the same
method and metric from the RM.
2.3.3 DenseNet Approach
To address vanishing-gradient issues, strengthen fea-
ture propagation, and reduce CNN parameters, the
DenseNet (Densely Connected Convolutional Net-
work) architecture was proposed (Huang et al., 2017).
A key innovation was the use of dense connections
between layers (Dense Blocks), where all layers are
connected, allowing each to receive inputs from all
previous layers and pass features to the next, thereby
enabling more effective learning (Huang et al., 2017).
For our experiments, we implemented DenseNet121,
a 121-layer variation (Fig. 2), using Pytorch and pre-
trained weights from the ImageNet1K dataset, and
performed fine-tuning with early stopping. Hyperpa-
rameters were set according to default values in the
library, with a Cross-Entropy loss function, 224x224
image size, and the Adam optimizer. Regarding the
division of data and metrics, DenseNet followed the
same steps described in the proposed CNN.
2.3.4 ViT Approach
To provide an alternative to CNNs with lower com-
putational costs, the Vision Transformer (ViT) was
proposed in Dosovitskiy et al. (2021). ViT divides
the input image into fixed-sized patches and employs
self-attention mechanisms to capture features at var-
ious levels. This enables the model to understand
both global image context and relationships between
patches (Fig. 2). The classification step is performed
by an MLP with a hidden layer during pre-training
and a single linear layer during fine-tuning (Dosovit-
skiy et al., 2021). We implemented the ViT using
Pytorch and performed fine-tuning with pre-trained
weights from the ImageNet1K dataset. The model
considered normalized 224x224 images, learning rate
of 0.001, Cross-Entropy loss, and Adam optimizer,
along with early stopping to prevent overfitting. Data
division and evaluation metrics followed the approach
described in previous classifiers.
3 EXPERIMENTS
3.1 Cross-Validation Approach
To structure the training process, we opted for the 5-
fold cross-validation, chosen for its ability to provide
VISAPP 2025 - 20th International Conference on Computer Vision Theory and Applications
842

reliable performance estimates with small datasets,
avoiding misinterpretations common with methods
like Holdout (Maleki et al., 2020). This approach
averages results across five combinations of train-
ing, validation, and test sets. Unlike standard cross-
validation, we designated one fold exclusively for
testing, while one of the remaining four training folds
served as validation. This adaptation enhanced the
variance of the test data, offering a more realistic per-
formance estimate while balancing result reliability
with training and execution time.
3.2 Hyperparameter Optimization
After defining the data augmentation and classifica-
tion methods, we optimized key hyperparameters. For
StyleGAN2ADA, we set the truncation factor to 0.5,
balancing increased variance in synthetic images with
the preservation of original features (Karras et al.,
2020), based on experiments with truncation values
between 0.3 and 0.7. For classifiers, we adjusted
the learning rate and implemented early stopping to
mitigate overfitting (Bai et al., 2021). Training halts
if validation loss worsens by more than 10% across
three instances, and the learning rate is halved each
time, enabling finer adjustments. These values were
determined through smaller experiments and learning
curve analysis.
3.3 IS Classification
Regarding the automatic scoring of cancer levels from
Estrogen Receptor (ER) and Progesterone Receptor
(PR) images, we defined five experiments to study the
impact of adding synthetic images on the training pro-
cess of the classification models. For this, we consid-
ered AutoAugment and StyleGAN2ADA as data aug-
mentation methods and selected Rogalsky Methodol-
ogy, CNN, DenseNet, and ViT models to categorize
images into the four IS score values. In the evalua-
tion step, the f1-scores of the test sets from the 5-folds
were aggregated by the mean. We present the descrip-
tions of these experiments below:
• E1 – DS: Training, validation, and testing of the
proposed classification methods with the original
dataset (DS).
• E2 – AA+100: Addition of 100 synthetic images
for each IS class to the original training set, gen-
erated by the AutoAugment model.
• E3 – SG+100: Addition of 100 synthetic images
for each IS class to the original training set, gen-
erated by the StyleGAN2ADA model.
• E4 – AA+B: Balancing of the training set classes
in relation to the majority class using the Au-
toAugment model. After balancing, 100 more
synthetic images were added for each IS class.
• E5 – SG+B: Balancing of the training set classes
in relation to the majority class using the Style-
GAN2ADA model. After balancing, 100 more
synthetic images were added for each IS class.
Table 2 details the number of samples per class
in each experiment. For experiments E2 and E3, we
added 100 synthetic images using AutoAugment and
StyleGAN2ADA, respectively, to evaluate the impact
of a small amount of data augmentation without ex-
ceeding the number of real images in each class. The
minority class in the ER dataset had 123 samples, and
in the PR dataset, 102, prompting the selection of 100
synthetic images. Experiments E4 and E5 aimed to
balance the classes by adding synthetic images un-
til the minority classes matched the majority class,
followed by an additional 100 generated images per
class. All experiments were conducted with four clas-
sifiers, and the results were compared to E1, which
used the original dataset without synthetic images.
Table 2: Number of training samples of each class for all
experiments with the ER and PR datasets.
ER PR
0 1+ 2+ 3+ Total 0 1+ 2+ 3+ Total
DS (E1) 330 123 235 753 1441 319 102 137 417 975
AA+100 (E2) 430 223 335 853 1841 419 202 237 517 1375
SG+100 (E3) 430 223 335 853 1841 419 202 237 517 1375
AA+B (E4) 853 853 853 853 3412 517 517 517 517 2068
SG+B (E5) 853 853 853 853 3412 517 517 517 517 2068
4 RESULTS
The average 5-fold results with the Rogalsky Method-
ology (RM), CNN, DenseNet (DN), and ViT models
for each experiment are presented in Table 3, covering
the f1-score metric from both datasets (ER and PR).
4.1 ER Dataset
Starting with Rogalsky Methodology in the ER
dataset scenario, AutoAugment (E2 and E4) wors-
ened the average f1-scores by 5 and 9 percentage
points, while E3 reduced them minimally (0.31),
and E5 improved them by 0.38 percentage points.
AutoAugment transformations may have introduced
noise or altered the main characteristics of the origi-
nal images, such as coloration and contrast (see sec-
ond row of Fig. 1). This may have transformed the
intensity of the cells, confusing the classifier. Also,
Exploring Histopathological Image Augmentation Through StyleGAN2ADA: A Quantitative Analysis
843

Table 3: Classification methods f1-scores in experiments E1, E2, E3, E4, and E5, considering all IS classes from ER and PR
biomarkers. The blue values show improvements, and the red values indicate worsening compared to the results of experiment
DS. The results refer to the 5-fold averages.
Exam Type Model DS (E1) AA+100 (E2) SG+100 (E3) AA+B (E4) SG+B (E5)
ER
RM 82.86 ± 02.34 77.94 ± 05.12 82.55 ± 02.92 74.33 ± 05.91 83.25 ± 03.06
CNN 71.77 ± 06.88 77.37 ± 04.63 81.20 ± 03.03 65.76 ± 36.92 81.16 ± 04.04
DN 76.88 ± 05.47 77.32 ± 04.95 87.46 ± 03.98 76.93 ± 03.88 80.60 ± 04.08
ViT 82.86 ± 03.43 82.97 ± 02.89 83.68 ± 02.65 82.44 ± 03.03 84.04 ± 03.71
PR
RM 76.36 ± 04.91 69.56 ± 06.81 78.63 ± 04.13 68.23 ± 06.83 77.86 ± 03.01
CNN 57.16 ± 02.80 58.84 ± 03.05 64.69 ± 05.57 69.36 ± 06.49 71.31 ± 03.95
DN 80.47 ± 04.48 80.42 ± 02.77 82.00 ± 02.82 79.34 ± 02.98 81.25 ± 03.37
ViT
91.75 ± 06.35 89.76 ± 05.09 91.76 ± 06.26 89.47 ± 05.59 92.22 ± 06.53
since the SVM does not present problems with imbal-
anced data (Cortes and Vapnik, 1995), adding images
with StyleGAN2ADA did not contribute to or worsen
the model’s performance. Thus, the network synthetic
images outperform AutoAugment and do not harm
the classification process.
With the proposed CNN, synthetic images im-
proved E2, E3, and E5 experiments, with an in-
crease of up to 9 percentage points in E3 using Style-
GAN2ADA. These improvements can be attributed
to the greater variability introduced by synthetic im-
ages (see third row of Fig. 1), which helped general-
ize the model. With AutoAugment, there was a gain
of 5.6 percentage points in E2, but a drop of 6 per-
centage points in E4. Because it is a model with no
pre-trained weights, the CNN was able to stabilize its
training with the addition of images in experiment E2
(ao Huang et al., 2022). However, in the case of E4,
the model began to rely mostly on these synthetic im-
ages, resulting in misclassification between classes.
DenseNet presented the best results among the
evaluated models, consistently outperforming E1,
with an f1-score of 87.46% in E3. The greater depth
of the network layers, the various innovations brought
by the architecture, and the use of pre-trained weights
may have contributed to better performance. How-
ever, E5 had a lower average f1-score compared to
the CNN and the RM. Thus, we emphasize the im-
portance of carefully optimizing the number of syn-
thetic images included in the training set, as a more
complex model does not necessarily guarantee better
performance.
With ViT, f1-scores were higher than 82% in all
experiments, making it the most consistent model. E5
showed the best performance, with a 1.18 percent-
age point improvement. While the improvement was
modest, the synthetic images did not degrade the re-
sults, and given that ViT typically requires millions
of data points to achieve optimal performance, this
highlights the potential of StyleGAN2ADA to support
the learning process effectively. The larger dataset,
class balance, and high-quality synthetic images from
the network could enhance learning by enriching the
training set and stabilizing ViT’s feature extraction
and MLP training (Dosovitskiy et al., 2021).
4.2 PR Dataset
In the analysis of the RM model on the PR dataset,
we noticed that the f1-scores improved in experiments
E3 and E5 (StyleGAN2ADA) compared to E1 (DS).
In contrast, the experiments with AutoAugment (E2
and E4) showed a decline, with a drop of 8 percent-
age points. This suggests that image-processing data
augmentation transformations can be detrimental if
not properly optimized for the specific problem (see
second row of Fig. 1). The experiment using 100
synthetic images from StyleGAN2ADA increased by
2.27 percentage points, demonstrating that these im-
ages can enhance the learning process, even in models
that do not depend on large datasets or class balancing
techniques (Cortes and Vapnik, 1995).
Using the CNN, all experiments with synthetic
image insertion (E2, E3, E4, and E5) improved the
f1-scores compared to the original data experiment.
For class 1+, the CNN initially failed to classify any
test samples in E1 and E2, achieving f1-scores of 0%.
From E3 onward, the model began to succeed, reach-
ing 60% in E5. This trend was reflected in overall
f1-scores, with gains of 14.15 percentage points in
E5 and 12.12 in E4. These results highlight the im-
portance of balancing training sets with synthetic im-
ages, particularly to stabilize learning in models with-
out pre-trained weights (ao Huang et al., 2022).
Regarding DenseNet, we observed that the f1-
scores did not show notable variations in the overall
results. The highest gain was 1.53 percentage points,
reaching an 82% f1-score, making DenseNet the first
classifier to surpass 80% on the PR data. Thus, we
conclude that even though the improvements from
one experiment to another are minor, they are crucial
for more accurate diagnoses in the medical field and
indicate potential advancements in the area with the
use of StyleGAN2ADA.
VISAPP 2025 - 20th International Conference on Computer Vision Theory and Applications
844

Finally, ViT achieved the best results in the re-
search, surpassing a 90% overall f1-score. We ob-
served that experiment E3 maintained the results of
E1, and E5 reached 92.22%, improving the metric by
0.47 percentage points. E2 and E4 reduced the met-
rics, presenting drops of 1.99 percentage points in E2
and 2.28 in E4. The fact that StyleGAN2ADA im-
ages did not harm performance highlights their po-
tential. ViT models require millions of data points
to achieve optimal performance, a requirement unmet
by small datasets. This suggests that synthetic data
could offer a cost-efficient alternative, eliminating the
need for large, annotated real datasets by providing
millions of high-quality synthetic samples.
5 LIMITATIONS
We do not apply the proposal to other datasets with
distinct types of pathologies. Using a network capa-
ble of synthesizing high-quality medical images can
contribute to several areas due to its ability to learn
the concept of images and respect the main charac-
teristics of the data. Also, we do not consider the
use of pre-trained weights in StyleGAN2ADA, al-
though fine-tuning can facilitate the training process
because it starts with information that may be rele-
vant. Finally, we did not carry out interpretability
studies of the feature maps of the generating network
and the CNN-based classifiers. This study would al-
low a greater understanding of which characteristics
the models consider essential to define each class.
6 DISCUSSION
In this research, we conducted an impact study to
evaluate the effect of adding synthetic medical im-
ages into the classification methods training process.
The objective was to classify the cell staining inten-
sity score of patches from ER and PR biomarkers re-
sponsible for breast cancer detection and categoriza-
tion. To achieve this, we generated images with the
StyleGAN2ADA and AutoAugment models and in-
corporated synthetic images into the training process
of four classification models.
In the ER dataset, we achieved the best classifica-
tion results with DenseNet, obtaining an f1-score of
87.46% and improving the metric by 10.58 percent-
age points compared to the experiment with original
data. In the PR dataset, we achieved an f1-score of
92.22% with ViT, along with an increase of 14 per-
centage points with the CNN. Experiments using syn-
thetic images from AutoAugment produced worse re-
sults, with drops of up to 8 percentage points, indi-
cating that simple data augmentation techniques can
interfere with critical features of medical images. On
the other hand, images generated by StyleGAN2ADA
improved the results in most experiments by increas-
ing the variability of the training set and promoting
better generalization of the classifiers.
To the best of our knowledge, our research is the
first in the field to use StyleGAN2ADA in the context
of IHC images. In future work, we aim to evaluate the
proposed methods on other datasets, examine the im-
pact of pre-trained weights on StyleGAN2ADA train-
ing, and apply interpretability studies to facilitate the
adoption of this proposal in clinical environments.
7 CONCLUSIONS
In summary, in the context of breast cancer images
associated with the ER and PR biomarkers, the use
of the state-of-the-art network StyleGAN2ADA im-
proved performance in IS classification by increasing
data variability. In contrast, data augmentation tech-
niques based solely on image-processing, such as the
pre-trained AutoAugment, proved inadequate for this
problem. Furthermore, we emphasize the importance
of carefully selecting the evaluation method in class-
imbalanced scenarios and testing different amounts of
synthetic images added to the training set to ensure re-
liable and robust results.
ACKNOWLEDGEMENTS
This research received financial support from the
Coordenac¸
˜
ao de Aperfeic¸oamento de Pessoal de
N
´
ıvel Superior - Brasil (CAPES) - Finance Code
001 and the Brazilian National Research Coun-
cil (CNPq; grant 441782/2018-3). The work
was submitted to the Ethics Committee on Re-
search conforms with the ethical aspects defined by
the National Health Council’s Resolution 466/2012
(CAAE - 84415418.5.0000.0098 and approval num-
ber 2.568.281).
REFERENCES
American Cancer Society (2021). Breast Can-
cer Hormone Receptor Status. https:
//www.cancer.org/cancer/breast-cancer/
understanding-a-breast-cancer-diagnosis/
breast-cancer-hormone-receptor-status.html.
Exploring Histopathological Image Augmentation Through StyleGAN2ADA: A Quantitative Analysis
845

ao Huang, Z., Sang, Y., Sun, Y., and Lv, J. (2022). A neu-
ral network learning algorithm for highly imbalanced
data classification. Information Sciences, 612:496–
513. https://doi.org/10.1016/j.ins.2022.08.074.
Bai, Y., Yang, E., Han, B., Yang, Y., Li, J., Mao, Y., Niu,
G., and Liu, T. (2021). Understanding and improving
early stopping for learning with noisy labels.
Choi, S., Cho, S. I., Jung, W., Lee, T., Choi, S. J., and
et al. (2023). Deep learning model improves tumor-
infiltrating lymphocyte evaluation and therapeutic re-
sponse prediction in breast cancer. npj Breast Cancer.
https://doi.org/10.1038/s41523-023-00577-4.
Cordeiro, C. Q. (2019). An Automatic Patch-Based Ap-
proach for HER-2 Scoring in Immunohistochemical
Breast Cancer Images. https://acervodigital.ufpr.br/
handle/1884/66131.
Cordeiro, C. Q., Ioshii, S. O., Alves, J. H., and de Oliveira,
L. F. (2018). An Automatic Patch-based Approach
for HER-2 Scoring in Immunohistochemical Breast
Cancer Images Using Color Features. XVIII Simp
´
osio
Brasileiro de Computac¸
˜
ao Aplicada
`
a Sa
´
ude. https:
//doi.org/10.5753/sbcas.2018.3685.
Cortes, C. and Vapnik, V. (1995). Support-vector net-
works. Machine Learning, 20. https://doi.org/10.
1007/BF00994018. Acessado em: 27/03/2023.
Cubuk, E. D., Zoph, B., Man
´
e, D., Vasudevan, V., and Le,
Q. V. (2019). Autoaugment: Learning augmentation
strategies from data. In 2019 IEEE/CVF Conference
on Computer Vision and Pattern Recognition (CVPR).
Dosovitskiy, A., Beyer, L., Kolesnikov, A., Weissenborn,
D., Zhai, X., Unterthiner, T., Dehghani, M., Minderer,
M., Heigold, G., Gelly, S., Uszkoreit, J., and Houlsby,
N. (2021). An image is worth 16x16 words: Trans-
formers for image recognition at scale.
Han, Z., Wei, B., Zheng, Y., Yin, Y., Li, K., and
Li, S. (2017). Breast Cancer Multi-classification
from Histopathological Images with Structured Deep
Learning Model. Scientific Reports. https://doi.org/
10.1038/s41598-017-04075-z.
Huang, G., Liu, Z., Maaten, L. V. D., and Weinberger, K. Q.
(2017). Densely connected convolutional networks.
In 2017 IEEE Conference on Computer Vision and
Pattern Recognition (CVPR), pages 2261–2269, Los
Alamitos, CA, USA. IEEE Computer Society.
IARC (2023). Cancer Today. https://gco.iarc.fr/today/
online-analysis-multi-bars?
Karras, T., Aittala, M., Hellsten, J., Laine, S., Lehtinen, J.,
and Aila, T. (2020). Training Generative Adversar-
ial Networks with Limited Data. https://doi.org/10.
48550/arXiv.2006.06676. Acessado em: 24/04/2023.
Kim, S.-W., Roh, J., and Park, C.-S. (2016). Immuno-
histochemistry for Pathologists: Protocols, Pitfalls,
and Tips. Journal of Pathology and Translational
Medicine 2016; 50: 411-418. https://doi.org/10.4132/
jptm.2016.08.08.
Krinski, B. A., Ruiz, D. V., Laroca, R., and Todt, E. (2023).
DACov: a deeper analysis of data augmentation on the
computed tomography segmentation problem. Com-
puter Methods in Biomechanics and Biomedical En-
gineering: Imaging & Visualization, 0(0):1–18. https:
//doi.org/10.1080/21681163.2023.2183807.
Laurinavicius, A., Plancoulaine, B., Herlin, P., and Lauri-
naviciene, A. (2016). Comprehensive Immunohisto-
chemistry: Digital, Analytical and Integrated. Patho-
biology 2016;83:156-163. https://doi.org/10.1159/
000442389.
Maleki, F., Muthukrishnan, N., Ovens, K., Md, C., and
Forghani, R. (2020). Machine Learning Algorithm
Validation. Neuroimaging Clinics of North America,
30:433–445. http://dx.doi.org/10.1016/j.nic.2020.08.
004. Acessado em: 25/04/2023.
Mouelhi, A., Rmili, H., Ali, J. B., Sayadi, M., Doghri,
R., and Mrad, K. (2018). Fast unsupervised nuclear
segmentation and classification scheme for automatic
allred cancer scoring in immunohistochemical breast
tissue images. Computer Methods and Programs in
Biomedicine. https://doi.org/10.1016/j.cmpb.2018.08.
005.
Mridha, M. F., Morol, M. K., Ali, M. A., and Shovon,
M. S. H. (2022). convoHER2: A Deep Neural Net-
work for Multi-Stage Classification of HER2 Breast
Cancer. AIUB Journal of Science and Engineering
(AJSE). https://doi.org/10.53799/ajse.v22i1.477.
Mukherkjee, D., Saha, P., Kaplun, D., Sinitca, A., and
Sarkar, R. (2022). Brain tumor image generation us-
ing an aggregation of GAN models with style trans-
fer. Sci Rep. 2022; 12: 9141. https://doi.org/10.1038\
%2Fs41598-022-12646-y.
Osuala, R., Kushibar, K., Garrucho, L., Linardos, A.,
Szafranowska, Z., Klein, S., Glocker, B., Diaz, O.,
and Lekadir, K. (2023). Data synthesis and adver-
sarial networks: A review and meta-analysis in can-
cer imaging. Medical Image Analysis, 84:102704.
https://doi.org/10.1016/j.media.2022.102704.
Rmili, H., Mouelhi, A., Solaiman, B., Doghri, R., and
Labidi, S. (2022). A novel pre-processing approach
based on colour space assessment for digestive neu-
roendocrine tumour grading in immunohistochemi-
cal tissue images. Pol J Pathol. 2022;73(2):134-158.
https://doi.org/10.5114/pjp.2022.119841.
Rogalsky, J. E. (2021). Semi-automatic ER and PR scoring
in immunohistochemistry H-BAD breast cancer im-
ages. https://acervodigital.ufpr.br/handle/1884/73470.
Rogalsky, J. E., Ioshii, S. O., and de Oliveira, L. F. (2021).
Automatic ER and PR scoring in Immunohistochem-
istry H-DAB Breast Cancer images. XXI Simp
´
osio
Brasileiro de Computac¸
˜
ao Aplicada
`
a Sa
´
ude. https:
//doi.org/10.5753/sbcas.2021.16075.
Tang, Z., Chuang, K. V., DeCarli, C., Jin, L.-W., Beckett,
L., Keiser, M. J., and Dugger, B. N. (2019). Inter-
pretable classification of Alzheimer’s disease patholo-
gies with a convolutional neural network pipeline.
Nature Communications 10. https://doi.org/10.1038/
s41467-019-10212-1.
WHO (2022). Cancer. https://www.who.int/news-room/
fact-sheets/detail/cancer.
Yip, C.-H. and Rhodes, A. (2014). Estrogen and pro-
gesterone receptors in breast cancer. Future Oncol-
ogy, 10(14), 2293-2301. https://doi.org/10.2217/fon.
14.110.
VISAPP 2025 - 20th International Conference on Computer Vision Theory and Applications
846
