
FEST: A Unified Framework for Evaluating Synthetic Tabular Data
Weijie Niu, Alberto Huertas Celdran, Karoline Siarsky and Burkhard Stiller
Communication Systems Group CSG, Department of Informatics, University of Zurich UZH, CH–8050 Z
¨
urich, Switzerland
Keywords:
Privacy-Preserving Machine Learning, Privacy Metrics, Synthetic Data Generation, Synthetic Tabular Data
Evaluation.
Abstract:
Synthetic data generation, leveraging generative machine learning techniques, offers a promising approach
to mitigating privacy concerns associated with real-world data usage. Synthetic data closely resemble real-
world data while maintaining strong privacy guarantees. However, a comprehensive assessment framework is
still missing in the evaluation of synthetic data generation, especially when considering the balance between
privacy preservation and data utility in synthetic data. This research bridges this gap by proposing FEST, a
systematic framework for evaluating synthetic tabular data. FEST integrates diverse privacy metrics (attack-
based and distance-based), along with similarity and machine learning utility metrics, to provide a holistic
assessment. We develop FEST as an open-source Python-based library and validate it on multiple datasets,
demonstrating its effectiveness in analyzing the privacy-utility trade-off of different synthetic data generation
models. The source code of FEST is available on Github.
1 INTRODUCTION
The rapid growth of Machine Learning (ML) and Ar-
tificial Intelligence (AI) is driving significant changes
in industries like healthcare, finance, and education,
improving decision-making and making operations
more efficient. However, the successful implemen-
tation of these AI technologies depends on access to
large-scale high-quality datasets which are essential
for training complex models. That need for large
datasets comes with several challenges. Firstly, data
scarcity is an issue in certain domains. It can be chal-
lenging to collect sufficient and high-quality data, es-
pecially when missing or incomplete data can affect
the accuracy of AI algorithms. Secondly, collecting
large amounts of data can be expensive, especially
when dealing with sensitive information. Most impor-
tantly, which is the main driving point of this work,
there are significant concerns related to the privacy
and sensitivity of data, such as healthcare or financial
records, when used to train generative AI algorithms.
To address these challenges, synthetic data gen-
eration has been recognized as an effective solution
(Kotelnikov et al., 2023). By generating artificial data
that mimics the statistical properties of real-world
data, synthetic data offers the potential to support
downstream tasks, such as training AI models without
compromising individuals’ privacy. It is often consid-
ered to preserve privacy (Zhao et al., 2024) techni-
cally better. However, the reality is more nuanced.
Synthetic data can still contain personally identifi-
able information about individuals from the original
data and may not achieve complete privacy protec-
tion, so the use of synthetic data remains controver-
sial. While privacy-preserving techniques are crucial,
it is also important to ensure that the synthetic data re-
mains useful for its intended applications. So, finding
a balance between privacy and data utility is essen-
tial. There is a significant research gap on the extent
to which synthetic data can effectively preserve pri-
vacy in combination with data utility.
This paper addresses a comprehensive framework
to assess the privacy and utility of synthetic data gen-
erated by various methods, including Generative Ad-
versarial Networks (GAN), Variational Autoencoders
(VAE), and other machine learning techniques. The
main contributions of this paper include:
• Developing a framework FEST (Framework for
Evaluating Synthetic Tabular Data) that integrates
a diverse set of privacy metrics, encompassing
both attack-based and distance-based measures, to
provide a holistic evaluation of privacy risks. The
framework also includes statistical similarity as-
sessment and machine learning utility assessment.
The FEST is open-sourced (FEST, 2024) for re-
searchers in the community to use in evaluating
synthetic data generation models.
434
Niu, W., Celdran, A. H., Siarsky, K. and Stiller, B.
FEST: A Unified Framework for Evaluating Synthetic Tabular Data.
DOI: 10.5220/0013383700003899
In Proceedings of the 11th International Conference on Information Systems Security and Privacy (ICISSP 2025) - Volume 1, pages 434-444
ISBN: 978-989-758-735-1; ISSN: 2184-4356
Copyright © 2025 by Paper published under CC license (CC BY-NC-ND 4.0)

• Implementing and evaluating the framework on
multiple real-world datasets to demonstrate its ef-
fectiveness in assessing the privacy-utility trade-
off of different synthetic data generation models.
• Providing insights into the strengths and limita-
tions of various privacy metrics and their applica-
bility to different types of synthetic data.
2 RELATED WORK
The generation and evaluation of synthetic data, par-
ticularly for privacy-preserving purposes, is an area of
increasing importance (Sanchez-Serrano et al., ). Ex-
isting research has explored various approaches, in-
cluding GANs (Yale et al., 2020) and VAEs (Lu et al.,
2023). However, concerns remain regarding the effec-
tiveness of these methods in ensuring robust privacy
protection. Studies including (Stadler et al., ) have
challenged the assumption that synthetic data inher-
ently guarantees privacy, highlighting the potential for
re-identification and inference attacks. This empha-
sizes the need for rigorous evaluation frameworks to
assess the true privacy risks associated with synthetic
data.
This gap is further highlighted by comprehensive
surveys including (Bauer et al., 2024), which analyze
numerous synthetic data generation methods but may
not provide a standardized and holistic evaluation
framework. In the context of specific domains, such
as healthcare, research efforts have focused on apply-
ing and evaluating synthetic data generation methods
(Hernandez et al., ).
Many existing studies rely mainly on limited pri-
vacy metrics, such as Distance of Closest Record
(DCR) and Nearest Neighbor Distance Ratio (NNDR)
(Xu et al., 2019), (Zhao et al., 2021), (Kotelnikov
et al., 2023), questioning the effectiveness in evalu-
ating privacy in various contexts. Some papers have
proposed new metrics. For instance, the study(Raab
et al., 2024) have introduced valuable metrics such
as DiSCO and repU, while others have emphasized
the importance of Singling Out, Linkability, and In-
ference risks (Giomi et al., 2022). Yet, they come
with limitations, such as focusing on specific types of
metrics or neglecting considerations of data utility.
3 PRELIMINARIES
A key component of this research is based on the un-
derstanding of synthetic data generation methods. To
thoroughly validate our framework and ensure its ro-
bustness across different data generation techniques,
this study implements and evaluates the following
models: Conditional Tabular GAN (CTGAN), Gaus-
sian Mixture (GM), Gaussian Copula (GC), Copula-
GAN, TVAE, and a Random Model. By applying
these models to real-world datasets and assessing the
privacy and utility of the resulting synthetic data, this
study can gain insights into the strengths and limita-
tions of our framework in diverse scenarios. For each
model, a synthetic dataset of the same size as the orig-
inal one is generated.
3.1 Conditional Tabular GAN
(CTGAN)
CTGAN (Xu et al., 2019) is a specialized GAN de-
signed for synthesizing tabular data, and handling
mixed data types and imbalanced datasets using con-
ditional vectors. It employs a generator to create syn-
thetic samples and a discriminator to distinguish them
from real data. The iterative training process refines
both components until the synthetic data closely re-
sembles the real data.
3.2 Gaussian Mixture (GM)
Gaussian Mixture Models (GM) are statistical mod-
els representing data as a mixture of Gaussian dis-
tributions, each reflecting different subgroups within
the dataset. The model estimates the means, vari-
ances, and mixing proportions using techniques like
the Expectation-Maximization (EM) algorithm. GM
generates synthetic data reflecting the original data’s
structure, particularly useful for data with multiple
peaks or clusters. It is included as a baseline com-
parison to more advanced models.
3.3 Gaussian Copula (GC)
The Gaussian Copula (GC) model is a statistical
method used for generating synthetic data that pre-
serves the correlation structure between variables. It
transforms data into a uniform distribution using the
Cumulative Distribution Function (CDF) and applies
a Gaussian copula to model dependencies. This en-
sures the synthetic data maintains the original corre-
lation patterns. GC is included as another statistical
baseline for comparison.
3.4 CopulaGAN
CopulaGAN, a variation of CTGAN, enhances per-
formance by incorporating a CDF-based transforma-
tion, similar to GC. This allows CopulaGAN to better
FEST: A Unified Framework for Evaluating Synthetic Tabular Data
435

capture complex dependencies and generate more re-
alistic synthetic data by leveraging both statistical and
GAN-based techniques.
3.5 Tabular Variational Autoencoder
(TVAE)
TVAE (Xu et al., 2019) is a Variational Autoencoder
designed for tabular data. It learns a probabilistic
representation of the data, encoding it into a lower-
dimensional latent space and then decoding it to gen-
erate new synthetic data points. This method allows
TVAE to preserve key statistical properties and rela-
tionships of the original data.
3.6 Random Model
The Random Model serves as a baseline, randomly
sampling data points from the original dataset with or
without replacement. With replacement, a data point
can be chosen multiple times; without replacement,
it’s chosen only once, limiting the synthetic dataset to
the original size.
4 METHODOLOGY
This chapter introduces the proposed solution FEST,
a unified framework for the evaluation of synthetic
tabular data generation, encompassing three key pil-
lars: Privacy Assessment, Statistical Similarity As-
sessment, and Machine Learning Utility. The FEST
framework is illustrated in Figure 1.
In this framework, the privacy of synthetic data
will be evaluated using different kinds of met-
rics. This study categorizes the privacy metrics
into Attack-based metrics and Distance-based met-
rics. These include singling out risk, linkability risk,
and inference risk metrics, which help identify how
vulnerable individuals are to re-identification or at-
tribute inference from synthetic data. Distance-based
metrics such as Disclosive in Synthetic Correct Orig-
inal (DiSCO), Replicated Uniques (repU), Nearest-
Neighbor Distance Ratio (NNDR), Distance of Clos-
est Record (DCR) and Nearest-Neighbor Adversarial
Accuracy (NNAA) will also be considered. These
metrics offer detailed insights into how closely syn-
thetic records may resemble real data and the risks as-
sociated with synthetic data generation. Each of these
metrics will be described and analyzed below.
Statistical similarity will be measured using vari-
ous metrics that compare the statistical properties of
the synthetic and original datasets. These metrics will
be elaborated in the following sections. Meanwhile,
machine learning utility, which assesses the ability of
synthetic data to support model training, is discussed.
4.1 Privacy Metrics
Privacy metrics are subdivided into attack-based and
distance-based metrics.
4.1.1 Attack-Based Metrics
To quantify privacy risks based on attacks, this study
includes three attacks, especially based on GDPR
guidelines: Singling Out (S-Out), Linkability (Link),
and Attribute Inference (Inf). Their implementation
follows Anonymeter (Giomi et al., 2022).
• Singling Out Risk. Singling out refers to pin-
pointing a distinct data record from an origi-
nal dataset using a specific attribute combina-
tion. For example, an attacker might identify a
unique combination like a 45-year-old data sci-
entist in ZIP code 12345 in the synthetic data.
While isolating an individual does not necessar-
ily lead to re-identification, it can enable privacy-
compromising attacks (Haque et al., 2022).
• Linkability Risk. Linkability Risk refers to the
potential for different pieces of information about
an individual to be combined in a way that can
identify them. An attacker with knowledge of
some attributes from one source (Dataset A) and
other attributes from another source (Dataset B)
could use the synthetic dataset to match these at-
tributes and identify that they belong to the same
individual from the original dataset (Giomi et al.,
2022).
• Attribute Inference Risk. Attribute inference at-
tack evaluates the risk that an attacker can de-
duce sensitive attributes using synthetic data. The
attacker, having partial knowledge of certain at-
tributes (auxiliary information, AUX), attempts
to infer unknown sensitive attributes of target
records by analyzing the synthetic dataset. For
example, if an attacker knows the age and ZIP
code (AUX) of a target individual from the origi-
nal dataset, the goal is to infer their medical con-
dition (the sensitive attribute) using the synthetic
dataset.
4.1.2 Distance-Based Metrics
Distance-based metrics evaluate privacy by quantify-
ing the similarity (distance) between the original and
synthetic data records.
ICISSP 2025 - 11th International Conference on Information Systems Security and Privacy
436
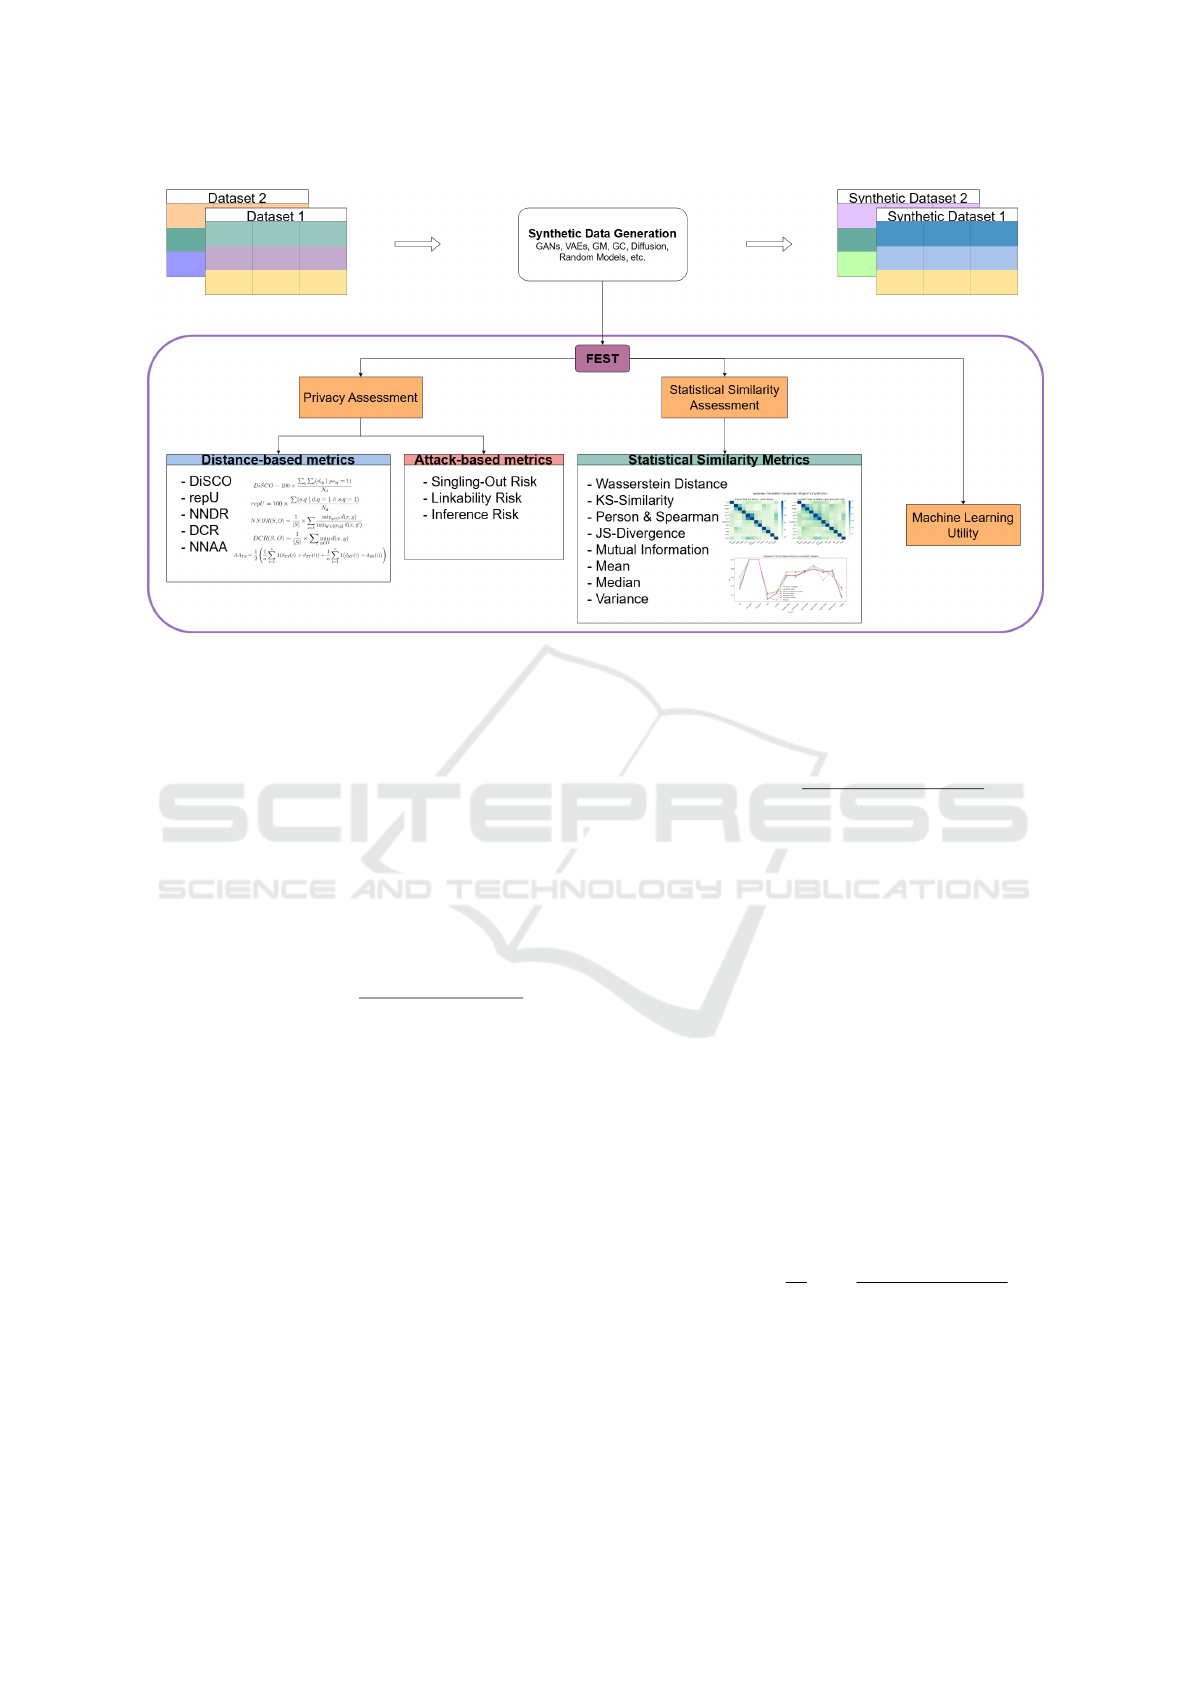
Figure 1: Tree-Based Visualization of the Framework.
• DiSCO: DiSCO assesses attribute disclosure risk
in synthetic data by determining the proportion
of records disclosive in both synthetic and orig-
inal data. A disclosive record can reveal target
attributes about individuals when specific quasi-
identifiers are analyzed (Raab et al., 2024). It
indicates how much sensitive information from
original data can be inferred from the synthetic
data. Quasi-identifiers, while not unique on their
own, can be combined to identify individuals,
such as age, gender and ZIP code (Motwani and
Xu, 2007). The DiSCO metric is calculated as (1):
DiSCO = 100 ×
∑
q
∑
t
(d
tq
| ps
tq
= 1)
N
d
(1)
– q: Quasi-identifiers
– t: Target attribute.
– d
tq
: Distribution of the target attribute in
the original data for a given set of quasi-
identifiers. This represents the frequency or
count of records that have a specific value of the
target attribute t for each combination of quasi-
identifiers q.
– ps
tq
: Proportion of the target attribute in the
synthetic data. This measures the relative fre-
quency or probability that the target attribute t
occurs in the synthetic data for each combina-
tion of quasi-identifiers q.
– N
d
: Total number of records in original data.
• repU: The repU metric measures the risk of iden-
tity disclosure by evaluating the replication of
unique quasi-identifier combinations in synthetic
data. It checks how many unique records from the
original dataset are replicated in synthetic datasets
(Raab et al., 2024). repU is calculated as (2)
repU = 100 ×
∑
(s
q
| d
q
= 1 ∧ s
q
= 1)
N
d
(2)
– s
q
: Value in the synthetic data for a given set
of quasi-identifiers. When s
q
= 1 it means that
the particular combination of quasi-identifiers
in the synthetic data is unique.
– d
q
: Value in the original data for a given set
of quasi-identifiers. When d
q
= 1 it means that
the particular combination of quasi-identifiers
in the original data is unique.
– N
d
: Total number of records in original data.
• NNDR: The NNDR is a metric that evaluates the
relative distances between the data points. The
NNDR is calculated as the ratio of the Euclidean
distance between each record in the synthetic
dataset and its closest corresponding record in
the original dataset to the distance to the second-
closest record. Mathematically, for a synthetic
dataset S and an original dataset O, the NNDR is
calculated as (3):
NNDR(S, O) =
1
|S|
×
∑
x∈S
min
y∈O
d(x, y)
min
y
′
∈{O\y}
d(x, y
′
)
(3)
In this formula:
– d(x, y) represents the Euclidean distance be-
tween records x and y
– min
y∈O
d(x, y) is the distance to the closest
record.
FEST: A Unified Framework for Evaluating Synthetic Tabular Data
437

– min
y
′
∈O\y
d(x, y
′
) is the distance to the second
closest record.
This ratio helps in identifying how isolated a data
point is within the dataset. A lower NNDR in-
dicates that a data point is more isolated, while
a higher NNDR suggests it is in a densely popu-
lated area of the dataset. The values of the NNDR
metric range from 0 to 1.
• DCR: The DCR measures how far each synthetic
data point is from the nearest data point in the
original dataset. This metric is used to assess the
similarity between synthetic and original data. A
DCR of zero means that the synthetic data point
is identical to the original data point, which could
pose a privacy risk. Higher DCR values indi-
cate that the synthetic data is more distinct from
the original data, reducing the risk of privacy
breaches. The value range of DCR is from 0 to
infinity. Different types of distance metrics can be
used to calculate DCR, such as Euclidean distance
(straight-line distance) and Manhattan distance.
FEST implements Euclidean distance. Mathemat-
ically, for a synthetic dataset S and an original
dataset O, the DCR is calculated as (4)
DCR(S, O) =
1
|S|
×
∑
x∈S
min
y∈O
d(x, y) (4)
– d(x, y) represents f.e. the Euclidean distance
between records x and y.
– min
y∈O
d(x, y) is the distance to the closest
record.
• NNAA: Nearest-Neighbor Adversarial Accuracy
assesses synthetic data quality while preserving
privacy. If synthetic data is indistinguishable from
real data, a nearest-neighbor classifier should not
differentiate them. Adversarial Accuracy (AA)
quantifies how well an adversary can distinguish
between real and synthetic data. The NNAA is
calculated as (5):
AA
T S
=
1
2
1
n
n
∑
i=1
1(d
T S
(i) > d
T T
(i))
+
1
n
n
∑
i=1
1(d
ST
(i) > d
SS
(i))
!
(5)
– d
T S
(i): The distance between the i-th record in
the target dataset (T) and its nearest neighbor in
the source dataset (S). This measures how close
an original data point is to its nearest synthetic
counterpart.
– d
ST
(i): The distance between the i-th record
in the source dataset (S) and its nearest neigh-
bor in the target dataset (T). This measures how
close a synthetic data point is to its nearest orig-
inal counterpart.
– d
T T
(i): The distance between the i-th record in
the target dataset (T) and its nearest neighbor
within the target dataset (excluding itself). This
serves as a baseline for comparison within the
original data.
– d
SS
(i): The distance between the i-th record
in the source dataset (S) and its nearest neigh-
bor within the source dataset (excluding itself).
This serves as a baseline for comparison within
the synthetic data.
– 1: An indicator function that takes the value 1
if the condition inside the parentheses is true,
and 0 otherwise.
– n: The total number of records.
An AA score close to 0.5 means that the synthetic
data is indistinguishable from the original data, in-
dicating a good balance of resemblance and pri-
vacy. A higher than 0.5 AA score suggests that
the synthetic data can be easily distinguished from
the original data, which may indicate lower utility
but higher privacy. A lower than 0.5 AA score
suggests overfitting, where the synthetic data re-
semble too closely the original data, potentially
compromising privacy.
4.2 Statistical Similarity Metrics
• Wasserstein Distance: quantifies the cost of
transforming one distribution into another. The
distance can range from 0 to infinity and a smaller
value indicates that the two distributions are more
similar, while a larger value signifies more sub-
stantial differences in the distributions. The
Wasserstein-1 distance can be calculated as fol-
lows (6):
W
1
(P, Q) = inf
γ∈Γ(P,Q)
Z
R
n
×R
n
∥x − y∥dγ(x, y) (6)
– P, Q: the probability distributions
– Γ(P, Q): the set of all joint distributions of P
and Q
– ∥x − y∥: represents the Euclidean distance be-
tween points x and y (in n-dimensions)
– γ(x, y): joint distributions of x and y that rep-
resent the amount of probability mass moved
from x to y.
• Kolmogorov-Smirnov Test: The KS-Test com-
pares the CDFs of two samples, which can be cal-
culated by (7):
D
n,m
= sup
x
|
F
n
(x) − G
m
(x)
|
(7)
ICISSP 2025 - 11th International Conference on Information Systems Security and Privacy
438

where:
– D
n,m
: the KS test statistic;
– sup
x
: the supremum of the set of absolute dif-
ferences;
– F
n
(x): the CDF of the first sample X;
– G
m
(x): the CDF of the second sample Y .
The KS-test statistic ranges from 0 to 1. A value
closer to 0 indicates that the two distributions are
similar, while a value closer to 1 suggests signifi-
cant differences. In our framework, the KS statis-
tic is calculated for each pair of columns in the
original and synthetic datasets. To get an overall
score at the end for each original-synthetic dataset
pair, the mean of the similarity scores is taken (8),
where a higher score indicates better similarity:
Overall Score =
1
N
N
∑
i=1
1 − D
i
n,m
(8)
– N: number of columns
– D
i
n,m
: the KS-Test statistic for the i-th column.
• Pearson & Spearman Correlation: This metric
checks if relationships between variables are pre-
served. The correlation coefficients range from
-1 to 1. A value of 1 indicates a perfect positive
correlation, -1 indicates a perfect negative correla-
tion, and 0 means no correlation. For each pair of
columns A and B, the correlation coefficients for
the original data O
A,B
and synthetic data S
A,B
are
calculated. To calculate the individual similarity
score:
score
A,B
= 1 −
|S
A,B
− O
A,B
|
2
(9)
– S
A,B
: Correlation coefficient for columns A and
B in the synthetic dataset.
– O
A,B
: Correlation coefficient for columns A
and B in the original dataset.
The score
A,B
ranges from 0 to 1, where a score
of 1 indicates that the pairwise correlations of
the real and synthetic data are identical and a
score of 0 implies that the pairwise correlations
are totally different. To calculate the final similar-
ity score for correlations between an original and
synthetic dataset, the mean of all individual simi-
larity scores is taken:
Overall Similarity Score =
1
N
N
∑
i=1
score
i
(10)
– N: Total number of column pairs
– score
i
: Individual similarity scores for each
pair.
• Mutual Information: Pairwise mutual informa-
tion measures the dependency between two at-
tributes within a dataset. It quantifies how much
information knowing one attribute provides about
the other. A higher mutual information value in-
dicates a stronger relationship between the two
attributes, which means that knowing the value
of one attribute reduces the uncertainty about the
value of the other. Normalized Mutual Informa-
tion (NMI) scales the Mutual Information score to
lie between 0 and 1, where 0 means no mutual in-
formation (independence) and 1 indicates perfect
correlation. The calculation of the NMI depends
on the average method chosen for normalization,
in this case, the arithmetic mean. The formula for
NMI is given by (11):
NMI(X,Y ) =
2 · MI(X;Y )
H(X) + H(Y )
(11)
– MI(X;Y ): the mutual information between X
and Y.
– H(X ), H(Y ): the entropies of X and Y, respec-
tively.
To calculate the pairwise mutual information be-
tween attributes X and Y within a dataset (12):
MI(X;Y ) =
∑
y∈Y
∑
x∈X
p(x, y)log
p(x, y)
p(x)p(y)
(12)
– p(x, y): the joint probability distribution of X
and Y.
– p(x)p(y): the marginal probability distribu-
tions of X and Y.
The absolute differences between all NMI pairs
of the synthetic and original dataset are measured
and then, similar to (8), subtracted from 1 to con-
vert it to a similarity score that ranges from 0 to 1
and averaged.
• Jensen-Shannon Similarity: The JS-Divergence
probability distributions. The divergence ranges
from 0 to 1. A value closer to 0 indicates that the
two probability distributions are similar, while a
value closer to 1 suggests significant differences.
For each column, the Jensen-Shannon distance is
calculated and 1 - distance is used to create a sim-
ilarity score, where a higher score indicates better
similarity. For the overall score, the mean of those
scores is calculated.
• Mean, Median, Variance: Basic descriptive
statistics to see if averages and variability match.
These descriptive statistics don’t have fixed
ranges but should be compared directly between
the synthetic and real datasets. Similar values
FEST: A Unified Framework for Evaluating Synthetic Tabular Data
439
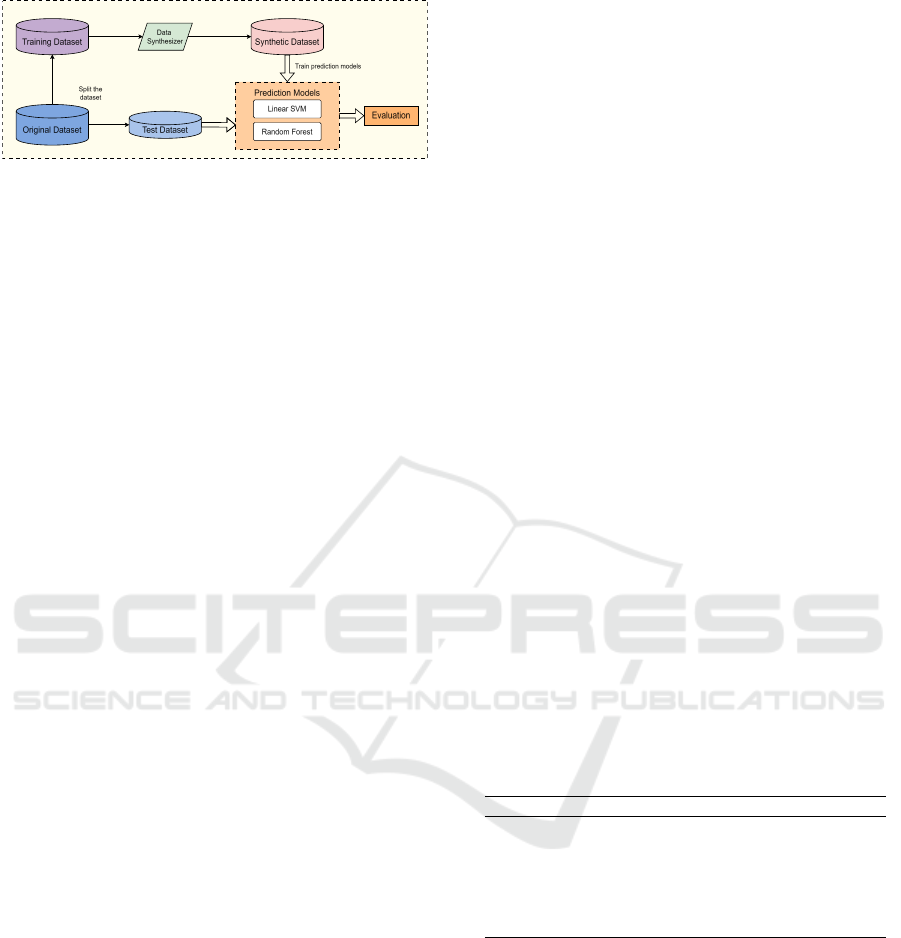
Figure 2: Pipeline for ML Utility Evaluations.
indicate that the averages and variability match
closely, signifying that the synthetic data accu-
rately reflects the properties of the original data.
For the overall score, the average is calculated.
4.3 Machine Learning Utility
This pillar assesses the utility of synthetic data for ma-
chine learning tasks (cf. Figure 2). It evaluates the
ability of synthetic data to support model training and
produce comparable results to models trained on real
data. This is essential to ensure that synthetic data can
effectively replace real data in ML applications with-
out significant performance degradation.
Overall, this framework provides a comprehensive
methodology for evaluating the quality and privacy of
synthetic tabular data generation. By combining pri-
vacy, statistical similarity, and machine learning util-
ity assessments, it ensures that synthetic data can be
effectively and responsibly used in various applica-
tions. The proposed framework is implemented in
Python and open-sourced, visualization functionali-
ties are also included in the framework.
5 EVALUATION EXPERIMENTS
This chapter demonstrates the application of the
FEST framework by evaluating six synthetic data
generation models across three real-world datasets,
serving as a practical use-case and showcasing the
framework’s capabilities in assessing both the utility
and privacy risks associated with synthetic data.
5.1 Datasets and Generation Models
Six synthetic data generation models (Section 3) are
evaluated using FEST across three diverse datasets:
• Diabetes Dataset: A 768-record dataset derived
from the ”National Institute of Diabetes and Di-
gestive and Kidney Diseases” dataset (Dia, ). Fea-
tures include Pregnancies, Glucose, BloodPres-
sure, SkinThickness, Insulin, BMI, DiabetesPedi-
greeFunction, Age, and Outcome.
• Cardio Dataset: A 70,000-record dataset on car-
diovascular disease risk factors (Ris, ), containing
information on age, gender, height, weight, blood
pressure, cholesterol, glucose, smoking, alcohol
consumption, physical activity, and cardiovascu-
lar disease presence.
• Insurance Dataset: A 1,338-record dataset on
medical costs (Med, ), including age, sex, bmi,
children, smoker status, region, and medical costs
billed by insurance.
5.2 Results for the Diabetes Dataset
The privacy assessment run first is followed by the
statistical similarity metrics.
5.2.1 Privacy Assessment
The analysis of distance-based privacy metrics 1 re-
vealed that DiSCO and repU yielded low values for
most models (except Random), suggesting strong pri-
vacy preservation. However, the choice of appropri-
ate quasi-identifiers and targets for these metrics in
this dataset proved challenging. NNDR was high-
est for CopulaGAN, while DCR was highest for CT-
GAN. NNAA was closest to the ideal 0.5 for GMM,
indicating a good balance between privacy and util-
ity. Attack-based privacy metrics 2 showed that the
Random model posed the highest risks, which does
make sense because the model simply sampled from
the original dataset.
Table 1: Comparison of Models Across Different Distance-
Based Privacy Metrics for the Diabetes Dataset.
Model DiSCO repU NNDR DCR NNAA
CopulaGAN 0.00 0.00 0.90 0.28 0.82
CTGAN 0.00 0.00 0.89 0.30 0.77
GC 0.00 0.00 0.89 0.21 0.72
GM 0.00 0.00 0.88 0.24 0.60
TVAE 0.00 0.00 0.86 0.16 0.70
Random 100.00 100.00 0.00 0.00 0.00
5.2.2 Statistical Similarity Assessment
The synthetic data exhibited high statistical similar-
ity to the original data. This was evident in high KS,
P&S Corr, MI, and JS values. For mean, median, and
variance, the difference values are relatively low as
well, with TVAE having the lowest (besides random),
which measures average distances between real and
synthetic statistics. Additionally, plots were made to
visualize these means for each column for the original
dataset, compared to the means of the columns from
all synthetic datasets. An example is shown in 3.
ICISSP 2025 - 11th International Conference on Information Systems Security and Privacy
440
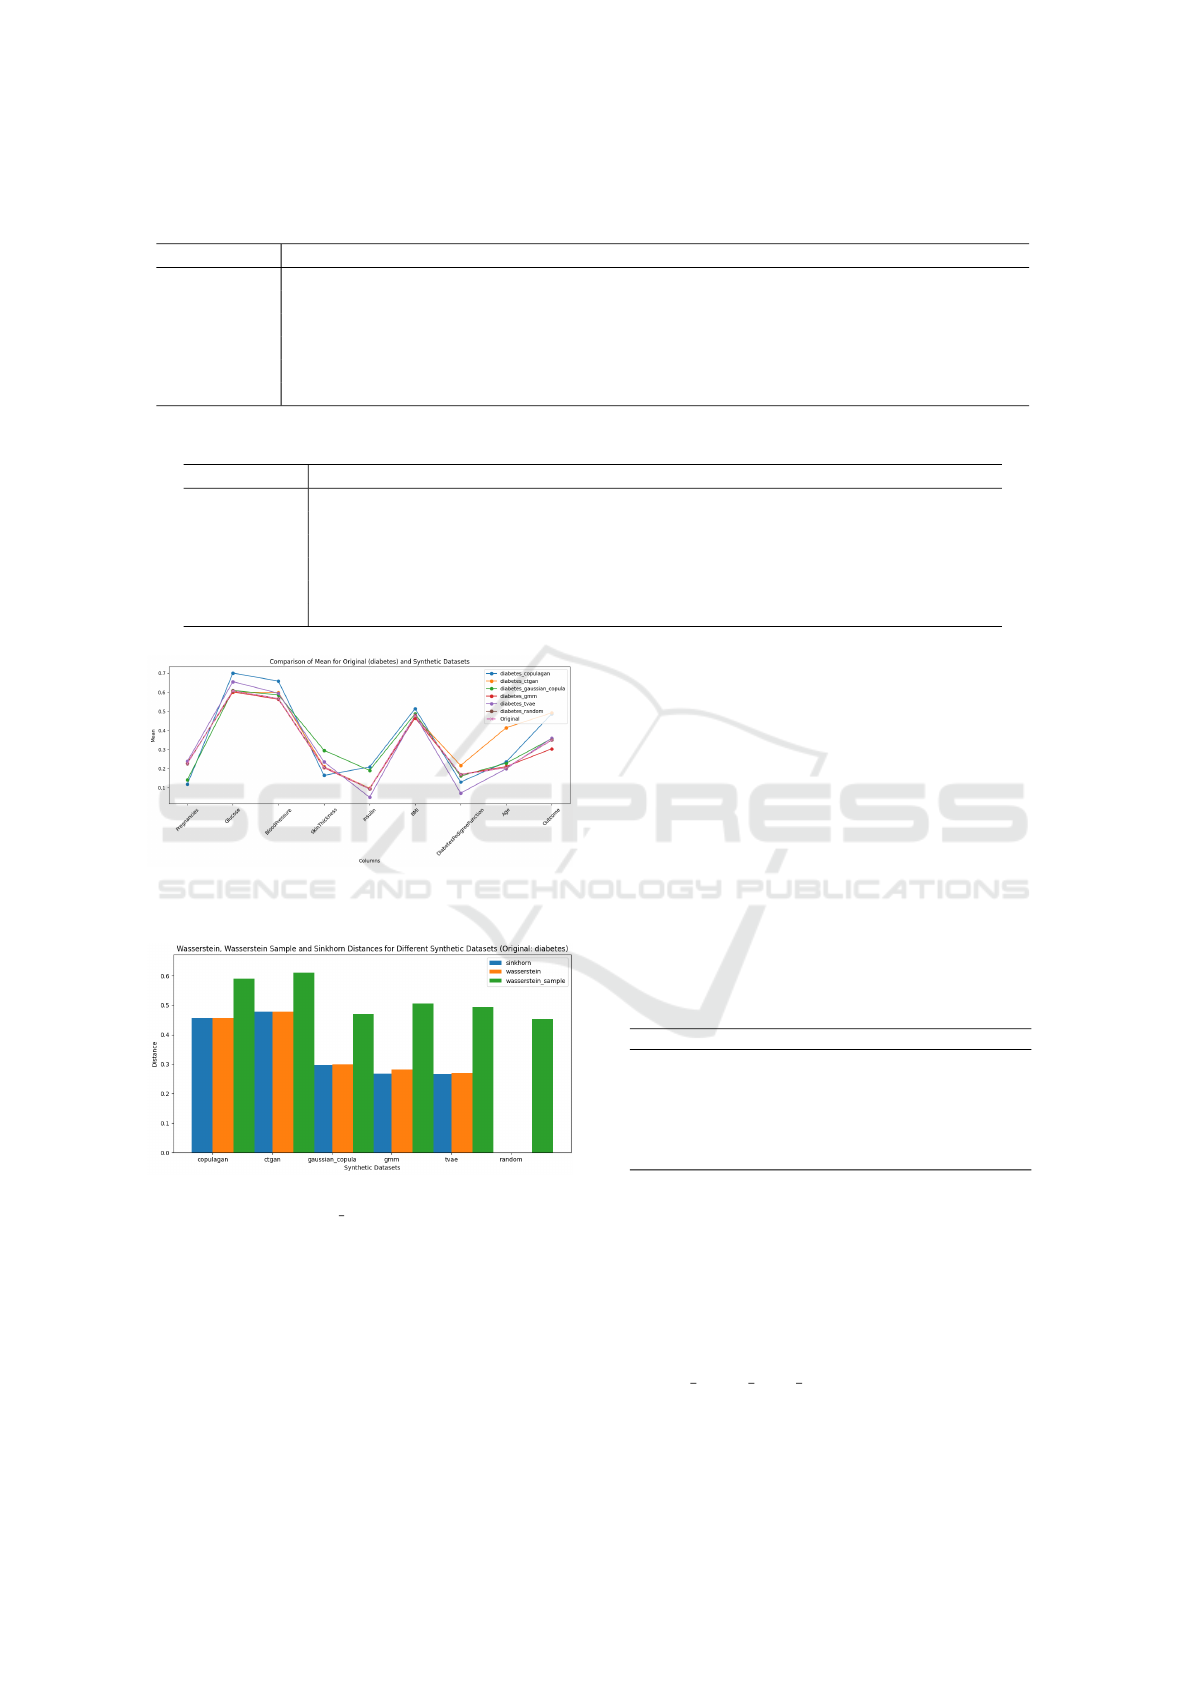
Table 2: Comparison of Models on Singling Out Risk, Linkability Risk, and Inference Risk with Respective Confidence
Intervals for the Diabetes Dataset.
S-Out Link Inf
CopulaGAN 0.1174,CI=(0.0863, 0.1485) 0.0316,CI=(0.0168, 0.0464) 0.1214,CI=(0.0, 0.2710)
CTGAN 0.1347,CI=(0.1024, 0.1670) 0.0336,CI=(0.0182, 0.0489) 0.1781,CI=(0.0, 0.4307)
GC 0.1735,CI=(0.1380, 0.209) 0.0574,CI=(0.0374, 0.0774) 0.4500,CI=(0.2214, 0.6804)
GMM 0.1236, CI=(0.0929, 0.1543) 0.0455,CI=(0.0276, 0.0634) 0.2819,CI=(0.0, 0.5961)
TVAE 0.1662, CI=(0.1293, 0.2031) 0.0514,CI=(0.0325, 0.0704) 0.0858,CI=(0.0, 0.2127)
Random 0.9961,CI=(0.9923, 1.0) 0.9962,CI=(0.9924, 1.0) 0.9754,CI=(0.9507, 1.0)
Table 3: Comparison of Models Across Different Utility Metrics for the Diabetes Dataset.
WS KS P&S Corr MI JS (Mean, Median, Var)
CopulaGAN 0.4557 0.7477 [0.9255; 0.9201] 0.9728 0.7818 (0.0772, 0.0676, 0.0113)
CTGAN 0.4774 0.8422 [0.9207; 0.9154] 0.9707 0.8130 (0.0592, 0.0344, 0.0139)
GC 0.2994 0.8556 [0.9692; 0.9642] 0.9717 0.8277 (0.0377, 0.0398, 0.0062)
GMM 0.2814 0.9194 [0.9862; 0.9772] 0.9617 0.8287 (0.0092, 0.0263, 0.0069)
TVAE 0.2699 0.8588 [0.9518; 0.9462] 0.9819 0.8440 (0.0304, 0.0273, 0.0089)
Random 0.0000 1.0000 [1.0000; 1.0000] 1.0000 1.0000 (0.0, 0.0, 0.0)
Figure 3: Mean of Diabetes Dataset Compared to Means of
Synthetic Datasets.
Figure 4: Comparison of Wasserstein Distance Methods
(Wasserstein, Wasserstein SAMPLE = 20, SINKHORN)
for Diabetes Dataset.
5.3 Results for the Cardio Dataset
The privacy assessment run first is followed as well
by the statistical similarity metrics.
5.3.1 Privacy Assessment
As shown in Table 4, DiSCO and repU remained
low for all models (except Random). For this
dataset, the following quasi-identifiers and target was
chosen: keys = [’age’, ’gender’, ’height’,
’weight’, ’cholesterol’, ’gluc’], target
= "cardio". The DCR and NNAA values for this
dataset are lower than for the diabetes dataset, which
means that the distances between the synthetic and
original dataset are smaller and that privacy & utility
are balanced better. This could be due to this dataset
being way larger than the diabetes dataset.
Table 4: Comparison of Models Across Different Distance-
Based Privacy Metrics for the Cardio Dataset.
DiSCO repU NNDR DCR NNAA
CopulaGAN 0.00 0.00 0.76 0.02 0.65
CTGAN 0.00 0.00 0.75 0.03 0.69
GC 0.00 0.00 0.80 0.03 0.64
GMM 0.00 0.00 0.81 0.16 0.64
TVAE 0.00 0.00 0.76 0.01 0.63
Random 100.00 100.00 0.00 0.00 0.00
For the Singling Out risk, 1000 samples were
taken from the synthetic and original dataset due to
the large number of entries in the cardio dataset, so
the risk might not be representative of the actual risk,
with no control dataset. But based on the given num-
bers in 5, the lowest risk was calculated for the GMM.
For the Linkability risk, the train and
test datasets were used as calculated by
dynamic train test split. Due to the large
dataset, 1,000 records were sampled. For the number
of attacks, a higher number of 2,000 was chosen, as
FEST: A Unified Framework for Evaluating Synthetic Tabular Data
441

Figure 5: Spearman Correlation Heatmap: Comparison be-
tween Cardio Dataset and Synthetic Dataset generated with
TVAE.
well as for the number of neighbors as 10, instead
of the default value of 1 to achieve a higher number.
Attack-based privacy metrics (Table 5) showed
generally low risks, except for the Random model.
5.3.2 Statistical Similarity Metrics
For the Wasserstein distance in Table 6, the Sinkhorn
approximation was used because the dataset was too
large and complex. All other metrics were computed
normally. For the other metrics KS, P&S Corr, MI
and JS, this study can see that the results are again
high, close to 1 which supports statistical similarity.
As a visualization, the heatmap of the Spearman cor-
relation of both the synthetic (generated with TVAE)
and original dataset was included Figure 5. The cor-
relations are quite comparable, though there are slight
variations. For instance, certain regions of the syn-
thetic data heatmap appear lighter, indicating a re-
duced correlation between the columns.
For this dataset, the values in the (Mean, Median,
Var) column are closer to zero compared to the di-
abetes dataset. This might be attributed to having a
larger amount of data available to produce synthetic
samples that match the original distribution, along
with having more records overall.
5.4 Results for the Insurance Dataset
The privacy assessment run first is followed again by
the statistical similarity metrics.
5.4.1 Privacy Assessment
As can be seen in 7, the values of DiSCO are again
almost all 0, which raises the question if the quasi-
identifiers and the target were chosen in a wrong
way, or if the DiSCO is unsuitable for such kind of
datasets. The quasi-identifiers were chosen as keys
= [’age’, ’bmi’, ’children’] with target =
charges. The insurance dataset may be of medium
size but does not have as many attributes to find ap-
propriate quasi-identifiers. Users can choose their
Figure 6: Barplot of the KS-Similarity Scores of Different
Synthetic Datasets.
own quasi-identifier with the proposed framework.
The repU was highest for TVAE. NNDR, DCR, and
NNAA results were comparable to the other datasets.
For the NNDR, DCR and NNAA, the results are very
similar as in the other two datasets.
All singling out risks are around 0.1-0.15, except
for the random model having a risk of basically 1. For
the linkability risk, the following auxiliary columns
were chosen: aux cols i = (["age", "sex",
"bmi"], ["children", "smoker", "region",
"charges"]). In this calculation, the number of
attacks had to be lowered to 260 due to the test dataset
being smaller than the default value of 500. The
number of neighbors was chosen as 10, the number
of attacks as 2000. The final risks are really low,
which raises the question of whether the linkability
risk can be accurately measured for this dataset and
selection of parameters.
5.4.2 Statistical Similarity Assessment
Two plots, Figure 6 and 7, were provided as exam-
ples for the results found in Table 9. The WS of Table
9 has higher values compared to Table 6, but similar
scores for all other columns. The KS similarity scores
are visualized as a bar graph, with the Gaussian cop-
ula having the highest overall score with 0.9727, af-
ter the Random Model with 1.0. Another example,
depicted in 7, shows the heatmap of the normalized
mutual information outcomes of the insurance and
the synthetic dataset generated with CopulaGAN. The
finer regions seen in the heatmap on the left are less
detailed compared to those on the right.
5.5 Summary and Discussion of the
Experiments
The FEST framework demonstrated several key ad-
vantages:
• Comprehensiveness: It encompasses a wide range
of privacy and utility metrics, providing a holistic
evaluation.
ICISSP 2025 - 11th International Conference on Information Systems Security and Privacy
442
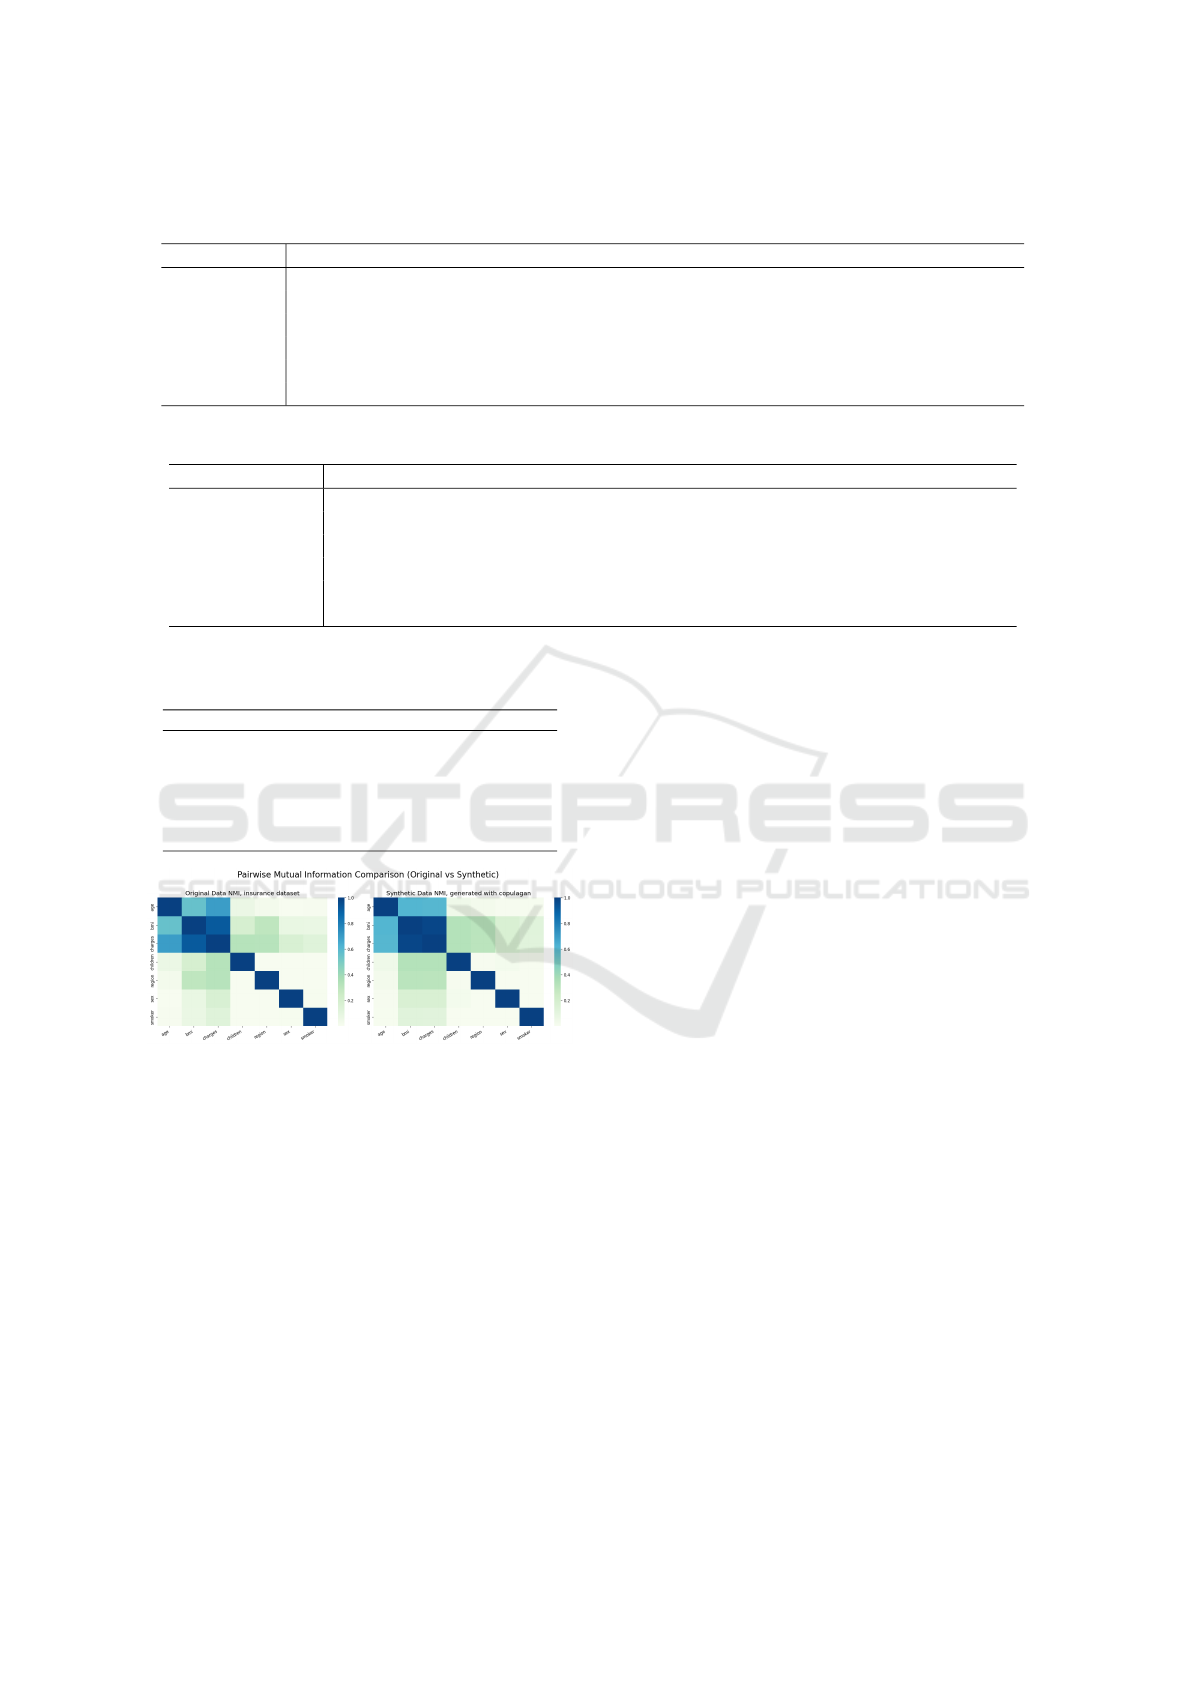
Table 5: Comparison of Models on Singling Out Risk, Linkability Risk, and Inference Risk with Respective Confidence
Intervals for the Cardio Dataset.
S-Out Link Inf
CopulaGAN 0.1924,CI=(0.158,0.2267) 0.0,CI=(0,0.0021) 0.0511,CI=(0.0293,0.0729)
CTGAN 0.2182,CI=(0.1822,0.2542) 0.0025,CI=(0,0.0060) 0.0361,CI=(0, 0.0805)
GC 0.0792,CI=(0.0559,0.1026) 0.0010,CI=(0,0.0050) 0.0349,CI=(0.0047,0.0651)
GMM 0.0971,CI=(0.0714,0.1228) 0.0020,CI=(0,0.0054) 0.0141,CI=(0,0.0706)
TVAE 0.2281, CI=(0.1915,0.2647) 0.0, CI=(0,0.0028) 0.0278, CI=(0,0.0712)
Random 0.2281, CI=(0.1915,0.2647) 0.1543, CI=(0.1382,0.1705) 0.9994, CI=(0.9988, 1.0)
Table 6: Comparison of Models Across Different Utility Metrics for the Cardio Dataset.
WS KS P&S Corr MI JS (Mean, Median, Var)
CopulaGAN 0.2758 0.9479 [0.9598, 0.9602] 0.9889 0.8888 (0.0197, 0.0886, 0.0093)
CTGAN 0.4430 0.8865 [0.9716, 0.972] 0.9841 0.7784 (0.0465, 0.0075, 0.0254)
GaussianCopula 0.2461 0.9321 [0.9734, 0.9683] 0.9779 0.8179 (0.0007, 0.0846, 0.0005)
GMM 0.3037 0.9369 [0.996, 0.9921] 0.973 0.7758 (0.0025, 0.0861, 0.0223)
TVAE 0.2204 0.9412 [0.9805, 0.9785] 0.9861 0.8476 (0.0158, 0.0859, 0.0095)
Random 0.1777 1.0000 [1.0000:1.0000] 1.0000 1.0000 (0.0, 0.0, 0.0)
Table 7: Comparison of Models Across Different Distance-
Based Privacy Metrics for the Insurance Dataset.
DiSCO repU NNDR DCR NNAA
CopulaGAN 0.00 0.07 0.84 0.28 0.75
CTGAN 0.00 0.00 0.83 0.27 0.73
GC 0.00 0.07 0.79 0.17 0.62
GMM 0.00 0.00 0.77 0.14 0.58
TVAE 0.00 0.15 0.75 0.11 0.69
Random 98.65 98.51 0.00 0.00 0.00
Figure 7: Comparison of NMIs of Insurance and Synthetic
Dataset Generated with CopulaGAN.
• Flexibility: The framework can be adapted to dif-
ferent datasets and evaluation scenarios by adjust-
ing parameters and incorporating new metrics.
• Interpretability: The results from FEST are rela-
tively easy to interpret and compare across mod-
els, aiding in model selection and refinement.
The results provide insights into the privacy and
utility trade-offs associated with different models and
datasets. The framework’s flexibility and compre-
hensiveness make it a valuable tool for researchers
and practitioners in the field of synthetic data gener-
ation. The evaluation also highlighted the limitations
of specific metrics, such as DiSCO and repU, partic-
ularly when dealing with smaller datasets or in the
absence of suitable quasi-identifiers. Future research
will focus on refining these metrics and expanding
the framework to include additional evaluation tech-
niques.
6 CONCLUSIONS
This research presents FEST, a framework for com-
prehensively evaluating the privacy and utility of syn-
thetic tabular data. FEST addresses the limitations
of existing evaluation methods by integrating a di-
verse set of privacy metrics, including distance-based
measures (DiSCO, repU, NNDR, DCR, NNAA) and
attack-based metrics (Singling Out Risk, Linkability
Risk, Inference Risk). These are combined with util-
ity metrics such as Wasserstein Distance, KS test,
Pearson and Spearman Correlation, Mutual Infor-
mation, and Jensen-Shannon Similarity to provide a
holistic assessment of synthetic data quality.
Through the evaluation on three diverse datasets
(Diabetes, Cardio, and Insurance), FEST demon-
strated its effectiveness in analyzing the trade-offs be-
tween privacy and utility for various synthetic data
generation models, including CopulaGAN, CTGAN,
GaussianCopula, GMM, TVAE, and a Random base-
line. The results highlighted the importance of con-
sidering a wide range of metrics to gain a comprehen-
sive understanding of the strengths and weaknesses of
different synthetic data generation techniques.
By providing a standardized and flexible frame-
work, FEST empowers researchers and practitioners
to make informed decisions about the suitability of
synthetic data for specific applications.
FEST: A Unified Framework for Evaluating Synthetic Tabular Data
443

Table 8: Comparison of Models on Singling Out Risk, Linkability Risk, and Inference Risk with Respective Confidence
Intervals for the Insurance Dataset.
S-Out Link Inf
CopulaGAN 0.1249, CI=(0.0962, 0.1536) 0.0128, CI=(0.0, 0.073) 0.0414, CI=(0.0, 0.1957)
CTGAN 0.1090, CI=(0.0820, 0.1361) 0.0, CI=(0.0, 0.011) 0.02042, CI=(0.0, 0.2415)
GC 0.1566, CI=(0.1250, 0.1883) 0.0, CI=(0.0, 0.0080) 0.0588, CI=(0.0, 0.1252)
GMM 0.1011, CI=(0.0749, 0.1272) 0.01501, CI=(0.0, 0.1113) 0.1025, CI=(0.0069, 0.1980)
TVAE 0.1229, CI=(0.0944, 0.1514) 0.0045, CI=(0.0, 0.0784) 0.2732, CI=(0.0, 0.5786)
Random 0.9962, CI=(0.9924, 1.0) 0.9890, CI=(0.9780, 1.0) 0.9907, CI=(0.9813, 1.0)
Table 9: Comparison of Models Across Different Utility Metrics for the Insurance Dataset.
WS KS P&S Corr MI JS (Mean, Median, Var)
CopulaGAN 0.4444 0.9174 [0.9714, 0.9711] 0.9874 0.9126 (0.0449, 0.0338, 0.0181)
CTGAN 0.4141 0.9207 [0.9676, 0.969] 0.988 0.9236 (0.0415, 0.1931, 0.0136)
GaussianCopula 0.2939 0.9727 [0.9742, 0.9783] 0.9877 0.9666 (0.0158, 0.0047, 0.006)
GMM 0.2450 0.9682 [0.9906, 0.9888] 0.985 0.9353 (0.0104, 0.0035, 0.0034)
TVAE 0.4691 0.9340 [0.9554, 0.9575] 0.9831 0.9341 (0.0349, 0.0295, 0.0136)
Random 0.0000 1.0000 [1.0000;1.0000] 1.0000 1.0000 (0.0, 0.0, 0.0)
ACKNOWLEDGMENTS
This work was partially supported by (a) the Univer-
sity of Z
¨
urich UZH, Switzerland, and (b) the Horizon
Europe Framework Program’s project AISym4MED,
Grant Agreement No.101095387, funded by the
Swiss State Secretariat for Education, Research, and
Innovation SERI, under Contract No.22.00622.
REFERENCES
Diabetes Dataset.
Medical Cost Personal Datasets.
Risk Factors for Cardiovascular Heart Disease.
Bauer, A., Trapp, S., Stenger, M., Leppich, R., Kounev, S.,
Leznik, M., Chard, K., and Foster, I. (2024). Compre-
hensive Exploration of Synthetic Data Generation: A
Survey.
FEST (2024). Implementation of a synthetic tabular data
generation evaluation framework. https://github.com/
Karo2222/synprivutil. [Version 1.0].
Giomi, M., Boenisch, F., Wehmeyer, C., and Tasn
´
adi,
B. (2022). A unified framework for quantify-
ing privacy risk in synthetic data. arXiv preprint
arXiv:2211.10459.
Haque, S., Eberhart, Z., Bansal, A., and McMillan, C.
(2022). Semantic Similarity Metrics for Evaluat-
ing Source Code Summarization. IEEE Interna-
tional Conference on Program Comprehension, 2022-
March:36–47.
Hernandez, M., Epelde, G., Alberdi, A., Cilla, R., and
Rankin, D. Synthetic data generation for tabular
health records: A systematic review.
Kotelnikov, A., Baranchuk, D., Rubachev, I., and Babenko,
A. (2023). Tabddpm: Modelling tabular data with dif-
fusion models. In International Conference on Ma-
chine Learning, pages 17564–17579. PMLR.
Lu, Y., Shen, M., Wang, H., Wang, X., van Rechem, C.,
Fu, T., and Wei, W. (2023). Machine Learning for
Synthetic Data Generation: A Review.
Motwani, R. and Xu, Y. (2007). Efficient Algorithms for
Masking and Finding Quasi-Identifiers.
Raab, G. M., Nowok, B., and Dibben, C. (2024). Practical
privacy metrics for synthetic data.
Sanchez-Serrano, P., Rios, R., and Agudo, I. Privacy-
preserving tabular data generation: Systematic liter-
ature review.
Stadler, T., Oprisanu, B., and Troncoso, C. Synthetic Data-
A Privacy Mirage.
Xu, L., Skoularidou, M., Cuesta-Infante, A., and Veera-
machaneni, K. (2019). Modeling tabular data using
conditional gan. Advances in neural information pro-
cessing systems, 32.
Yale, A., Dash, S., Dutta, R., Guyon, I., Pavao, A., and
Bennett, K. P. (2020). Generation and evaluation of
privacy preserving synthetic health data. Neurocom-
puting, 416:244–255.
Zhao, Z., Kunar, A., Birke, R., and Chen, L. Y. (2021).
Ctab-gan: Effective table data synthesizing. In Asian
Conference on Machine Learning, pages 97–112.
PMLR.
Zhao, Z., Kunar, A., Birke, R., Van der Scheer, H., and
Chen, L. Y. (2024). Ctab-gan+: Enhancing tabular
data synthesis. Frontiers in big Data, 6:1296508.
ICISSP 2025 - 11th International Conference on Information Systems Security and Privacy
444
