
Eyes as Windows to the Heart: Predicting Heart Rate from Pupillometric
Features
Kevin Kristofer Kosasih
1
, Carl Daniel Karlsson
1
, Thilini Savindya Karunarathna
1 a
and
Zilu Liang
1,2 b
1
Ubiquitous and Personal Computing Lab, Kyoto University of Advanced Science (KUAS), Kyoto, Japan
2
Institute of Industrial Science, The University of Tokyo, Tokyo, Japan
kevin.kristof.kosasih@gmail.com, {2021m646, 2021m647, liang.zilu}@kuas.ac.jp
Keywords:
Eye-Tracking, Pupillometric, Heart Rate, Regression, Machine Learning.
Abstract:
Heart rate is a key indicator of health, typically measured through skin-contact methods such as electrocardio-
grams (ECG) or photoplethysmograms (PPG). However, these methods may not be comfortable for everyone,
prompting interest in non-contact alternatives. Eye tracking presents a promising solution, as the autonomic
nervous system links the eyes to heart rate. This research develops heart rate prediction models based on
pupillometric features. We conducted data collection experiments to build a dataset of multi-modal measure-
ments of pupillometric data and heart rate from 10 subjects at high sampling rates. Several regression models,
including linear regression, ridge regression, random forest regression, and XGBoost regression, were trained
on the dataset. The random forest model achieved the best performance with a R
2
of 0.457 and a root mean
square error (RMSE) of 9 beats per minute, representing a 52.3% improvement over the state-of-the-art. Fu-
ture work should focus on expanding the dataset, refining feature extraction and selection, and incorporating
3D pupillometric data to enhance model accuracy and applicability.
1 INTRODUCTION
The pupil is the black opening in the center of the
iris that regulates the amount of light entering the
retina by dilating and constricting. Pupil dilation is
controlled by the dilator muscles, while constriction
is controlled by the sphincter muscles (Wilhelm and
Helmut, 2008; Wyatt, 1995; Eckstein et al., 2017;
Kaufman and Alm, 2003). Neural pathways like the
Edinger–Westphal nucleus regulate the pupillary light
reflex (Wilkinson, 1992). The oculomotor and oph-
thalmic nerves control sphincter constriction during
parasympathetic responses and dilator muscle action
during sympathetic responses.
Pupillary response and heart rate are both invol-
untary functions regulated by the autonomic nervous
system (ANS) (Bradley et al., 2008; Ashwini and
Raju, 2023; Waxenbaum et al., 2019). The ANS con-
sists of the sympathetic nervous system (SNS) and the
parasympathetic nervous system (PNS). The SNS is
responsible for preparing the body to be alert, which
includes increasing heart rate, dilating pupils, and re-
a
https://orcid.org/0009-0002-4089-9500
b
https://orcid.org/0000-0002-2328-5016
ducing digestive activity. In contrast, the PNS pro-
motes relaxation by decreasing heart rate, constricting
pupils, and enhancing digestion (Gibbins, 2013).
The regulation of ANS on both the eyes and the
heart suggests a potential connection between these
two physiological systems. This possible link has
led to numerous studies exploring the relationship
between ANS activity and various physiological in-
dicators, such as heart rate, heart rate variability,
pupil size, pupil saccades, and galvanic skin response
(GSR) (Wang et al., 2018; Park et al., 2018; Parnandi
and Gutierrez-Osuna, 2013; Hochman and Yechiam,
2011; B
¨
ar et al., 2009; Bradley et al., 2008; Li et al.,
2023; Duong et al., 2019; Alshanskaia et al., 2024).
Given the connection between the eyes and the
heart, it is theoretically feasible to predict heart
rate using pupillary metrics, offering a non-contact
method for heart rate monitoring. This approach
presents several advantages. First, it provides an alter-
native for individuals with skin complications or those
whose skin is easily irritated, as it eliminates the need
for skin-contact sensors. Second, a model capable of
accurately predicting heart rate from pupillary data
would reduce the need for multiple devices in studies
measuring both heart rate and eye metrics. This re-
968
Kosasih, K. K., Karlsson, C. D., Karunarathna, T. S. and Liang, Z.
Eyes as Windows to the Heart: Predicting Heart Rate from Pupillometric Features.
DOI: 10.5220/0013385000003911
Paper published under CC license (CC BY-NC-ND 4.0)
In Proceedings of the 18th International Joint Conference on Biomedical Engineering Systems and Technologies (BIOSTEC 2025) - Volume 2: HEALTHINF, pages 968-975
ISBN: 978-989-758-731-3; ISSN: 2184-4305
Proceedings Copyright © 2025 by SCITEPRESS – Science and Technology Publications, Lda.

duction in hardware would minimize setup time, cal-
ibration, and post-processing efforts. Furthermore, as
virtual reality (VR) and augmented reality (AR) tech-
nologies become more widespread, heart rate predic-
tion from pupillometric data could be useful for adap-
tive game difficulty and fitness tracking.
This study explores the potential of using pupillo-
metric features, derived from eye-tracking measure-
ments, to predict heart rate through machine learn-
ing. Eye-tracking technology has advanced consid-
erably over the years, from manual recording and
fixed-point devices to advanced head-mounted eye
trackers (Krafka et al., 2016; Morimoto and Mimica,
2005; Zhai et al., 1999). These technologies enable
the continuous measurement of eye movements, gaze
patterns, pupil dilation, and blinking, offering nu-
merous potential applications. Previous studies have
leveraged eye-tracking data to examine the connec-
tion between eye activity and heart rate. For ex-
ample, it was found that the onset of microsaccades
is coupled with R-R intervals in the heartbeat (Ohl
et al., 2016). Another study measured pupillary re-
sponses and ECG signals in 70 students in response to
sound stimuli, discovering that the harmonic frequen-
cies of heart and pupillary responses were synchro-
nized (Park et al., 2018). Wang at al. developed a re-
gression model to measure pupil size using heart rate
and galvanic skin response (GSR) data while show-
ing subjects multiple emotional faces (Wang et al.,
2018), although the model showed poor prediction
accuracy. A recent study explored the relationship
between oculomotor metrics, such as saccades and
fixations, and heart rate. Using both regression and
classification methods, they found that a random for-
est classifier could distinguish between low and high
heart rates with reasonable accuracy, but the regres-
sion model could only explain 30% of the variance in
heart rate (Hoogerbrugge et al., 2022).
Despite the promise of machine learning tech-
niques and the growing body of research, current
methods for predicting heart rate from eye-tracking
metrics have limitations. Existing models show poor
prediction performance, and there is a lack of large,
high-quality datasets for training and testing machine
learning algorithms. This study addresses these gaps
in the literature through two key contributions: First,
we collected a new dataset, which, to the best of our
knowledge, includes the longest recorded data from
both an eye tracker and a research-grade wristband
for heart rate measurement. Second, we demonstrate
the feasibility of non-contact heart rate prediction us-
ing pupillometric data, achieving an improvement in
performance over existing methods that rely on ocu-
lomotor features. To the best of our knowledge, this
is one of the first studies to attempt heart rate predic-
tion using pupillometric features, providing a novel
approach for future research in this area.
2 METHOD
2.1 Dataset Preparation
2.1.1 Overview
To develop a model that predicts heart rate based
on pupillometric features derived from eye-tracking
measurements, we conducted a data collection exper-
iment with a cohort of students in a simulated lecture
environment. During the experiment, we simultane-
ously recorded both pupillometric data and physio-
logical signals. As listed in Table 1, two research-
grade wearable devices were employed for data col-
lection. Pupillometric data were captured using the
Pupil Core system (Kassner et al., 2014), while heart
rate measurements from the Empatica E4 (Stuyck
et al., 2022) device served as the ground truth.
Table 1: Collected data and sampling rate.
Device Sensor Data Sampling
Rate
Pupil World Camera (RGB) 60Hz
Core Eye Camera (IR) 120Hz
Empatica Heart Rate (BPM) 1 Hz
E4 Accelerometer (m/s
2
) 32 Hz
Skin Temperature (°C) 4 Hz
GSR (µS) 4 Hz
2.1.2 Measurement Devices
The Pupil Core is an open-source, head-mounted
eye tracker developed by Pupil Labs (Kassner et al.,
2014). It features two infrared (IR) eye-tracking cam-
eras and a single RGB world camera, as shown in Fig-
ure 1. The eye-tracking cameras record data at 120 Hz
per eye and require a connection to a computer to op-
erate, and they use software developed by Pupil Labs
for calibration, data recording, and export.
Pupil Capture is the primary data acquisition soft-
ware for the Pupil Core system, providing a real-time
view of the RGB world camera (see Figure 2) and
both infrared (IR) eye cameras (see Figure 3). It en-
ables the mapping of the pupil’s direction through the
viewpoint of the RGB world camera after calibrating
and synchronizing all three cameras. Pupil Labs of-
fers two methods for pupil detection: the 3D detector,
which creates a 3D model of the eye to measure pupil
Eyes as Windows to the Heart: Predicting Heart Rate from Pupillometric Features
969
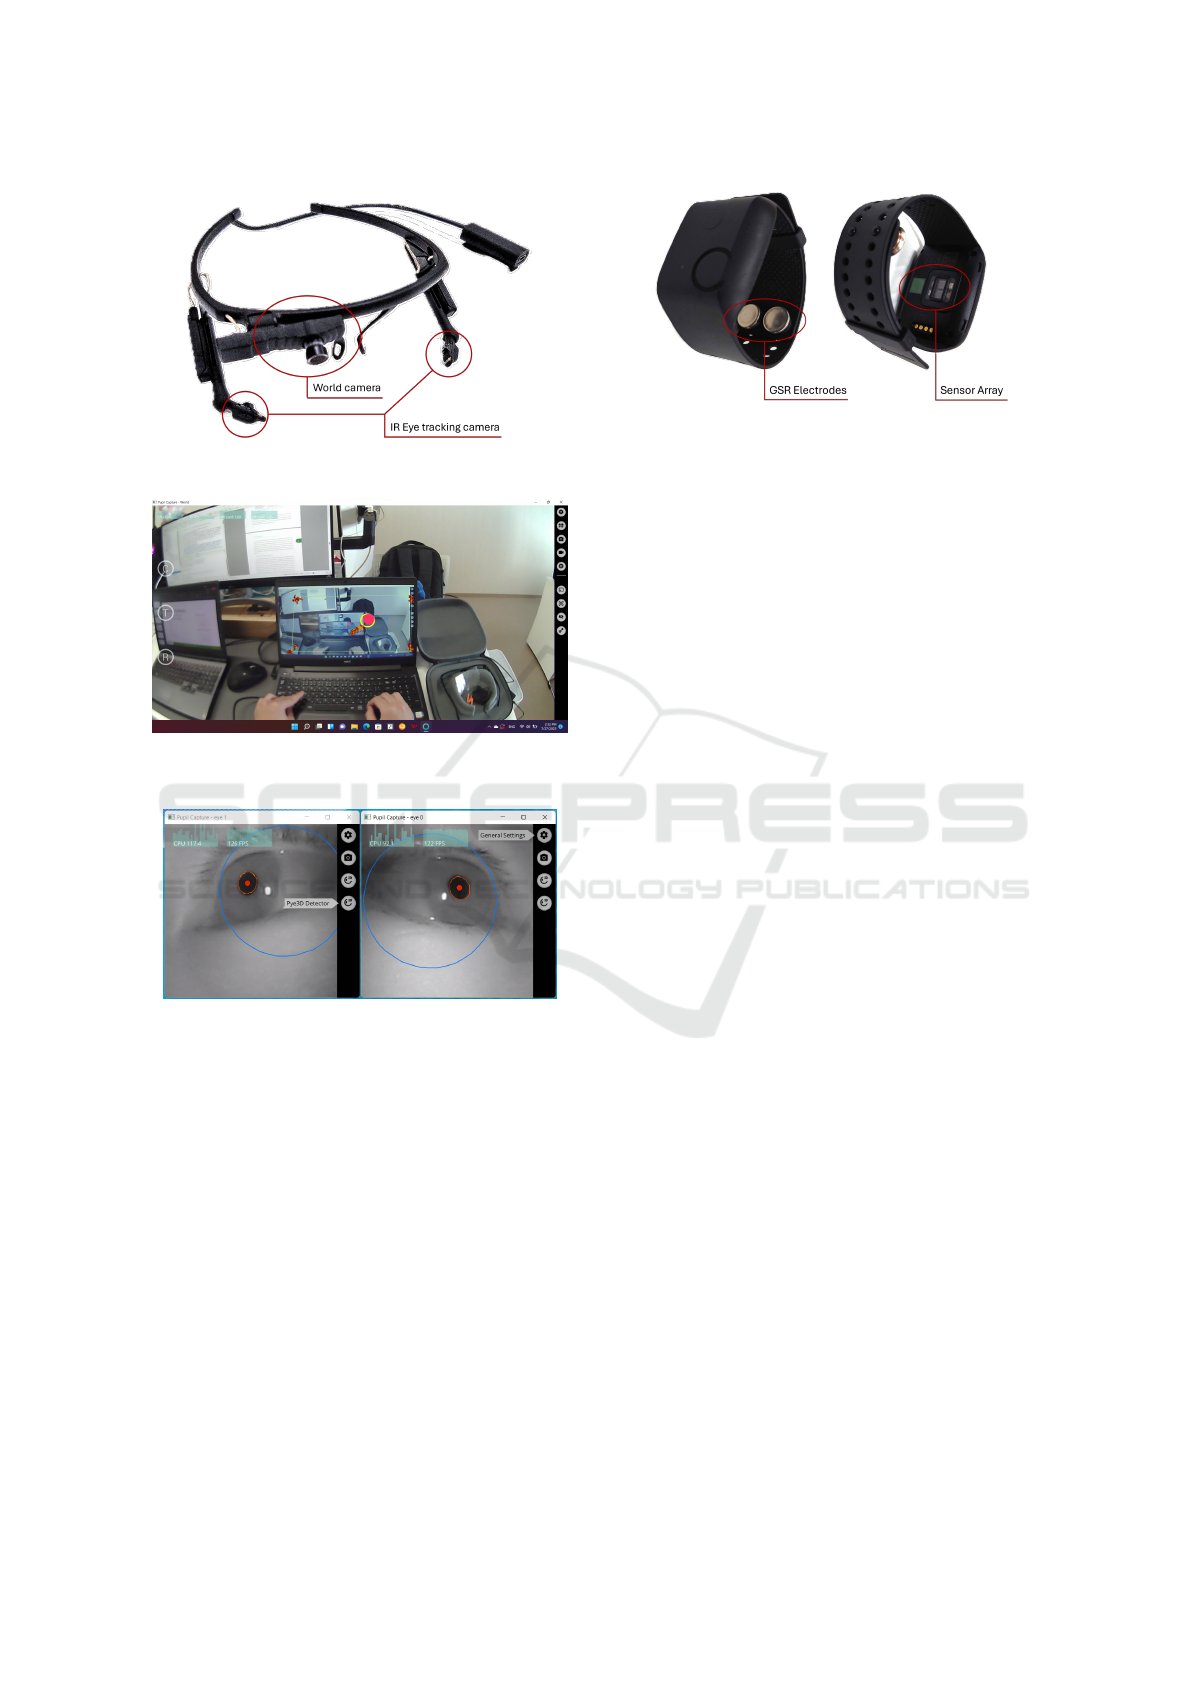
Figure 1: Pupil Labs Pupil Core.
Figure 2: Pupil Capture software displaying RGB world
camera view.
Figure 3: Pupil Capture software displaying IR camera.
diameter in millimeters, and the 2D detector, which
measures the pupil’s diameter in pixels by detecting
its ellipse and center. For this study, only the 2D data
were used in model construction.
The Empatica E4 is a medical-grade health mon-
itoring wristband developed by Empatica Inc. It
records data from multiple sensors, including PPG,
GSR, a 3-axis Accelerometer (ACC), and skin tem-
perature, and derives heart rate accurately (Stuyck
et al., 2022; Schuurmans et al., 2020). Figure 4 shows
the sensor locations on the device. The E4 is worn on
the participant’s wrist and requires good skin contact
for accurate data collection. In this study, we used the
heart rate recordings from the E4 as the ground truth
for heart rate measurement.
Figure 4: Empatica E4 wearable physiological measure-
ment device.
2.1.3 Experiment Protocol
Participants were recruited by distributing flyers
around the campus. To qualify for the study, par-
ticipants had to meet the following inclusion crite-
ria: the ability to understand and communicate in
English, normal or corrected-to-normal vision with-
out glasses, current enrollment at the university, good
health with no medical conditions that could affect
cognitive ability, minimal or no programming expe-
rience in Python, and no use of prescription medi-
cation. Interested individuals were asked to fill out
an online form with personal details, after which they
were contacted regarding their availability. This study
was approved by the Ethics Review Board of Kyoto
University of Advanced Science, and each participant
was compensated with an Amazon gift card valued at
approximately USD $20.
The experiment began with a brief explanation of
the purpose and procedure of the study, followed by
participants signing an informed consent. The mea-
surement consisted of two sessions, each starting with
a 20-minute video lesson on Python, followed by a
short quiz to assess participants’ understanding and
attention. A 10-minute break was provided between
the two sessions to simulate the end of a class. Base-
line measurements were taken before the first session
and after the final session. The experiments were con-
ducted in a semi-closed area of the lab with the blinds
drawn. Participants faced the window to ensure both
eyes received equal light exposure.
The experiments were scheduled between 1:00
P.M. and 3:00 P.M. to maintain consistent lighting
conditions. Prior to each session, lighting was mea-
sured using a light meter positioned at the subject’s
field of view, with a minimum threshold of 750 lux
required to begin. Weather conditions were also taken
into account, as cloudy or rainy days could reduce am-
bient light below the threshold. Experiments were not
conducted on cloudy or rainy days.
HEALTHINF 2025 - 18th International Conference on Health Informatics
970

Figure 5: Protocol of data collection experiment.
Table 2: Extracted time and frequency domain features.
Time Domain Features Frequency Domain Features Non-linear Features
max, min, mean, median,
standard deviation, coefficient
of variation, standard absolute
change, mean absolute change,
percentile, mean absolute value,
integrated absolute value, root
mean square, peak to peak, max
peak, min peak, crest factor, etc.
mean, variance, third moment,
fourth moment, grand mean,
standard deviation, c factor, d
factor, e factor, g factor, h fac-
tor, j factor, etc.
correlation dimension, alpha,
alpha overlap, hurst exponent,
conditional entropy, distance
entropy, fuzzy entropy, incre-
ment entropy, kolmogorov en-
tropy, etc.
2.2 Model Development
2.2.1 Signal Preprocessing and Data Cleaning
The data recorded by the eye tracker were first inter-
polated to a sampling rate of 200 Hz to account for
the variable sampling rates of the eye-tracking cam-
eras. All recorded data were then segmented into
one-second chunks and compiled into a pickle data
frame, which contains vectors from different sensors
with varying sampling rates. For example, heart rate
data were sampled at 64 Hz.
Filtering is an essential preprocessing step used to
reduce noise and outliers in the data, as noisy data can
negatively impact model performance. The choice of
filter design and its parameters can significantly af-
fect the signal quality. In this study, pupil size sam-
ples outside the feasible range of 1.5 to 9 mm were re-
jected, with these boundaries determined using the 3D
model data. Outliers were further identified by recog-
nizing that changes in pupil size due to artifacts tend
to be larger than those caused by actual pupil dilation
or constriction. Filtering of dilation speed outliers
follows the method outlined by (Kret and Sjak-Shie,
2018). For the median absolute deviation (MAD), a
unique value was calculated for each participant, and
a constant multiplier of 2 was applied. Figure 6 illus-
trates the effect of n on the filter performance.
After the removal of dilation speed outliers, sam-
ples within 50 ms of missing data gaps were re-
jected. These gaps are defined as contiguous sections
of missing data lasting 75 ms or longer. Linear inter-
polation was then applied to restore the signal at the
rejected data points.
2.2.2 Feature Engineering
Feature extraction is the process of identifying hid-
den patterns in the data that may correlate with
the outcome. For each data block, we extracted
time-domain, frequency-domain, and non-linear fea-
tures. A total of 67 features were derived from
the pupil size data, including 30 time-domain fea-
tures, 14 frequency-domain features, and 23 non-
linear features, as shown in Table 2. These fea-
tures have demonstrated promising performance in
other computational health applications (Liang, 2024;
Karunarathna and Liang, 2024; Bertrand et al., 2021).
Feature selection involves identifying and retain-
ing the most relevant features for the model. While
having many features can help explain the data, some
of the extracted features may be irrelevant or redun-
dant. These irrelevant or redundant features can neg-
atively affect the model’s performance. Therefore,
selecting and removing such features is critical for
achieving optimal model performance.
We analyzed the correlation coefficients between
feature pairs to identify redundancy. Any feature ex-
hibiting a Pearson correlation coefficient higher than
0.97 with another was excluded. Of the 67 features
extracted from pupil diameter, 9 were removed, and a
total of 58 features were used for model development.
Eyes as Windows to the Heart: Predicting Heart Rate from Pupillometric Features
971
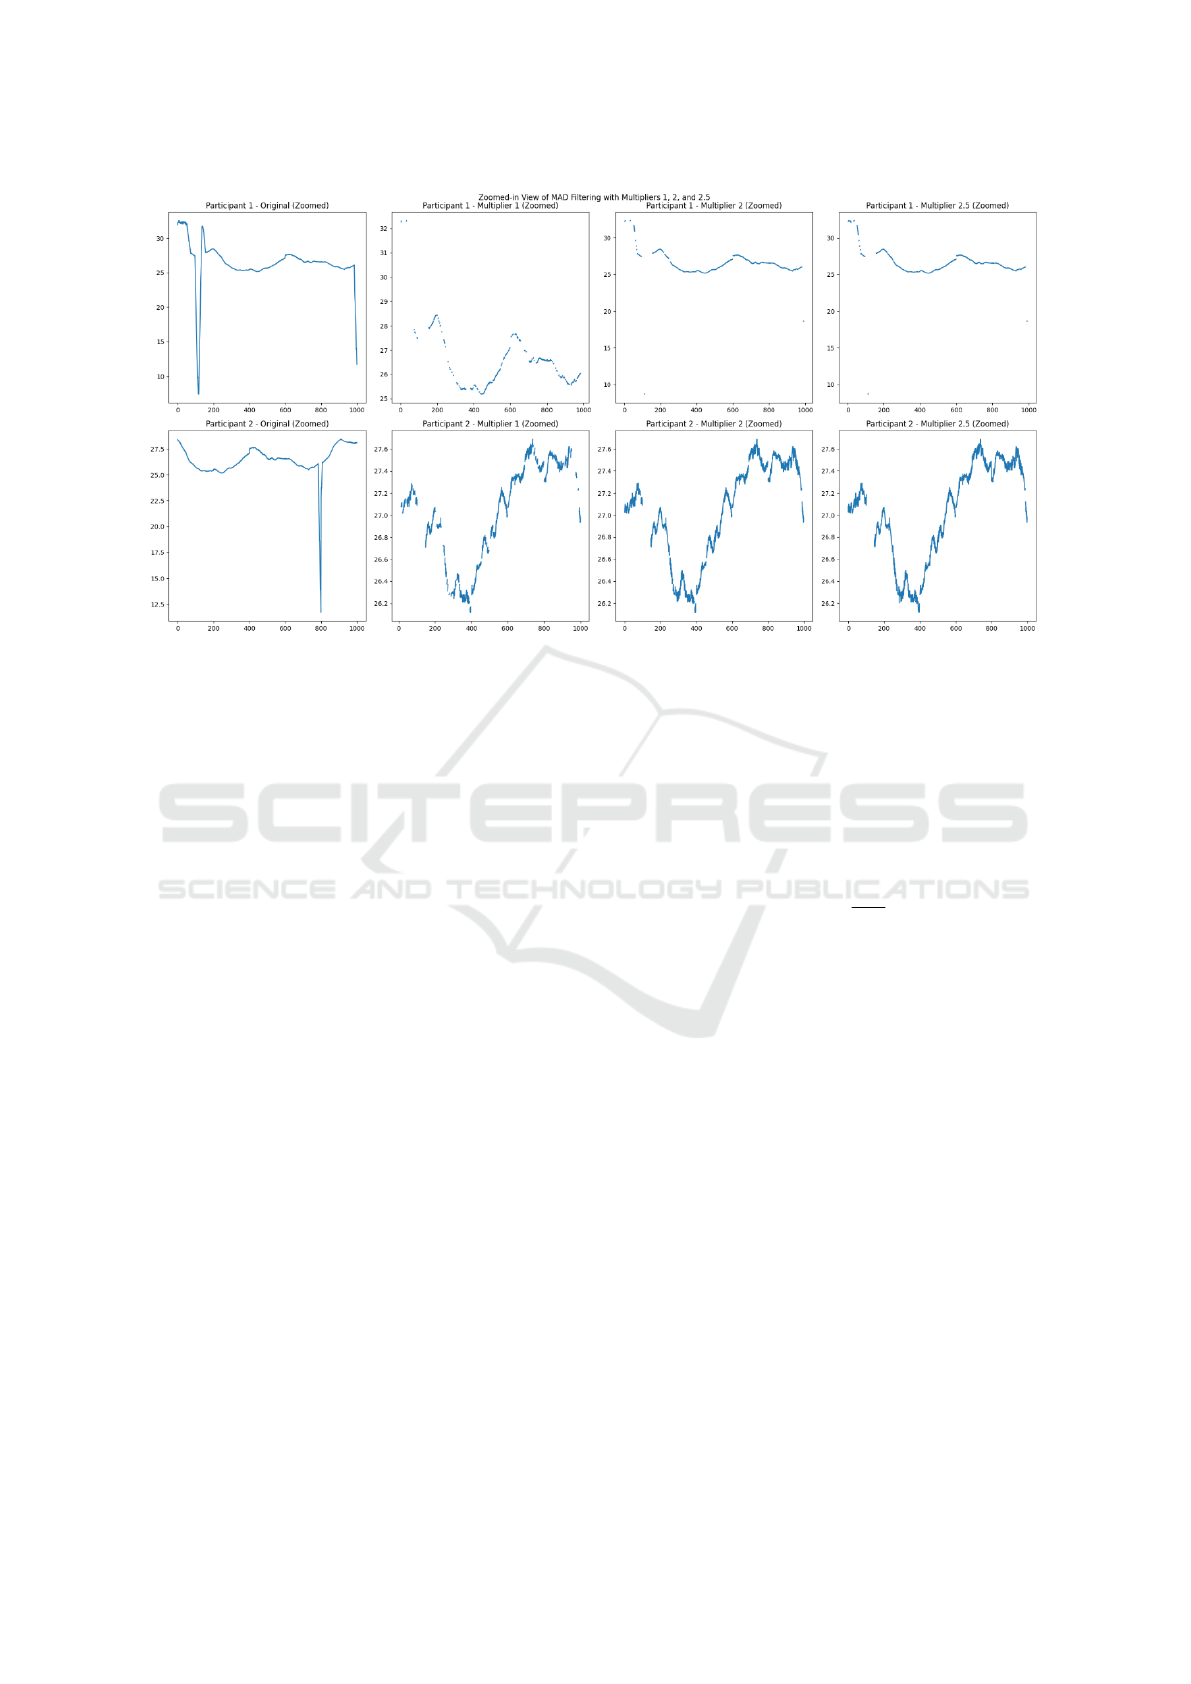
Figure 6: Effect of constant multiplier n.
2.2.3 Model Training and Testing
The dataset was split into an 80:20 training and test-
ing ratio. Out of the 41,980 bins created, 80% (or
29,385 bins) were allocated for training the model,
while 20% (or 8,396 bins) were reserved for test-
ing. We employed four widely used regression mod-
els—linear regression, ridge regression, random for-
est regression, and XGBoost regression. The models
were trained using default parameters to assess their
feasibility without additional hyperparameter tuning.
To evaluate the model, we employed several met-
rics to further refine its performance. These metrics
are derived from statistical methods and help deter-
mine whether a model’s predictions reliably represent
the data. Central to these evaluations is the concept
of variance and how far the predicted values differ
from the actual values. Variance measures the average
degree of spread of each value relative to the mean,
which is conceptually similar to the standard devia-
tion (the square root of variance). A signal with a high
standard deviation indicates that the data are widely
spread around the mean, whereas a signal with a low
standard deviation suggests that the data are concen-
trated near the mean.
2.2.4 Evaluation Metrics
R squared or coefficient of determination explains
how much the proportion of variance in the target
could be explained by the features. R squared ranges
from 0 to 1, 0 means the variance could not be ex-
plained by the features while 1 means all of the vari-
ance in the target could be explained by the result. To
calculate R squared we need to find the residual sum
of squares (RSS) and the total sum of squares (TSS).
Since we are trying to find the proportion, we sub-
tract 1 from the fraction of RSS by TSS as shown in
Equation 1. RSS measures the sum of how far the
prediction differs from the real value while TSS is the
sum of all squared.
R
2
= 1 −
RSS
T SS
(1)
RMSE is simply the square root of the mean
squared error (MSE). MSE measures the average of
the squared differences between the predicted values
and the actual target values shown in Equation 2. The
error represents how far the prediction deviates from
the true target value. Because MSE is based on the
average of squared errors, larger errors have a dispro-
portionately large impact on the score. A model with
a low MSE indicates that the model makes fewer large
errors when predicting, meaning that its predictions
are closer to the actual values on average.
RMSE helps scale down MSE, bringing it to the
same units as the target variable. It indicates how far,
on average, a prediction deviates from the true value.
A model with a low RMSE indicates that the model’s
predictions are close to the actual values. RMSE was
chosen over both the Mean Absolute Error (MAE)
and the MSE because it is more sensitive to larger er-
rors than MAE and, unlike MSE, is more interpretable
since it shares the same units as the target variable.
In addition to the quantitative metrics used to eval-
uate model performance, we also employed scatter
HEALTHINF 2025 - 18th International Conference on Health Informatics
972

plots and Bland-Altman plots (Bland and Altman,
1986) to visually assess the agreement between the
regression models and the heart rate ground truth.
MSE =
1
n
n
∑
i=1
(Y
i
−
ˆ
Y
i
)
2
(2)
RMSE =
√
MSE (3)
3 RESULTS
3.1 Participants
Out of the 22 participants who registered for the ex-
periment, 10 actually participated. Five of the regis-
tered participants were excluded because they did not
meet the inclusion criteria. Three of these participants
were excluded due to poor vision that required correc-
tive glasses, while the other two were excluded due to
their familiarity with the subject matter of the learn-
ing trial. The remaining registered participants did not
conduct the experiment due to scheduling conflicts or
failure to respond when contacted.
Table 3 lists the subjects whose data were included
in the dataset. The participants, consisting of 3 fe-
males and 7 males, ranged in age from 19 to 32 years,
with a mean age of 21.6 years. Most participants
have right-eye dominance, while one participant did
not have a dominant eye.
Table 3: Participants of the study.
Subject Age Gender Dominant Eye
sub01 24 M R
sub02 20 M R
sub03 19 F L
sub04 18 F L
sub05 19 M L
sub06 32 M R
sub07 19 F R
sub08 19 M R
sub09 19 M Both
sub10 27 M R
Figure 7 illustrates time series data collected from
one subject (sub04). The plotted data are raw, un-
processed measurements gathered directly from the
devices. The top subplot represents the participant’s
heart rate throughout the experiment, measured in
beats per minute (BPM). The bottom subplot shows
the pupil diameter, recorded by the eye-tracking cam-
era and measured in pixel length
Figure 7: A time series plot of HR and Pupil recording of
sub04.
3.2 Model Performances
The performance of the regression models is summa-
rized in Table 4. The R
2
values ranged from 0.218
to 0.457, and the RMSE varied between 9 and 11.
Overall, tree-based machine learning techniques, in-
cluding random forest regression and XGBoost re-
gression, demonstrated superior performance. Specif-
ically, the random forest regression model outper-
formed the other models, achieving an R
2
of 0.457,
which indicates that it explained 45.7% of the vari-
ance in heart rate.
Table 4: Performance of the regression models.
Model R
2
RMSE
Linear Regression 0.223 11
Ridge Regression 0.218 11
Random Forest Regression 0.457 9
XGBoost Regression 0.357 10
We also evaluated how well the random forest
regression model agrees with the heart rate ground
truth using both a scatter plot (Figure 8) and a Bland-
Altman plot (Figure 9). The scatter plot reveals that
the model tended to overestimate heart rate when it
was below 60 BPM and underestimate it when it ex-
ceeded 90 BPM. Furthermore, the Bland-Altman plot
confirms that while there was no significant system-
atic bias, the limit of agreement between the regres-
sion model and the ground truth was approximately
20 BPM, which is a noteworthy margin of error.
4 DISCUSSION
This study developed regression models to predict
heart rate from pupillometric data. Given the emerg-
Eyes as Windows to the Heart: Predicting Heart Rate from Pupillometric Features
973
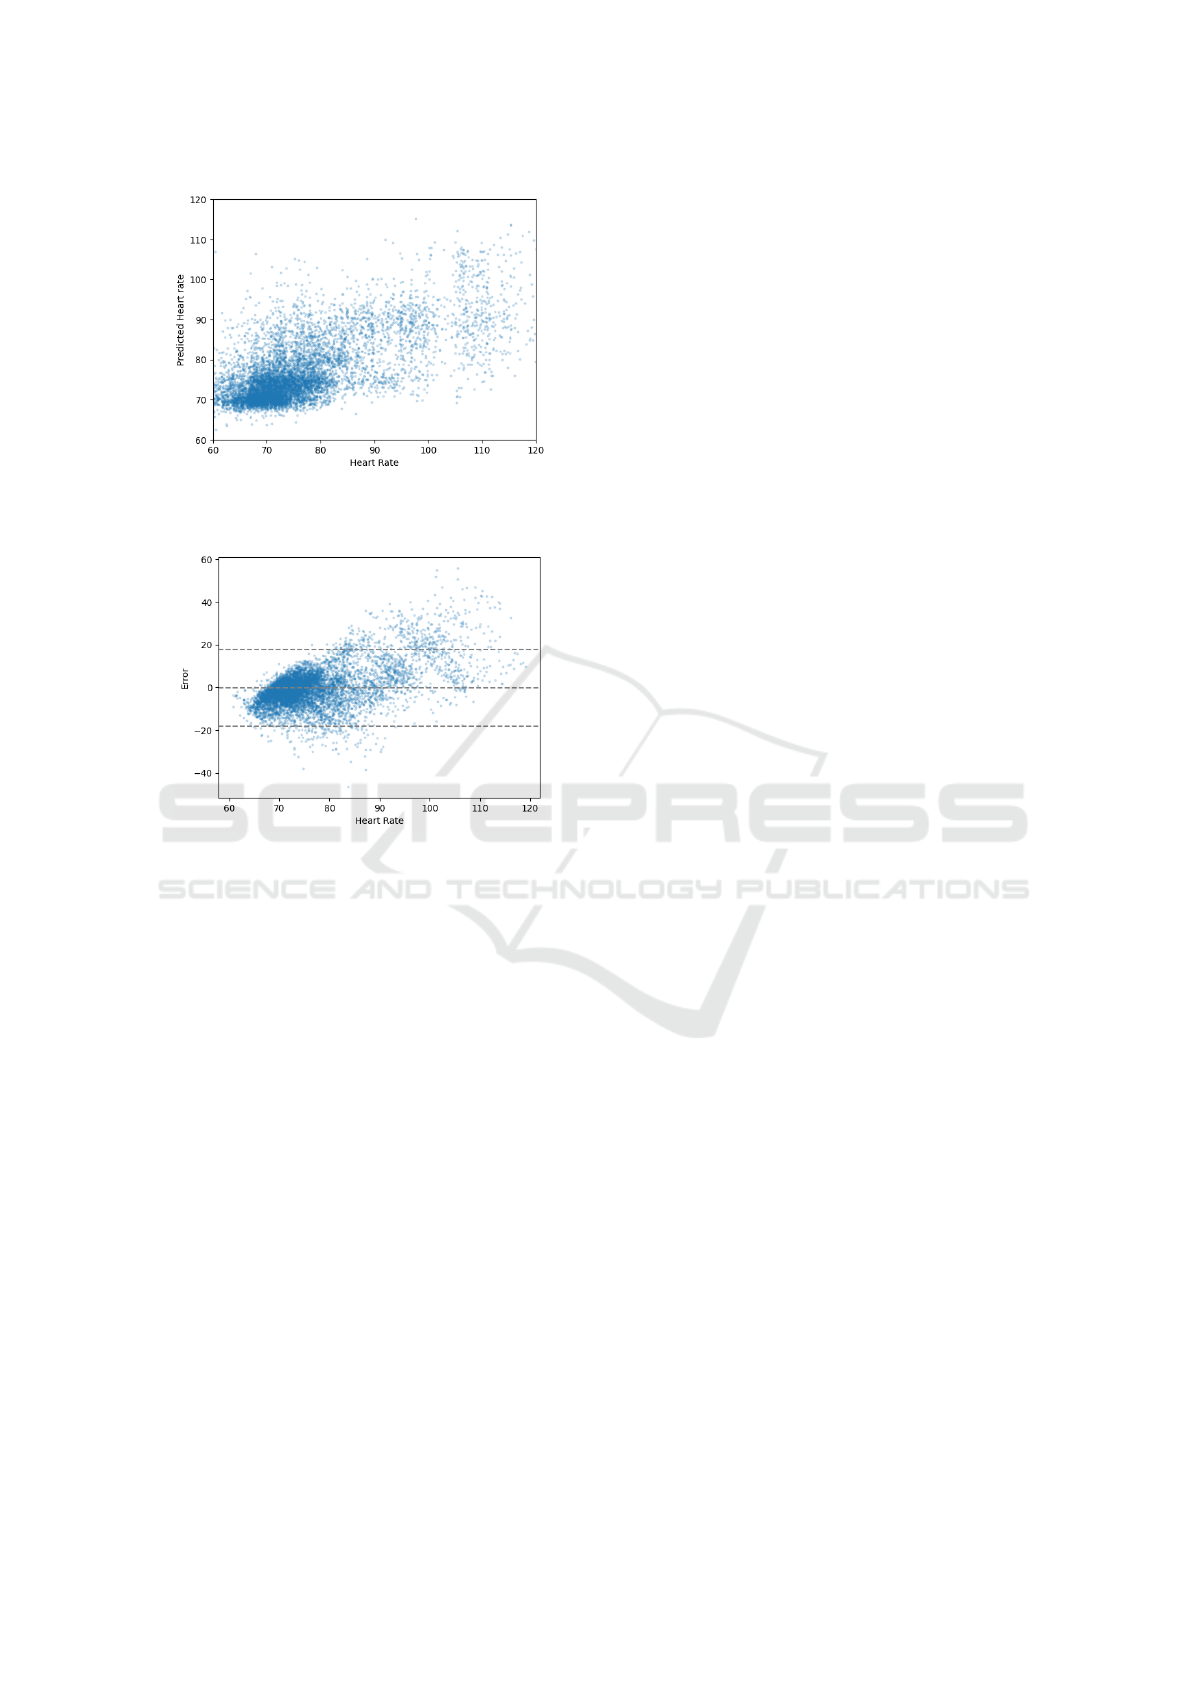
Figure 8: Scatter plot of the random forest regression model
(y-axis) versus the heart rate ground truth (x-axis).
Figure 9: Bland-Altman plot of agreement between the ran-
dom forest regression model and the heart rate ground truth.
ing nature of this topic, we found only one prior study
that allows direct comparison with our results. A re-
cent study by Hoogerbrugge et al. used oculomo-
tor features such as saccades, blinks, and fixations
to predict heart rate, achieving an R
2
score of 0.30
(Hoogerbrugge et al., 2022). In comparison, our best-
performing model achieved an R
2
of 0.457–a 52.3%
improvement over Hoogerbrugge’s model.
Despite this significant improvement, our best
model was still only able to explain less than 50%
of the variance in heart rate. Several factors may con-
tribute to this discrepancy. One likely reason is the
complex, non-linear relationship between the pupillo-
metric features and heart rate, which our models may
not have fully captured. In addition, the feature selec-
tion methods employed in this study could be further
refined to improve predictive accuracy.
Despite the progress made with our model, there
are several limitations. First, our models were trained
on data collected under controlled lighting conditions,
ranging from 700-900 lux. In environments with fluc-
tuating lighting, the accuracy of the model is likely
to decrease, as ambient light intensity significantly
contributes to pupil variance. Second, the dataset
primarily consists of young adults aged 18-32, with
a concentration of participants around 19 years old.
Since age-related physiological changes can affect
both pupillary responses and heart rate, the age bias
in our dataset should be considered when generaliz-
ing the model’s applicability. Third, the absence of
individuals with medical conditions that could impact
pupil size or light sensitivity represents another limi-
tation in the current model.
To enhance the model performance, future work
should focus on refining the feature selection pro-
cess and exploring alternative features. Experiment-
ing with different bin sizes for feature extraction may
provide valuable insights too. Moreover, investigating
both low- and high-frequency components of pupil-
lary and heart rate signals, as suggested in (Park et al.,
2018), could uncover additional patterns that can be
leveraged to improve prediction accuracy. In addition,
hyperparameter tuning with k-fold cross-validation
could further enhance model performance. Time-
varying deep learning models like LSTMs, which are
effective in capturing temporal patterns in sequential
data, could also be explored. Finally, while our study
utilized 2D pupillometric data, future research should
consider incorporating 3D data to capture a more
comprehensive range of pupillary responses, which
could further enhance predictive capabilities.
5 CONCLUSION
This study developed regression models to predict
heart rate from pupillometric data, demonstrating
promising results with the best model achieving
52.3% improvement compared to the state-of-the-art.
However, the best model still only accounted for
45.7% of the variance in heart rate, indicating room
for further improvement. In conclusion, while this
study represents a step forward in predicting heart
rate from pupillometric data, refining the feature se-
lection process, expanding the dataset, and exploring
new data types will be essential for improving model
accuracy and applicability in real-world settings.
ACKNOWLEDGMENTS
The authors would like to express their gratitude to
the participants for their valuable contributions to this
study, and to Ms. Nhung H. Hoang for her assistance
in editing the manuscript.
HEALTHINF 2025 - 18th International Conference on Health Informatics
974

REFERENCES
Alshanskaia, E. I., Portnova, G. V., Liaukovich, K., and
Martynova, O. V. (2024). Pupillometry and auto-
nomic nervous system responses to cognitive load and
false feedback: an unsupervised machine learning ap-
proach. Frontiers in Neuroscience, 18.
Ashwini, D. L. and Raju, T. R. (2023). Autonomic nervous
system and control of visual function. Annals of Neu-
rosciences, 30.
Bertrand, L., Cleyet-Marrel, N., and Liang, Z. (2021). The
role of continuous glucose monitoring in automatic
detection of eating activities. In Proceedings of the
2021 IEEE 3rd Global Conference on Life Sciences
and Technologies (LifeTech), pages 313–314.
Bland, J. M. and Altman, D. G. (1986). Statistical methods
for assessing agreement between two methods of clin-
ical measurement. The Lancet, 327(8476):307–310.
Originally published as Volume 1, Issue 8476.
Bradley, M., Miccoli, L., Escrig, M., and Lang, P. (2008).
The pupil as a measure of emotional arousal and auto-
nomic activation. Psychophysiology, 45:602–7.
B
¨
ar, K.-J., Schulz, S., Koschke, M., Harzendorf, C., Gayde,
S., Berg, W., Voss, A., Yeragani, V. K., and Boettger,
M. K. (2009). Correlations between the autonomic
modulation of heart rate, blood pressure and the pupil-
lary light reflex in healthy subjects. Journal of the
Neurological Sciences, 279(1):9–13.
Duong, H. T. H., Tadesse, G. A., Nhat, P. T. H., Van Hao,
N., Prince, J., Duong, T. D., Kien, T. T., Pugh, C.,
Loan, H. T., Chau, N. V. V., et al. (2019). Heart rate
variability as an indicator of autonomic nervous sys-
tem disturbance in tetanus. The American journal of
tropical medicine and hygiene, 102(2):403.
Eckstein, M. K., Guerra-Carrillo, B., Singley, A. T. M., and
Bunge, S. A. (2017). Beyond eye gaze: What else can
eyetracking reveal about cognition and cognitive de-
velopment? Developmental Cognitive Neuroscience,
25:69–91. Sensitive periods across development.
Gibbins, I. (2013). Functional organization of autonomic
neural pathways. Organogenesis, 9(3):169–175.
Hochman, G. and Yechiam, E. (2011). Loss aversion in the
eye and in the heart: The autonomic nervous system’s
responses to losses. J Behav Decis Mak, 24:140 – 156.
Hoogerbrugge, A. J., Strauch, C., Ol
´
ah, Z. A., Dalmaijer,
E. S., Nijboer, T. C. W., and Van der Stigchel, S.
(2022). Seeing the forrest through the trees: Oculo-
motor metrics are linked to heart rate. PLOS ONE,
17(8):e0272349.
Karunarathna, T. and Liang, Z. (2024). Physiological signal
based blood glucose prediction in diabetics and non-
diabetics. In Proceedings of the 2024 IEEE Interna-
tional Conference on E-health Networking, Applica-
tion & Services.
Kassner, M., Patera, W., and Bulling, A. (2014). Pupil: an
open source platform for pervasive eye tracking and
mobile gaze-based interaction. In Proceedings of the
2014 ACM International Joint Conference on Perva-
sive and Ubiquitous Computing: Adjunct Publication.
Kaufman, P. L. and Alm, A. (2003). Adler’s Physiology of
the Eye. Mosby Inc.
Krafka, K., Khosla, A., Kellnhofer, P., Kannan, H., Bhan-
darkar, S., Matusik, W., and Torralba, A. (2016). Eye
tracking for everyone. In Proceedings of the IEEE
Conference on Computer Vision and Pattern Recogni-
tion (CVPR).
Kret, M. E. and Sjak-Shie, E. E. (2018). Preprocessing pupil
size data: Guidelines and code. Frontiers in Neurol-
ogy, 51.
Li, M., Xu, Q., Yan, X., Wang, J., and Xiang, Y. (2023).
Relationship between autonomic nervous system ac-
tivity and axial length in children. Med Sci Monit,
29:e939451–1.
Liang, Z. (2024). Developing probabilistic ensemble ma-
chine learning models for home-based sleep apnea
screening using overnight spo2 data at varying data
granularity. Sleep and Breathing, 28:2409–2420.
Morimoto, C. H. and Mimica, M. R. (2005). Eye gaze track-
ing techniques for interactive applications. Computer
Vision and Image Understanding, 98(1):4–24. Special
Issue on Eye Detection and Tracking.
Ohl, S., Wohltat, C., Kliegl, R., Pollatos, O., and Engbert,
R. (2016). Microsaccades are coupled to heartbeat.
The Journal of Neuroscience, 36(4):1237–1241.
Park, S., Won, M. J., Lee, D. W., and Whang, M. (2018).
Non-contact measurement of heart response reflected
in human eye. International Journal of Psychophysi-
ology, 123:179–198.
Parnandi, A. and Gutierrez-Osuna, R. (2013). Contactless
measurement of heart rate variability from pupillary
fluctuations. In 2013 Humaine Association Confer-
ence on Affective Computing and Intelligent Interac-
tion, pages 191–196.
Schuurmans, A., de Looff, P., Nijhof, K., Rosada, C.,
Scholte, R., Popma, A., and Otten, R. (2020). Valid-
ity of the empatica e4 wristband to measure heart rate
variability (hrv) parameters: a comparison to electro-
cardiography (ecg). J Med Syst, 44:190.
Stuyck, H., Dalla Costa, L., Cleeremans, A., and Van den
Bussche, E. (2022). Validity of the empatica e4 wrist-
band to estimate resting-state heart rate variability in
a lab-based context. International Journal of Psy-
chophysiology, 182:105–118.
Wang, C.-A., Baird, T., Huang, J., Coutinho, J. D., Brien,
D. C., and Munoz, D. P. (2018). Arousal effects on
pupil size, heart rate, and skin conductance in an emo-
tional face task. Frontiers in Neurology, 9.
Waxenbaum, J. A., Reddy, V., and Varacallo, M. (2019).
Anatomy, autonomic nervous system.
Wilhelm and Helmut (2008). The pupil. Current Opinion
in Neurology, 21(1):36–42.
Wilkinson, J. (1992). Cranial nerves, page 110–149. Else-
vier.
Wyatt, H. J. (1995). The form of the human pupil. Vision
Research, 35:2021–2036.
Zhai, S., Morimoto, C., and Ihde, S. (1999). Manual and
gaze input cascaded (magic) pointing. In Proceedings
of the SIGCHI Conference on Human Factors in Com-
puting Systems, page 246–253.
Eyes as Windows to the Heart: Predicting Heart Rate from Pupillometric Features
975
