
Reconsidering AHI as an Indicator of Sleep Apnea Severity: Insights
from Mining Large, Longitudinal Sleep Datasets
Nhung H. Hoang
1 a
and Zilu Liang
1,2 b
1
Ubiquitous and Personal Computing Lab, Kyoto University of Advanced Science (KUAS), Kyoto, Japan
2
Institute of Industrial Science, The University of Tokyo, Tokyo, Japan
{2023md05, liang.zilu}@kuas.ac.jp
Keywords:
Sleep Apnea, AHI, Contrast Set Mining, Longitudinal Data, SHHS.
Abstract:
Sleep apnea remains a key area of sleep research, with the Apnea-Hypopnea Index (AHI) widely used to
assess its severity. This study evaluated whether AHI is truly the best indicator of sleep apnea and identified
its limitations. Using the Sleep Heart Health Study and Wisconsin Sleep Cohort datasets, which provide large,
longitudinal data, we also explored survey data on demographics, physiology, and daily behaviors—often
overlooked in polysomnography-based studies. The results indicate that AHI may be a good indicator for
mild or moderate sleep apnea, but not necessarily for normal or severe cases. We highlight some trends that
can be seen from longitudinal data. Additionally, using contrast set mining method, we identified key risk
factors for cardiovascular disease, including age, snoring, and smoking behavior. These results underscore
the importance of considering AHI’s limitations and incorporating additional factors for more accurate sleep
apnea diagnosis and risk assessment.
1 INTRODUCTION
The diagnosis of obstructive sleep apnea (OSA) typ-
ically relies on calculating the Apnea-Hypopnea In-
dex (AHI) from a single night of sleep measurement,
which quantifies the number of apneas and hypopneas
per hour of sleep. This index serves as a key metric
for assessing the severity of OSA, with higher AHI
values indicating more severe forms of the disorder.
However, current approach uses only one night of
data presents several challenges. The ”first-night ef-
fect,” where participants experience unnatural sleep
due to the study environment and measurement sen-
sors, may not accurately reflect their typical sleep pat-
terns (Byun et al., 2019). Moreover, a single night’s
data cannot capture the long-term health implications
of sleep, as fluctuations in sleep quality often mani-
fest over extended periods rather than as short-term
changes. Therefore, relying solely on a single record-
ing and summarizing it into a singular metric like
the AHI risks oversimplifying the complex and rich
data available, potentially under-representing the true
severity and nuances of OSA.
Correct labels play a very important role in super-
a
https://orcid.org/0000-0002-5805-2087
b
https://orcid.org/0000-0002-2328-5016
vised learning model. Most publications accept AHI
as the best available tool so far. Consistent correla-
tions between the AHI and clinical outcomes have es-
tablished a strong foundation for the use of AHI in
characterizing sleep apnea. However, night-to-night
variability in AHI is seen in mild and moderate sleep
apnea subjects (Bittencourt et al., 2001), (Levy et al.,
2023). While it seems intuitive that the diagnostic
threshold should be adjusted, the values of 5 and 15
events per hour have persistently remained as stan-
dard cut-off points. (Rapoport, 2016) and (Punjabi,
2016) argued the pros and cons of AHI. Employing a
single scale to represent datasets exceeding 1 GB in-
troduces specific limitations. Although apneic events
lasting longer than 30 seconds and SpO
2
desaturation
deeper than 4% are more impactful on mortality in
sleep apnea, the AHI does not account for event du-
ration or desaturation depth, assigning equal weight
to all events (Soori et al., 2022). The distribution of
apneic events is also crucial, as it indicates whether
sleep disruption occurred consistently throughout the
night or was concentrated in a short period.
To the best of our knowledge, there is a significant
gap in understanding the longitudinal impact of OSA.
This study aims to address the following problems:
• Evaluate the reliability of the AHI as a definitive
metric for determining the severity of obstructive
976
Hoang, N. H. and Liang, Z.
Reconsidering AHI as an Indicator of Sleep Apnea Severity: Insights from Mining Large, Longitudinal Sleep Datasets.
DOI: 10.5220/0013385500003911
Paper published under CC license (CC BY-NC-ND 4.0)
In Proceedings of the 18th International Joint Conference on Biomedical Engineering Systems and Technologies (BIOSTEC 2025) - Volume 2: HEALTHINF, pages 976-983
ISBN: 978-989-758-731-3; ISSN: 2184-4305
Proceedings Copyright © 2025 by SCITEPRESS – Science and Technology Publications, Lda.

sleep apnea.
• Assessing the associations between sleep apnea
severity as defined by AHI and the cardiovascu-
lar conditions
• Using contrast-set mining to identify influential
factors on long-term health, particularly concern-
ing cardiovascular diseases, in individuals with
and without sleep disorders.
2 METHODOLOGY
2.1 Datasets
In this study, we analysed two publicly available
datasets: the Sleep Heart Health Study (SHHS)
(Zhang et al., 2018; Quan et al., 1997) and the Wis-
consin Sleep Cohort (WSC) (Young et al., 2009).
Both datasets provide large sample sizes, which allow
for a more comprehensive analysis.
2.1.1 Sleep Heart Health Study
The SHHS dataset is widely regarded as one of the
most influential resources in sleep apnea research.
It includes data from 5,804 participants, with 4,311
individuals (74.28%) completing a follow-up assess-
ment approximately five years after their initial visit.
The study’s comprehensive nature and longitudinal
design have facilitated in-depth analyses, leading to
significant insights into the long-term health conse-
quences of sleep apnea and related disorders.
2.1.2 Wisconsin Sleep Cohort
This ongoing longitudinal study examines the causes,
outcomes, and natural progression of sleep disorders,
particularly sleep apnea. Although smaller in scope
than the SHHS, this dataset includes 2,570 individual
sleep records. Participants typically engage in up to
four clinic visits, though two participants completed
a fifth visit. In total, 1,123 subjects participated in
the initial visit, 758 (67.50%) returned for the sec-
ond, 566 (50.40%) for the third, 121 (10.77%) for the
fourth, and two subjects for the fifth.
Each visit is separated with intervals typically
ranging from four to six years, as depicted in Figure
1. For participants with multiple visits, the majority
of the data spans eight years or more. This extended
timeline is particularly promising for monitoring the
progression and impact of sleep disorders over time.
Figure 1: The chart illustrates the distribution of time in-
tervals between the first and the last examinations of the
participants in the WSC study.
2.2 Contrast Set Mining
Contrast set mining aims to identify rules that em-
phasize significant differences between groups us-
ing metrics like support, confidence, and lift. The
STUCCO algorithm facilitates analysis by uncover-
ing statistically meaningful contrasts across subpop-
ulations (Bay and Pazzani, 2001; Gamberger and
Lavrac, 2011). The STUCCO algorithm has been
previously applied to uncover hidden correlations be-
tween sleep and glucose (Hoang and Liang, 2023).
Rules in contrast set mining consist of antecedents
(conditions) and a consequent (outcome) in the for-
mat (X
1
AND X
2
) → Y
1
.
If the dataset contains attributes like smoking
habits, BMI, and snoring frequency, the method gen-
erates rules like: (BMI > 25 AND Smokes) → High
Risk of Sleep Apnea. This rule can be interpreted as:
”Subjects who smoke and have a Body Mass Index
(BMI) greater than 25 are more likely to have a higher
risk of sleep apnea.” In general, rules generated by
this method follow the same structure: when the con-
ditions specified on the left-hand side (antecedents)
are met, the probability of the outcome specified
on the right-hand side (consequent) increases. To
maintain interpretability and reduce redundancy, rules
are limited to three antecedents. Valid contrast sets
must meet thresholds of support (≥10%), confidence
(≥75%), and lift (≥2).
2.3 Processing Questionnaires Data
This work does not center on biosignal processing
but instead prioritizes extracting insights from the
questionnaires during the first (SHHS1) and second
(SHHS2) visits. From the 1,896 variables listed in the
”shhs-data-dictionary-0.20.0-variables.csv” file, we
selected variables of interest that reflect daily routines
and well-being, which are listed in Table 1.
Reconsidering AHI as an Indicator of Sleep Apnea Severity: Insights from Mining Large, Longitudinal Sleep Datasets
977

Table 1: List of questionnaire information used for contrast set mining.
Left-hand-side features Right-hand-side
features
Physiological Behavioral Medical history Treatment Cardiovascular
diseases
Education level,
marital status,
age, body mass
index, weight,
height, neck
circumference,
cholesterol,
triglycerides,
gender
Smoking status,
number of packs of
cigarettes/years,
number of cigarettes
smoke per day,
alcohol, coffee, tea,
soda, sleep pill,
napping, difficulty
falling asleep, sleep
time on weekdays and
weekends
History of heart
attack, stroke,
hypertension
(HTN), diabetes,
asthma,
loudness of
snoring,
frequency of
snoking, change
of snoring
condition over
time
Any surgery
treatment for
sleep apnea, any
surgery
treatment for
snoring, using
oxygen therapy
during sleep,
using pressure
mask or
mouthpiece
Any cardiovascular
diseae since baseline,
any coronary heart
disease since base
line, number of
angina since baseline,
vital status
2.3.1 Left-Hand-Side Factors
The left-hand-side factors in this analysis represent
potential predictors or contributing factors to the out-
comes observed on the right-hand side. This study
aims to identify specific behaviors that may exac-
erbate the complexity of cardiovascular problems.
The left-hand-side factors are categorized into four
groups: physiological, behavioral, medical history,
and treatment.
2.3.2 Right-Hand-Side Factors
For the right-hand-side, we selected factors related to
cardiovascular diseases, specifically the onset of such
conditions after the first sleep record. Focusing on the
appearance of angina episodes and vital status, which
serve as the primary target outcomes for this study.
However, analyzing and interpreting the result-
ing contrast sets proved challenging due to the large
number of extracted rules. To address this, we im-
plemented post-processing steps to filter out seman-
tically unclear contrast sets, such as those containing
ambiguous terms like ”unknown” or those with insuf-
ficient support. Based on previous research, we set
a threshold of at least 50 subjects or 10% of the sur-
veyed group for a contrast set to be considered valid.
3 RESULTS
After processing the data and retaining individuals
with complete records, we kept 1,938 subjects from
the SHHS dataset and 758 subjects from the WSC
dataset for further analysis. Specifically, SHHS was
used for contrast set mining to identify relationships
Table 2: Clinical standard for converting AHI to sleep ap-
nea severity in adults, with the number of subjects in each
dataset (first measurement).
AHI value Severity SHHS WSC
0-5 Normal 382 350
5-15 Mild 824 214
15-30 Moderate 592 115
>30 Severe 316 79
between behavioral factors and the development of
cardiovascular diseases, while both datasets were an-
alyzed to evaluate the utility of the AHI metric.
3.1 Changes in AHI over Time
While processing the data from SHHS and WSC, it is
easy to recognize the drastic change in AHI between
the first and second visits in SHHS and among visits
in WSC.
3.1.1 Sleep Heart Health Study
After analyzing AHI data from the first and second
visits of the SHHS dataset, which were conducted five
years apart, more than half of the subjects (n=1,061,
54.75%) maintained the same severity level of sleep
apnea. Among the remaining subjects, 474 individu-
als (24.48%) showed a reduction in sleep apnea sever-
ity to a milder level, while 412 individuals (21.25%)
experienced an increase in severity.
We noticed some significant changes in the AHI
values between the two measurements. We have 238
(12.38%) cases ∆AHI ≥20 in which the majority de-
veloped severe apnea. The largest difference observed
was 75.56 in subject 200187, whose AHI increased
from 9.77 in the first measurement to 85.33 in the sec-
HEALTHINF 2025 - 18th International Conference on Health Informatics
978

ond measurement. This change reflects a progression
from mild to severe sleep apnea, with the AHI value
nearing three times the lower threshold of the severe
category. Specifically, the average apnea duration in-
creased from an estimated 1–2 minutes per hour (as-
suming each apnea episode lasts at least 10 seconds,
as defined by the AASM) to approximately 14 min-
utes per hour.
It is noteworthy that among all surveyed subjects,
only 22 individuals had an AHI below 1 during the
first measurement, and 38 during the second. This
raises the question: does this imply that almost ev-
eryone experiences at least one apnea event per hour,
or are these events potentially artifacts caused by sig-
nal disturbances during data collection? Addition-
ally, there are individuals with AHI values exceeding
60—38 and 56 participants for the first and second
measurements, respectively, with the highest values
surpassing 90.
Such findings cast doubt on the reliability of AHI
as an accurate metric. Among the recorded apnea
events, how many truly reflect physiological episodes
of sleep apnea, and how many result from measure-
ment noise? Disruptions in the connection between
devices and patients, caused by movement during
sleep, could introduce sudden changes, such as dips
in oxygen saturation levels and could be mistaken as
apnea events.
The instability of AHI as a metric for assessing
sleep apnea severity is even more evident in the WSC
dataset, which includes more measurement points and
a longer experimental timeline.
3.1.2 Wisconsis Sleep Cohort
In the WSC dataset, we focus on individuals whose
AHI deviates by at least 20 units from the median
value during at least one measurement. There are
81 such cases, accounting for 10.69% of the dataset.
These instances likely indicate that the AHI does not
accurately reflect the severity of sleep apnea in one or
more measurements.
For example, subject 11445’s AHI over four vis-
its was reported as 5.95, 11.82, 70.04, and 8.35. The
third visit stands out with a sudden spike to 70, con-
trasting sharply with the other measurements, which
suggest the individual generally has normal health or
mild apnea. Similar patterns are observed in other
cases, such as:
• ID 17286: 2.96 → 42.78 → 14.17
• ID 25122: 19.17 → 81.53 → 2.53
• ID 31546: 6.25 → 50.53 → 17.49
• ID 86874: 1.36 → 33.08 → 1.4 → 1.4
• ...
Subject 23154 exhibited an opposite trend com-
pared to prior examples, with AHI values fluctuat-
ing between 60.66, 23.25, and 63.5 over three vis-
its. While the second visit indicated a great improve-
ment, the third visit showed a return to the initial high
AHI, suggesting the condition remained severe over-
all. Similar trends were observed in other cases:
• ID 38751: 51.64 → 55.64 → 10.16
• ID 72224: 36.68 → 18.31 → 65.58
• ID 78382: 52.24 → 0.88 → 46.91
• ID 74274: 47.41 → 8.03 → 34.67 → 61.45
• ...
The most critical focus of our investigation is on
cases where the AHI has misjudged the severity of
sleep apnea during the first measurement. This is
particularly relevant since many studies rely on the
first AHI measurement as a foundation for develop-
ing machine learning models due to its large sample
size. For example, in the case of subject ID 89915, the
AHI was 49.66 in the first measurement, categorizing
the subject as severe, but subsequent measurements
showed AHI values of 1.29, 2.74, and 1.66, placing
the subject in the healthy range. Conversely, subject
ID 64771 had AHI values of 3.24, 26.03, and 31.54
across three visits, with the AHI increasing in subse-
quent measurements. Some other examples that we
found in the dataset:
• ID 71343: 81.76 → 3.06 → 3.3 → 3.3
• ID 43143: 34.37 → 1.92 → 1.44
• ID 42371: 0.37 → 22.59 → 20.93
• ...
These discrepancies raise a key question: is a sin-
gle AHI value sufficient to assess the severity of sleep
apnea? Moreover, when used as ground truth in ma-
chine learning models, how accurate can these models
be, given the potential inaccuracies of AHI as a met-
ric?
3.2 Cardiovascular Health
Consequence
Table 3 presents the occurrence of cardiovascular dis-
eases (CVDs) following the first visit of SHHS partic-
ipants. The data indicate a clear trend: the prevalence
of CVDs increases over time. At baseline, 1910 par-
ticipants were free of congestive heart failure (CHF),
while 28 had experienced at least one episode. After
baseline, the number of participants with at least one
CHF increased to 203. Similar patterns are observed
Reconsidering AHI as an Indicator of Sleep Apnea Severity: Insights from Mining Large, Longitudinal Sleep Datasets
979

for myocardial infarctions (MIs), heart attack-related
procedures, and strokes.
Further analysis of the dataset based on vital sta-
tus reveals that, five years after the initial visit, 270
participants had passed away. Among these, 170 in-
dividuals experienced at least one fatal cardiovascular
event, such as coronary heart disease, heart attack, or
stroke. None of these health issues were reported in
participants who remained alive. Examining the pro-
gression of cardiovascular diseases, Figure 2, the vari-
able prev chf in the deceased group increased signif-
icantly, from 4.81% before the first visit to 38.52%.
Similarly, prev mi and mi show that the prevalence
of MIs rose from 10.37% to 21.11%, whereas no
changes were observed in the surviving group.
3.3 Relationship Between the Change of
AHI and Cardiovascular Condition
To make it easy understanding, and it is also necessary
to discretize data for the contrast set mining method,
we suggest the cut-off values as follows, based on the
AHI standard and our observation:
∆AHI ∈
(∞, −15) Drastic decrease
(−15, −5) Slight decrease
(−5, 5) No change
(5, 15) Slight increase
(15, ∞) Drastic increase
It is well recognized that sleep apnea, through its
direct effects on breathing, can have significant impli-
cations for cardiovascular health. Interestingly, most
participants who experienced more than three angina
episodes over time also showed an increase in AHI
(15 out of 21). Among these individuals, all had at
least mild sleep apnea except one. Subject 202626,
despite experiencing the highest number of angina
episodes, did not have sleep apnea and maintained a
consistently low AHI over five years.
Furthermore, a reduction in AHI did not con-
sistently correlate with improved cardiovascular out-
comes. The prevalence of heart problems or the need
for heart surgeries in the group with a ”drastic AHI
decrease” was comparable to that in the group with a
”drastic AHI increase”. AHI alone can not fully cap-
ture the complex interplay between sleep apnea and
cardiovascular health.
One interesting information is a high proportion
of subjects in all groups experienced angina episodes,
with nearly half reporting at least one episode dur-
ing the five years of observation. Angina, character-
ized by chest pain or discomfort caused by insufficient
oxygen supply to the heart muscle, is plausibly linked
to the consequences of sleep apnea, where partial or
complete airway obstruction occurs. This raises the
question of whether the progression of sleep apnea
may exacerbate this condition?
3.4 Impact of Life Factors
The focus was placed on the occurrence of angina
episodes and vital status. By interpreting the con-
trast sets, we generated some hypotheses regarding
the usefulness of AHI. For better presentation, we
listed the most interesting rules in Table 4 and made
the others available to access in the following link:
https://drive.google.com/drive/folders/
1gUqNFhcYkVbgUXohBoYlZkdIfyV-UFpA?
usp=drive link
3.4.1 Impact on Angina Episodes
Major factors influencing the presence of angina in-
clude age, snoring, and neck circumference. Individ-
uals aged 60 and above are at a notably higher risk.
Frequent or loud snoring further increases the likeli-
hood of developing angina. Similarly, a neck circum-
ference exceeding 39 cm in males or 35 cm in females
is strongly associated with elevated risk.
Other influential factors include smoking, BMI,
difficulty maintaining sleep after interruptions, fre-
quently napping, intermediate triglyceride levels, and
cholesterol levels categorized as either optimal or
high. While these factors appeared less frequently in
the contrast sets, they are still important in identifying
angina risk.
An unexpected finding is the correlation between
educational attainment and angina risk. Specifically,
individuals with 16–20 years of education (typically
high school through university levels) appeared fre-
quently in the contrast sets. This suggests a hypothe-
sis that individuals with relatively high educational at-
tainment might engage in unhealthy lifestyle choices
that negatively impact their long-term health.
In terms of obstructive sleep apnea severity, con-
trast set mining revealed significant associations be-
tween mild and moderate apnea groups and angina.
Interestingly, neither the normal nor severe apnea
groups appeared in the contrast sets, regardless of
whether the right-hand side was defined as the pres-
ence or absence of angina. This is surprising given
the relatively even distribution of OSA severity levels
in the dataset.
The absence of the severe group as a significant
factor for predicting angina might support our hypoth-
esis. Specifically, an AHI greater than 30 may not
be a reliable indicator for the development of angina.
This could be attributed to the potential inaccuracy of
HEALTHINF 2025 - 18th International Conference on Health Informatics
980
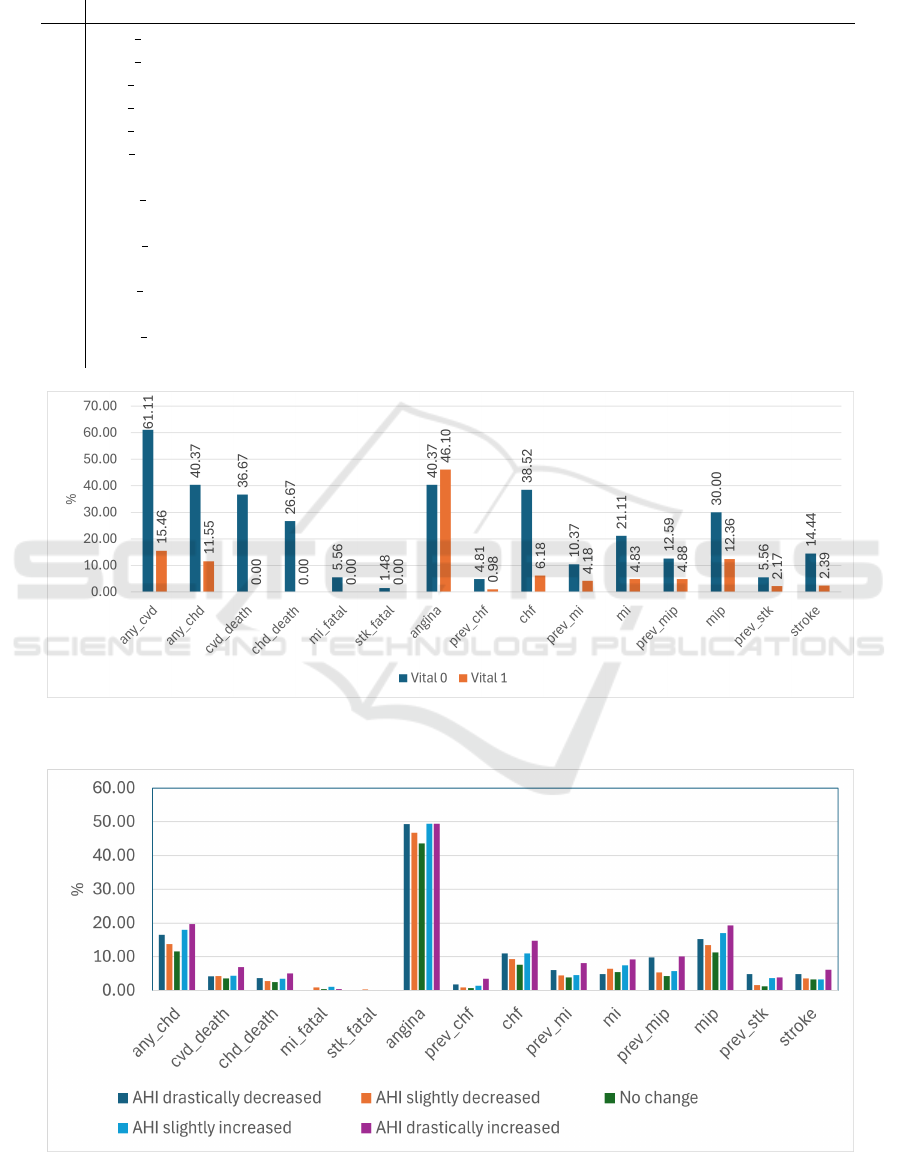
Table 3: Survey statistics on cardiovascular diseases. For rows 1-6, 0: no, 1: yes. Starting from row 7, the unit of measurement
is the number of events, where 0: does not occur, 1: occurs once, and >1: occurs more than once.
Label Description 0 1 >1
1 any cvd Any cardiovascular disease since baseline? 1515 423
2 any chd Any coronary heart disease since baseline? 1635 303
3 cvd death Fatal cardiovascular disease since baseline? 1850 88
4 chd death Fatal coronary heart disease since baseline? 1875 63
5 mi fatal Fatal heart attack since baseline? 1926 12
6 stk fatal Fatal stroke since baseline? 1934 4
7 angina Num of angina episodes since baseline 1033 868 37
8 prev chf Num of congestive heart failure episodes prior to baseline 1910 24 4
9 chf Num of congestive heart failures episodes since to baseline 1735 109 94
10 prev mi Num of myocardial infarctions prior to baseline 1844 84 10
11 mi Num of myocardial infarctions since baseline 1801 122 15
12 prev mip Num of procedures related to heart attack prior to baseline 1827 87 24
13 mip Num of procedures related to heart attack since baseline 1648 180 110
14 prev stk Num of strokes prior to baseline 1888 46 4
15 stroke Num of strokes since baseline 1867 49 22
Figure 2: The chart illustrates the percentage of individuals with at least one cardiovascular event across different vital status
groups (0: dead, 1: alive).
Figure 3: The chart illustrates the percentage of individuals with at least one cardiovascular event with groups of AHI changing
over time.
Reconsidering AHI as an Indicator of Sleep Apnea Severity: Insights from Mining Large, Longitudinal Sleep Datasets
981

Table 4: Interesting rules generated by contrast set mining method.
Subgroups Target Lift Support (%) Confidence (%)
1 Napping for more than 2 days/week AND → Deceased group 2.93 10.08 82.43
Have hypertention AND
Smoke more than 5 packs/year
2 Have hypertention AND → Deceased group 2.88 10.53 85.29
Age 70-80 AND Smoking
3 Napping for more than 2 days/week AND → Deceased group 2.86 10.51 76.71
Lose weight AND
Smoke more than 5 cigaretters/day
4 Age 40-50 AND → No angina 2.03 17.65 80.77
No napping
5 Age 40-50 AND → No angina 2.02 12.35 79.73
Female AND
Not using aspirin
6 Age 60-70 AND → Have angina 2.53 11.59 86.11
Snore louder after 5 years AND
Sometimes has problem falling asleep
7 More than 20 years of education AND → Have angina 2.38 12.56 89.06
Snoring
8 Age 60-70 AND → Have angina 2.26 14.40 87.65
Snore as loud as mumbling or talking AND
Neck circumference outside window
very high AHI values, which are more likely to result
from signal disturbances. These disturbances could
be caused by the subject’s movement or device mal-
functions during the measurement process.
The method identified only three contrast sets in-
dicating the absence of angina. These sets highlight
groups defined by younger age (40–50 years), infre-
quent or no napping, non-use of aspirin, and female
subjects.
3.4.2 Impact on Vital Status
For contrast sets related to vital status, it is reasonable
that age emerges as the most dominant factor, particu-
larly in the 70–80 age group. Hypertension, observed
both at the first measurement and in follow-up after
five years, ranks as the second most significant factor.
Once again, smoking behavior plays a crucial role in
indicating deteriorating health or even mortality. Nap-
ping also appears more frequently, which is reason-
able since the effects of sleep apnea can increase day-
time sleepiness, prompting the need for naps.
A final interesting pattern is weight loss among the
deceased group, contrasting with the angina-related
contrast sets where obesity was prominent. While
weight gain contributes to cardiovascular disease pro-
gression, specifically angina, weight loss is com-
monly observed as the body weakens in later stages.
4 DISCUSSIONS
Our analysis of longitudinal data provides evidence
that AHI is not entirely accurate. This problem has
been debated in many of the existing studies (Punjabi,
2016; Kulkas et al., 2013; Soori et al., 2022). The
findings of this study further support the hypotheses
proposed in earlier research. Errors can arise due to
the natural variability of sleep and the complex nature
of related disorders, which remain poorly understood.
This issue is clearly reflected in specific cases from
both datasets, as detailed in our results section.
To enhance the accuracy of OSA diagnosis, it is
ideal to employ multiple sleep records collected over
time and consider the effect of disturbed signal. Al-
though there is a foundation for this assumption, it
remains challenging to establish that all body move-
ments are associated with errors in scoring apnea
events. Introducing a penalty index for signals with
high noise ratios may be a potential approach; how-
ever, this requires a comprehensive evaluation of sig-
nal quality through further study. Moreover, the in-
herent inaccuracies of AHI should be accounted for to
avoid developing machine learning models that over-
fit the data by focusing solely on achieving the high-
est accuracy. (Kulkas et al., 2013) questioned the
reliance on the AHI as a sole indicator of sleep apnea
severity and proposed four new parameters to better
characterize the condition. Their study, with a median
HEALTHINF 2025 - 18th International Conference on Health Informatics
982

follow-up of 183 months, examined the correlation
of these parameters with patient mortality and found
them to be more accurate in predicting mortality out-
comes. If validated, these parameters would neces-
sitate a reassessment of existing sleep apnea scor-
ing systems. However, a limitation of the study is
the wide interval between measurements; incorporat-
ing daily or weekly sleep records, achievable through
wearable technology, would enhance the robustness
of the findings.
The notable achievement of contrast set mining
in our analysis lies in its ability to condense vast
datasets and highlight dominant risk factors in rela-
tion to the selected outcomes. This methodological
strength enables researchers to identify and priori-
tize meaningful patterns that might otherwise be over-
looked, thus forming a foundation for more targeted
and hypothesis-driven investigations.
A significant limitation of contrast set mining is
the difficulty in interpreting the rules without prior
knowledge. The process of post-processing to select
important rules also depends on the researcher’s ex-
pertise. In this study, we utilized a wealth of infor-
mation from the questionnaire; however, due to the
complexity of the responses, some data were not ad-
equately captured in the contrast sets. This challenge
highlights the need for careful selection and interpre-
tation of the data to ensure meaningful insights are
derived.
5 CONCLUSION
This study highlights key insights into the limitations
of using the AHI as the ground truth for classify-
ing sleep apnea severity and its relationship to car-
diovascular health. We demonstrate that relying on a
single-night sleep record can be inaccurate, and longi-
tudinal tracking with multiple sleep records provides
greater reliability. Our findings show no clear rela-
tionship between changes in apnea severity and the
development of cardiovascular diseases. Addition-
ally, through contrast set mining, we identified key
factors linked to adverse heart health trends, including
age, snoring frequency, and smoking habits. These
discoveries provide hypotheses for future studies to
better understand cardiovascular risk factors.
ACKNOWLEDGMENTS
This study was sponsored by Japan Society for the
Promotion of Science Grant-in-Aid for Early-Career
Scientists (Grant Number 21K17670).
REFERENCES
Bay, S. D. and Pazzani, M. J. (2001). Detecting group
differences: Mining contrast sets. Data mining and
knowledge discovery, 5:213–246.
Bittencourt, L. R. A., Suchecki, D., Tufik, S., Peres, C.,
Togeiro, S. M., Bagnato, M. D. C., and Nery, L. E.
(2001). The variability of the apnoea–hypopnoea in-
dex. Journal of sleep research, 10(3):245–251.
Byun, J.-H., Kim, K. T., Moon, H.-j., Motamedi, G. K.,
and Cho, Y. W. (2019). The first night effect dur-
ing polysomnography, and patients’ estimates of sleep
quality. Psychiatry research, 274:27–29.
Gamberger, D. and Lavrac, N. (2011). Expert-guided sub-
group discovery: Methodology and application. arXiv
e-prints, pages arXiv–1106.
Hoang, N. and Liang, Z. (2023). Contrast set mining
for actionable insights into associations between sleep
and glucose in a normoglycemic population. In Pro-
ceedings of the 16th International Joint Conference
on Biomedical Engineering Systems and Technolo-
gies (BIOSTEC 2023), pages 522–529. INSTICC,
SciTePress.
Kulkas, A., Tiihonen, P., Julkunen, P., Mervaala, E., and
T
¨
oyr
¨
as, J. (2013). Novel parameters indicate signif-
icant differences in severity of obstructive sleep ap-
nea with patients having similar apnea–hypopnea in-
dex. Medical & biological engineering & computing,
51:697–708.
Levy, J.,
´
Alvarez, D., Del Campo, F., and Behar, J. A.
(2023). Deep learning for obstructive sleep apnea
diagnosis based on single channel oximetry. Nature
Communications, 14(1):4881.
Punjabi, N. M. (2016). Counterpoint: is the apnea-
hypopnea index the best way to quantify the severity
of sleep-disordered breathing? no. Chest, 149(1):16–
19.
Quan, S. F., Howard, B. V., Iber, C., Kiley, J. P., Nieto,
F. J., O’Connor, G. T., Rapoport, D. M., Redline, S.,
Robbins, J., Samet, J. M., et al. (1997). The sleep heart
health study: design, rationale, and methods. Sleep,
20(12):1077–1085.
Rapoport, D. M. (2016). Point: Is the apnea-hypopnea
index the best way to quantify the severity of sleep-
disordered breathing? yes. Chest, 149(1):14–16.
Soori, R., Baikunje, N., D’sa, I., Bhushan, N., Nagab-
hushana, B., and Hosmane, G. B. (2022). Pitfalls of
ahi system of severity grading in obstructive sleep ap-
noea. Sleep Science, 15(S 01):285–288.
Young, T., Palta, M., Dempsey, J., Peppard, P. E., Nieto,
F. J., and Hla, K. M. (2009). Burden of sleep apnea:
rationale, design, and major findings of the wisconsin
sleep cohort study. WMJ: official publication of the
State Medical Society of Wisconsin, 108(5):246.
Zhang, G.-Q., Cui, L., Mueller, R., Tao, S., Kim, M.,
Rueschman, M., Mariani, S., Mobley, D., and Red-
line, S. (2018). The national sleep research resource:
towards a sleep data commons. Journal of the Amer-
ican Medical Informatics Association, 25(10):1351–
1358.
Reconsidering AHI as an Indicator of Sleep Apnea Severity: Insights from Mining Large, Longitudinal Sleep Datasets
983
