Paint Blob Detection and Decoding for Identification of Honey Bees
Andrea P. G
´
omez-Jaime
3
, Luke Meyers
1
, Josu
´
e A. Rodr
´
ıguez-Cordero
1,2
,
Jos
´
e L. Agosto-Rivera
2
, Tugrul Giray
2
and R
´
emi M
´
egret
1
1
Department of Computer Science, University of Puerto Rico, R
´
ıo Piedras, Puerto Rico
2
Department of Biology, University of Puerto Rico, R
´
ıo Piedras, Puerto Rico
3
Department of Biology, Universidad de Los Andes, Colombia
a.gomezj@uniandes.edu.co, {luke.meyers, josue.rodriguez10, jose.agosto1, tugrul.giray, remi.megret}@upr.edu
Keywords:
Computer Vision, Deep Learning, Re-Identification, Honey Bee Monitoring, Paint Code Recognition.
Abstract:
This paper evaluates a new method for the automated re-identification of honey bees marked with paint codes
using fewer annotations than previous methods. Monitoring honey bees and understanding their biology can
benefit from studies that measure traits at the individual level, requiring methods for re-identification. Marking
with colored paint is one method used by biologists for re-identification in the field because it is noninvasive
and readable by humans. This work uses the YOLOv8 object detection approach to detect and classify colored
paint markings. A new algorithm to decode the identity based on bi-color left/right paint code is proposed.
The proposed approach was evaluated on an extensive dataset with 64 distinct color code identities composed
of combinations of 8 different colors, with the test set featuring over 4000 images of 64 unseen individuals.
The proposed approach reached 93% top-1 accuracy in the recognition of 1 vs 64 identities, achieving bet-
ter performance than previous methods while requiring fewer annotated images per identity. The proposed
approach also provides insights into the factors affecting re-identification accuracy, such as illumination and
paint color combinations, facilitating improved experimental design and data collection strategies for future
insect monitoring applications.
1 INTRODUCTION
Honey bees play a crucial role in ecosystems and hu-
man societies, as important and frequent pollinators
in ecosystems worldwide (Hung et al., 2018). It is es-
timated that in the USA alone, honey bee pollination
generates 12 billion dollars annually in crops (Khalifa
et al., 2021).
Honey bee behavior analysis is important for opti-
mizing conservation and management strategies. Un-
derstanding bee behavior could allow for selective
breeding for specific genetic traits, potentially yield-
ing economic benefits. Field experiments often in-
volve measuring behaviors at the individual level.
However, it is time-consuming and challenging to
maintain accurate records of many individuals. To
obtain statistically relevant sample sizes, current ex-
perimental methods can take weeks of data collection
(Cakmak et al., 2009; Giray et al., 2015; Noel et al.,
2018).
During these experiments, individuals are marked
by scientists to simplify the counting and tracking
processes. Several marking techniques are used, in-
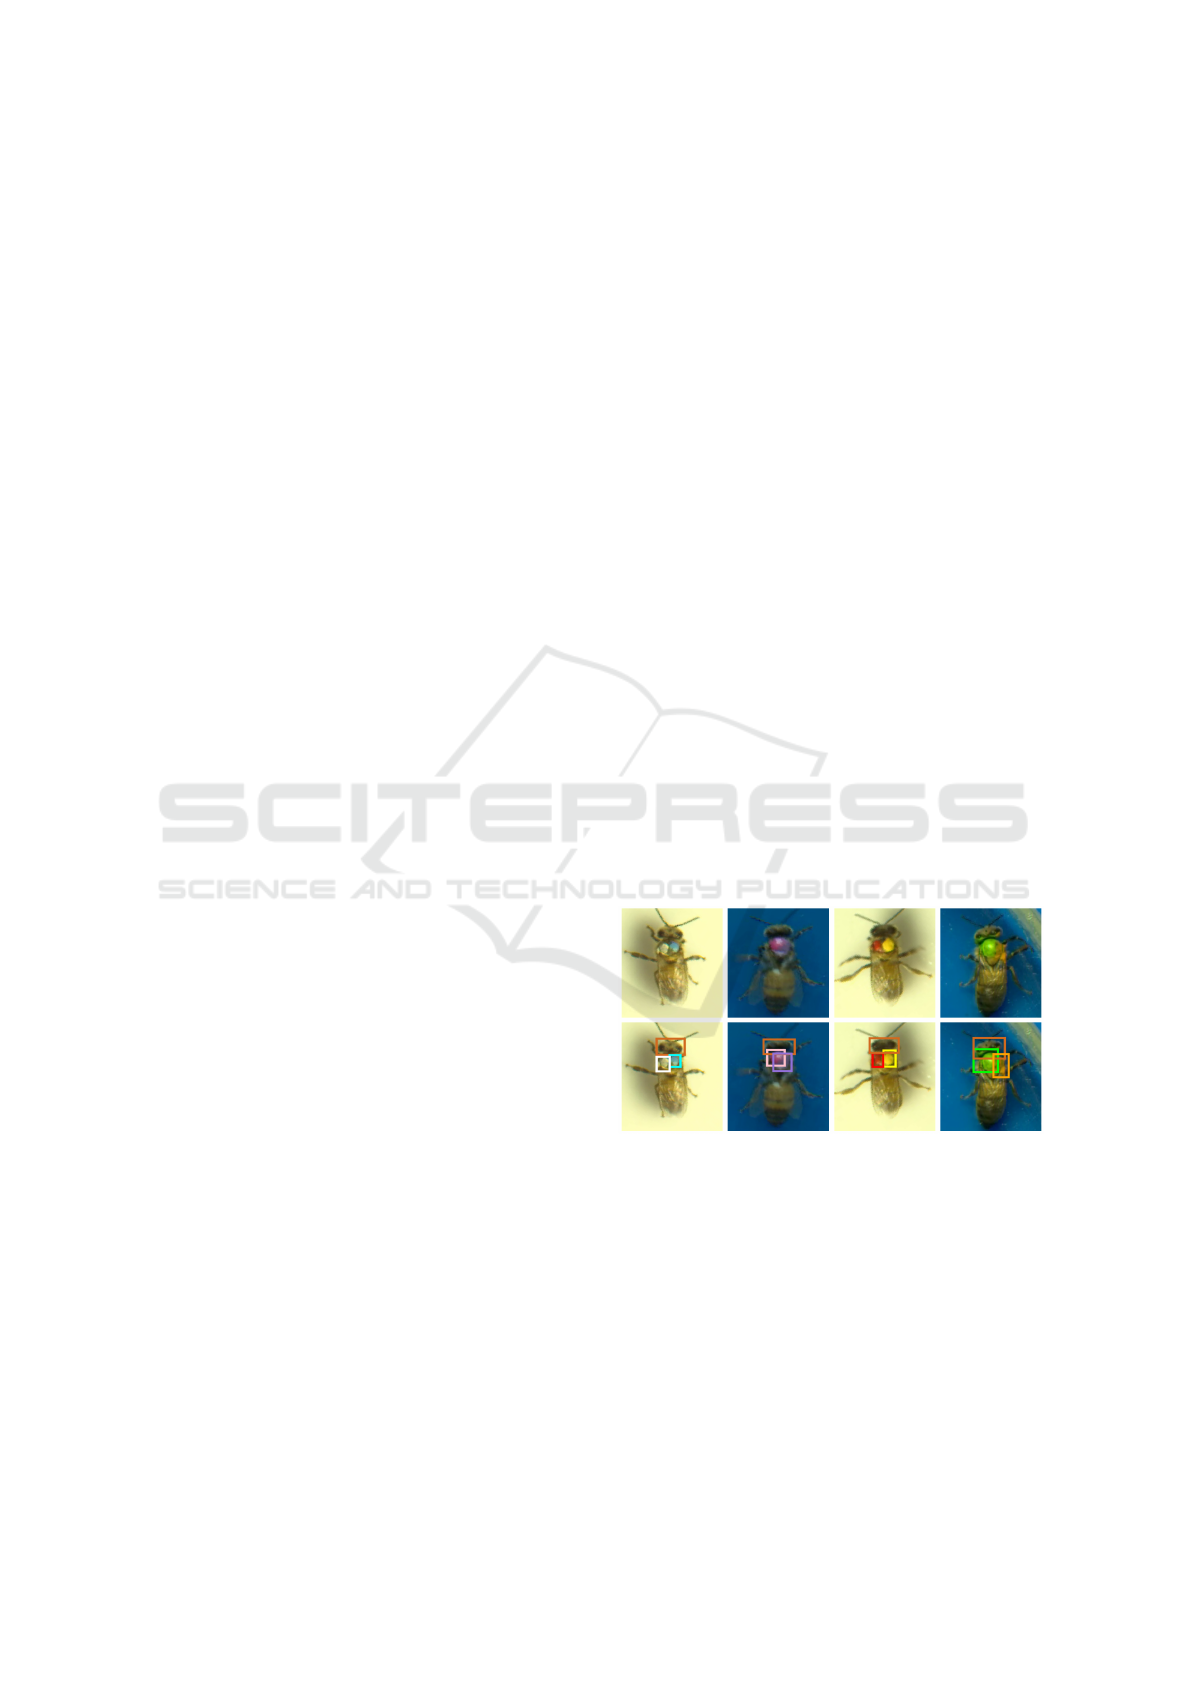
Figure 1: Sample of image of honey bees with paint codes
from (Santiago-Plaza et al., 2024) and the annotation of
bounding boxes for each paint marking, as well as the head.
cluding attaching numbers tags, barcodes (Crall et al.,
2015), or RFID elements to the bees’ thorax (Streit
et al., 2003). Simple paint markings are a less in-
trusive way of distinguishing individuals. We seek
to automate the detection and tracking of these paint
codes, to distinguish individuals without altering their
natural behavior in the field.
Recently, the potential of automatically identify-
ing paint marks with machine learning approaches
242
Gómez-Jaime, A. P., Meyers, L., Rodríguez-Cordero, J. A., Agosto-Rivera, J. L., Giray, T. and Mégret, R.
Paint Blob Detection and Decoding for Identification of Honey Bees.
DOI: 10.5220/0013385800003912
Paper published under CC license (CC BY-NC-ND 4.0)
In Proceedings of the 20th International Joint Conference on Computer Vision, Imaging and Computer Graphics Theory and Applications (VISIGRAPP 2025) - Volume 2: VISAPP, pages
242-250
ISBN: 978-989-758-728-3; ISSN: 2184-4321
Proceedings Copyright © 2025 by SCITEPRESS – Science and Technology Publications, Lda.

was tested by comparing supervised color classi-
fication and supervised contrastive learning (SCL)
(Santiago-Plaza et al., 2024). The authors evaluated
the effect of training data amount and variety on per-
formance, to suggest protocols for practical applica-
tions. The results, showing 85% top-1 accuracy to
recognize 1 within 64 identities demonstrated strong
potential for automated detection of paint markings.
However, these models rely on large amounts of train-
ing data to achieve the best re-identification accu-
racy. Obtaining such training data is an intensive,
time-consuming, and costly process, which limits the
methods’ usability in dynamic real-world applica-
tions.
In this work, we explore an alternative approach
for re-identification that takes advantage of more fine-
grained annotation to reduce the number of train-
ing images required, while providing more general-
izable and explainable outputs. The proposed ap-
proach is based on the modern convolutional neu-
ral network (CNN) based object detection method
YOLOv8 (Jocher et al., 2023) to detect and classify
individual paint blobs and a new algorithm to convert
these detections into color codes.
After discussing related work in section 2, we will
introduce the method in section 3. Experimental re-
sults in section 4 will show the amount of data annota-
tion necessary to achieve strong performance. A more
detailed discussion in section 5 will identify the main
sources of error, and discuss considerations for future
use of paint marking identification in biological field
studies of honey bees.
2 RELATED WORK
Traditional methods for behavioral experiments with
honey bees depend on humans visually tracking indi-
viduals, a practice constrained by the human capacity
to identify and monitor only a limited number of bees
at once. Previous studies, for example, have tracked
no more than four bees per trial (Cakmak et al., 2009).
In order to track multiple honey bees simultaneously,
researchers have used several types of marking meth-
ods with the goal of giving each individual a spe-
cific identity to detect and track. The primary meth-
ods used have been barcode tags (Rodriguez et al.,
2022; Wario et al., 2015; Crall et al., 2015), RFID
tags (Alburaki et al., 2021; Colin et al., 2022), and
retro-reflective tags (Smith et al., 2021). Addition-
ally, there have been proposed methods that do not
require markings, both for bumblebees (Borlinghaus
et al., 2023) and honey bees (Bozek et al., 2021; Chan
et al., 2022). These methods typically leverage rep-
resentation learning to distinguish individuals based
on learned vectors (Romero-Ferrero et al., 2019; Li
et al., 2019; Papafitsoros et al., 2022; Bergamini et al.,
2018).
The use of paint marks is a middle ground be-
tween the tag-based marking methods and the un-
marked methods, and has the benefit of being easily
distinguishable by humans. This marking process is a
simpler alternative to RFID or barcode tagging, as it
may be done directly in the field by simply applying
small paint dots directly on thoraxes of honey bees.
Approaches utilizing color mark detection have
been applied to animal re-identification in other
species. For instance, Bergamini et al. (2018) uti-
lized multi-view embeddings and convolutional neu-
ral networks (CNNs) to re-identify individual cows
by taking advantage of their natural spots. Simi-
larly, specialized protocols have been developed for
insect re-identification using color tags. One such
system, AnTrax, tracks individual ants which have
been marked with color tags in both their thorax
and abdomen, using CNNs for identification (Gal
et al., 2020). The approach is holistic, as both paint
blobs are classified simultaneously, which requires
the training of each pair of colors, with the annotation
of several replicates to obtain reliable identification.
The case of honeybee re-identification using paint
marks for foraging experiments was first examined
by Meyers et al. (2023). Representation learning
approaches showed promise on painted honeybees,
achieving strong performance on a relatively small
test set. A model trained on 16 identities using a su-
pervised contrastive learning approach (SCL) to learn
a 128-dimensional feature vector achieved 90% accu-
racy at paint code re-identification on 11 previously
unseen identities. Work presented by Santiago-Plaza
et al. (2024), more thoroughly evaluated this approach
using a new dataset of 8062 images in various condi-
tions, across 128 identities and 64 paint codes. This
new data was used to train and evaluate the same ar-
chitecture presented in Meyers et al. (2023), and a
Color Recognition (CR) model. Up to 64 images per
identity were labeled with an ID code for contrastive
learning. The CR color classification model used a
16 digit binary code representing the presence or ab-
sence of 8 paint colors on either the right or left side
of each bee thorax. Both models utilized a truncated
ResNet backbone. While the contrastive learning
model demonstrated a remarkable accuracy of 97.6%
when used to identify only 8 identities, for all 64 test
IDs the CR color classifier demonstrated the best per-
formance with a top accuracy of 85%. These results
demonstrated that paint markings hold strong promise
for lightweight re-identification of honey bees. They
Paint Blob Detection and Decoding for Identification of Honey Bees
243

also showed that contrastive learning better distin-
guishes IDs when trained on a larger distribution of
conditions relative to their final application. Finally,
with less training data, a classification approach that
”reads” the color code may more easily achieve strong
performance for re-identification.
3 METHODS
Following the implication from the related work to-
wards the usefulness of more strongly supervised
techniques for Re-ID, we evaluate in this paper the
identification of individuals by explicitly detecting
and classifying their individual paint marks, instead
of considering only a holistic representation of the im-
age. Although not using the full information available
(we will ignore the abdomen appearance), the ratio-
nale is that detecting simpler concepts found in small
numbers (individual paint blobs within 8 colors) and
composing them into more complex and numerous
ones (64 bi-color paint codes) will reduce the need for
annotated data, and also provide better explainability
of the re-identification errors.
3.1 Dataset and Annotations
This work is based on the same 8062 image dataset
gathered by Santiago-Plaza et al. (2024). The image
dataset was created by processing video footage of
128 individual bees featuring 64 unique paint mark-
ings. Each bee was marked with a color ID consist-
ing of one or two of eight shades of enamel paint:
bright shades of red, lilac, yellow, blue, green, pink,
orange and white. Markings were performed follow-
ing standard practices as described in Giray et al.
(2015). Individual honey bees were all marked during
the first two days post-eclosion, described as young
adult bees. During this time they are not yet strong
enough to sting or fly away, greatly facilitating the
handling and data collection.
During the image dataset creation process, detec-
tion models for image extraction tracked individuals
as they moved through the camera’s field of view.
Thus, each final image is associated to a sequential
group of images of the same individual, called a track.
Tracks are not human reviewed, and may be noisy in
real-world applications with many bees present and
with the potential for occlusions.
The source dataset (Santiago-Plaza et al., 2024)
consists of 128 individual bees divided into two
batches each with 64 identities. All images were an-
notated with one of the 64 color ID (left and right
color), which was known and fixed for each track.
For this paper, a subset was additionally annotated
for the spatial location and color of each paint blob.
The evaluation was designed to train exclusively on
individuals from batch 1 and test on batch 2. This
evaluation approach is designed to evaluate the gen-
eralization to individuals not seen during the training,
and limiting the need for retraining models in the field
when new individuals are added to the list of identities
to be recognized.
A total of 9 images for each of the 64 color IDs
was annotated: 7 images per color ID were randomly
sampled in batch 1 and 2 images in batch 2. These im-
ages were annotated for the bounding boxes for each
individual paint mark using the online annotation tool
CVAT (Sekachev et al., 2020) as shown in Fig. 1.
Each bounding box was labeled with one of the 8
color classes. During training, the 7 images per color
ID from batch 1 were split further into 5 for training
and 2 for validation.
In addition, the bee head’s bounding box was an-
notated. While our goal is to decode the paint mark-
ings for re-ID, detecting the head as an additional
class will allows us to infer the relative location of
the markings regardless of bee orientation, further de-
scribed below.
3.2 Colored Paint Mark Detection
To implement this method, we use a YOLOv8 model
for detecting and classifying paint marks on honey
bees. YOLO-based architectures have demonstrated
potential in ecological applications. For instance,
Chappidi and Sundaram (2024) achieved a mean Av-
erage Precision (mAP) of 96.03% in detecting ani-
mals in complex environments using a YOLO-based
model. Moreover, YOLO-based architectures have
been widely employed for wildlife detection and in
agricultural contexts (Schneider et al., 2018; Badgu-
jar et al., 2024).
Individual paint marks were detected using a
YOLOv8x detection/classification model trained on
the bounding boxes and 9 classes defined in the
dataset (8 distinct colors classes and 1 head class).
Training was performed with a batch size of 32
and an average of 470 epochs with early stopping at
a patience of 100. Training data was augmented with
random rotation arund the center within a range of
0-180°, and by mirroring the image horizontally or
vertically with a probability of 50%. All honeybee
individuals were centered around the waist keypoint
to ensure that no data would be lost when performing
such rotation.
VISAPP 2025 - 20th International Conference on Computer Vision Theory and Applications
244

3.3 Image Level ID Recognition
Once individual paint blobs were detected, a geo-
metric approach was implemented to locate the rel-
ative position of the markings regardless of orienta-
tion. Our method uses the relative angles between
the detection of the head and the paint markings to
determine the order-dependent color code, therefore
recognizing the left and right sides.
The center of each bounding box was calculated
using their respective coordinates. Once each cen-
ter was obtained, the middle point between the paint
markings was calculated. Three vectors were de-
fined: one between the midpoint and the center of
the bounding box for the head (head vector)
⃗
A and
two between the midpoint and the center of each color
mark’s bounding box (color vectors)
⃗
B,
⃗
C. Algorithm
1 uses dot and cross products of the color vectors with
the head vector to calculate angles θ and φ with re-
spect to the head vector, as shown in Figure 2. The
maximum of these two angles is selected to indicate
the left color detection.
Algorithm 1: Find Left Color.
Input: Center points C
head
,C
1
,C
2
Output: The maximum angle between
vectors, representing the left paint
center.
M ←
C
1
+C
2
2
⃗
A ←
⃗
MC
head
⃗
B ←
⃗
MC
1
⃗
C ←
⃗
MC
2
θ
1
← arccos
⃗
A·
⃗
C
∥
⃗
A∥∥
⃗
C∥
Φ
1
← arccos
⃗
A·
⃗
B
∥
⃗
A∥∥
⃗
B∥
θ
2
← arcsin
∥
⃗
A×
⃗
C∥
∥
⃗
A∥∥
⃗
C∥
Φ
2
← arcsin
∥
⃗
A×
⃗
B∥
∥
⃗
A∥∥
⃗
B∥
if θ
2
< 0 then
θ
1
← 360 − θ
1
end
if Φ
2
< 0 then
Φ
1
← 360 − Φ
1
end
return max(θ
1
,Φ
1
)
Once the relative order of the bounding boxes is
calculated, the bee identity can be decoded by map-
ping each ordered color pair to its identity. In the case
where only one paint blob is detected, it is mapped to
one of the 8 single color codes.
Figure 2: Illustration of a painted honey bee thorax. Boxes
represent detections of head and color blobs, with theta (in
green) and phi (in red) angles identified. See Algorithm 1
for details.
3.4 Track Level ID Recognition
The dataset contains the track information. Each track
is associated to a unique ID. To leverage this informa-
tion, which can be obtained in the field when mon-
itoring and tracking multiple individuals, a consen-
sus can be obtained by aggregating the IDs inferred
in each individual images in the same track. In this
work, we considered that the track’s overall ID is ob-
tained through majority voting (i.e. the class most
represented in the images within the track).
3.5 Evaluation
Due to the multi-step nature of identification in this
method, evaluations at various levels of granularity
Figure 3: Impact of the number of annotated images
per class during training on the bounding box detec-
tion/classification performance on 128 test images. Color
classes uses YOLOv8 for both detection and color classifi-
cation of the 8 colors of paint, Single class uses YOLOv8
for just paint detection, aggregating all colors into one class.
Error shown is standard deviation across 5 different training
sets.
Paint Blob Detection and Decoding for Identification of Honey Bees
245

were performed. These evaluations at various stages
of the process help to understand where the model
fails and is most impacted by changes in training data
and distribution.
Bounding Boxes. Fully trained models were first
evaluated on 128 annotated test images to obtain met-
rics of bounding box performance. Bounding box
predictions were evaluated with and without individ-
ual color classification. As a single stage model,
YOLOv8 performance is typically evaluated on both
detection and classification at once. By aggregating
all color classes into a single class, we can isolate just
the detection step of the process and compare the rel-
ative error between detection and classification tasks.
YOLOv8 models were evaluated using the mean aver-
age precision (mAP) of detection of bounding boxes
at an IoU of 0.5 for predicted bounding boxes.
Identity Prediction. The models were then used to
predict bounding boxes for all 4019 images of batch
2. Because YOLOv8 models can detect more than
two blobs per sample, only the two most confident
non-head bounding boxes were examined per image.
To account for single color IDs, remaining predictions
were filtered by a confidence threshold of 0.25. After-
ward, each image was parsed to obtain an ID predic-
tion using the geometric approach described in Sec-
tion 3.3. By evaluating on the entirety of batch 2,
application of this method on new identities was rig-
orously evaluated.
Finally, models were evaluated on test images
connected to tracks, and IDs were predicted using the
consensus of predicted identity from the entire track.
For this evaluation, tracks with fewer than 3 images
were excluded, leading to a total of 493 tracks.
4 RESULTS
4.1 Detection and Classification
Figure 3 shows the impact of the number of training
images per identity on the quality of bounding box
detection. Models were trained with different ran-
dom subsets of the annotated training images, rang-
ing from 1 to 5 images per identity. For each training
set where there were fewer than 5 images per identity,
bootstrap sampling was performed to obtain at least 5
runs. The plot shows the average and standard devi-
ation mAP with IoU of 50% (mAP50) metric for all
runs of a given training set. The color class model is
the standard approach: each paint color is annotated
with its own class. The second single class model ag-
gregated all paint colors into a single class. Although
the YOLOv8 model was also trained to detect the
heads for subsequent ID decoding, all mAP metrics
shown are calculated exclusively in the paint classes.
A top mAP50 of 0.98 detection alone, and 0.96 on
detection and classification was achieved using the
total of 320 annotated images. The models trained
with just one annotated class per identity still showed
remarkable performance, with an average mAP50 of
0.86 and a maximum of 0.91.
4.2 Identification from a Single Image
The classification of ID for each image was evalu-
ated using top-1 accuracy. Figure 4 compares the
identification accuracy by number of training images
per class alongside the results of Santiago-Plaza et al.
(2024). The BBox ReID Method is the currently pre-
sented method of decoding YOLOv8 detections, com-
pared with a supervised contrastive learning (SCL
ReID) approach and the color recognition approach
(CR), to contrast with the higher supervision level
of the bounding box approach. The YOLOv8 based
method shows greater performance compared to the
other approaches, while requiring an order of magni-
tude fewer images per class in the training set.
4.3 Identification Using Multiple Views
We can further improve ID level classification by
leveraging multiple views of the same individual. Fig-
ure 5 shows the relative identification performance of
YOLOv8 based ReID using recognition at image and
track levels. In Single image the decoding of the pre-
dicted bounding boxes is used for the ID prediction
independently in each image. In Track, the majority
voting for each track is computed before evaluating
the accuracy. For the largest model (trained on 5 im-
ages per ID), the accuracy for the single image re-id
method was 89.7%, while track-level re-id achieved
93%.
5 DISCUSSION
Paint Detection and Classification. Figure 3
demonstrates that even with only one annotation per
identity the YOLOv8 model is able to detect and
classify on average 85% of paint marks, reaching a
top mAP50 with the largest training dataset of 95%.
When comparing the average mean metrics of the
color class and the single class models, it appears
VISAPP 2025 - 20th International Conference on Computer Vision Theory and Applications
246
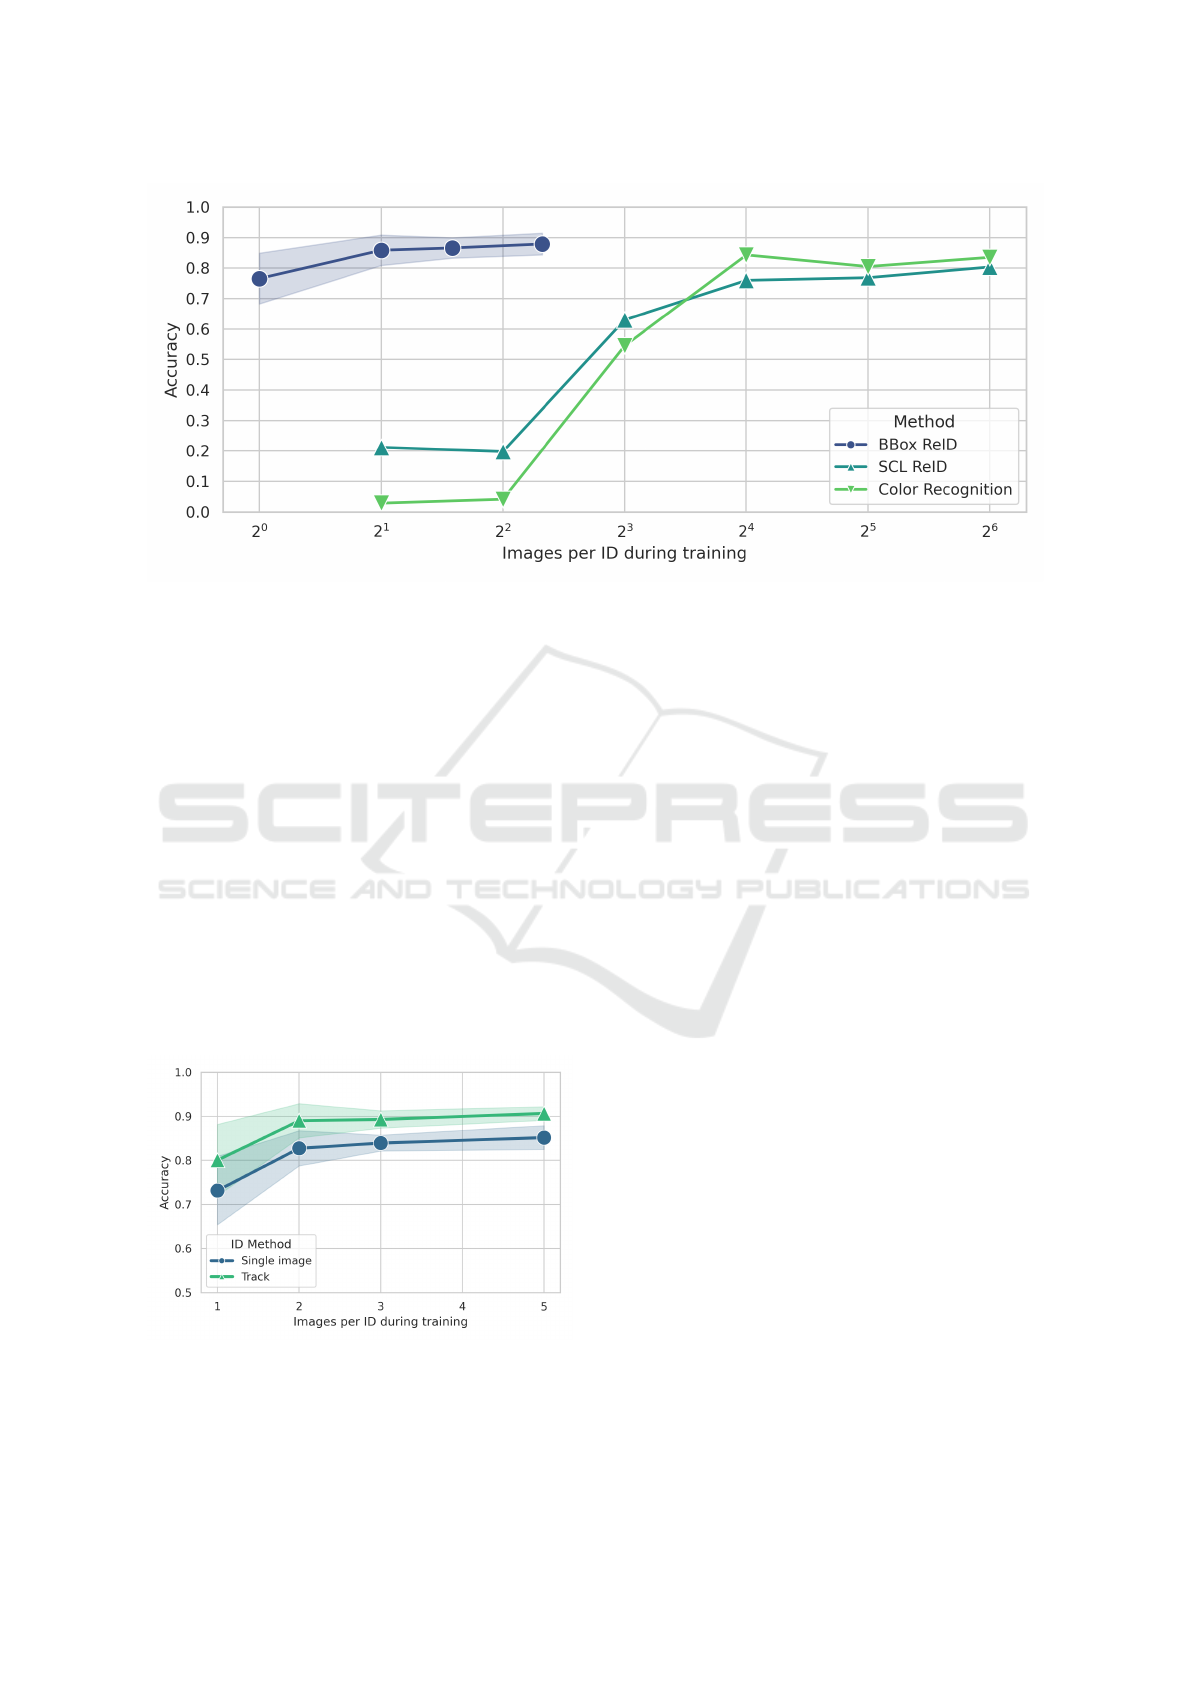
Figure 4: Comparison of re-identification accuracy per number of training images per class between YOLOv8 based detection
(BBox ReID), supervised contrastive learning (SCL ReID) and color recognition approach (CR) methods. Error shown for
BBox approach is standard deviation over multiple training sets.
that regardless of the training set size, a relatively con-
stant level of error results from misclassification rela-
tive to misdetection. The two average mAP50 series
follow near parallel trajectories, demonstrating that
even when the model is relatively less accurate in its
detections it is not proportionally less accurate in its
classifications.
ID By Decoding Paint Marking at Scale. The pro-
posed bounding box-based ReID approach consis-
tently outperforms re-identification using other meth-
ods. It performs better than both the supervised con-
trastive learning (SCL) and color recognition (CR)
approaches with fewer annotations. At just 2 anno-
tated images per class, the bounding box method is
able to identify unseen codes at an accuracy of 82.7%
Figure 5: Comparison of BBox Re-identification accuracy
between using both single image and track consensus ap-
proaches to determine ID, for several number of training
images per class.
, roughly 4 times greater than the best performing
model using other methods. Additionally, the bound-
ing box method does not need a reference set to gen-
eralize to new identities such as in SCL methods.
The integration of identification at the track level
increases accuracy across all training sets, reaching
a peak accuracy of 93%. However, there appears to
be a diminishing benefit of track level ID with in-
creasing identification accuracy. For training sets with
one image per class, using track level predictions in-
creased the accuracy on average 6.9% while on the
largest training set, the benefit was 3.3%. This trend
suggests that there remains an upper limit of perfor-
mance due to hard samples regardless of momentary
poor image conditions or occlusions, which are ex-
pected to be corrected for across the duration of the
track.
Confused Classes. Drawing upon the implication
of a set of hard identities, and the results that a rel-
atively constant amount of detections are misclassi-
fied, we quantitatively and qualitatively examined the
worst performing identities. Figure 6 shows correct
and incorrect predictions on the three worst perform-
ing identities, each with an average accuracy of <50%
across all models. Table 1 displays the most frequent
mis-classifications of these identities, and their re-
spective frequencies.
The majority of the errors are consistently due to
the same colors: orange, red, pink, and yellow. Pink-
yellow is mistaken for pink-orange, pink-red is mis-
taken for pink only, and orange-red is mistaken for
orange-pink. Although the data contains a variety
Paint Blob Detection and Decoding for Identification of Honey Bees
247
of lighting conditions, relative differences in illumi-
nation can make distinguishing these closely related
shades difficult. Given that changes in environmen-
tal lighting significantly affected paint detection ac-
curacy, selected shades should be more distinguish-
able, particularly considering the wide possibilities of
lighting variation in outdoor conditions in the case of
real-world applications.
Figure 6: Randomly sampled examples of correct predic-
tions (left) and incorrect predictions (right) of the 3 worst
performing IDs with Top1 <50%. Numbers are model pre-
diction confidence. Bounding box and confidence value text
colors correspond to predicted color classes. GT: ground
truth; Pred: prediction.
Table 1: Class label, mAP50, predicted labels and thier
counts and percentages for the three worst performing test
identities.
Class mAP50 Predicted Counts % of Class
Pink-Yellow 0.13
Pink-Orange 42 0.86
Pink-Yellow 6 0.12
Red-Yellow 1 0.02
Pink-Red 0.3
Pink 37 0.58
Pink-Red 23 0.36
Red-Yellow 3 0.05
Red-Pink 1 0.02
Orange-Red 0.45
Orange-Pink 35 0.55
Orange-Red 26 0.41
Pink-Red 2 0.03
Red 1 0.02
6 CONCLUSIONS
This work presents a simple and effective method
for identification of honey bees marked with colored
paint codes. It achieves superior identification ac-
curacy than other methods with orders of magnitude
fewer training data. We highlight the practical advan-
tages of a YOLOv8-based approach in automating ex-
periments involving honey bees, particularly for be-
havioral research involving tracking individuals.
However, the findings also reveal certain limita-
tions, including the challenges posed by color con-
fusion among similar shades (e.g., pink-red, pink-
orange) and the impact of varying illumination con-
ditions on detection accuracy. These limitations un-
derscore the need for careful selection of paint colors
and standardized application protocols to ensure con-
sistent performance. Best practices for paint marking
of honey bees may be to use only one shade from con-
fused pairs, such as only red or pink.
Experimental results also showed the gain of us-
ing spatio-temporal aggregation of information, as the
track-level inference strongly improved identification
accuracy. This approach highlights the potential for
leveraging temporal information to address transient
occlusions of individuals or poor image conditions in
real-world scenarios.
Within bee research, this method could be readily
applied to the artificial flower patch assay to under-
stand individual foraging preferences and competition
(Rodr
´
ıguez-Cordero et al., 2024), and to track indi-
vidual bees entering and exiting the colony to inves-
tigate social dynamics, foraging patterns, and disease
transmission. Due to the simplicity and generality of
paint marking, there is potential to apply this method
to multiple biological, ecological or agricultural tasks,
to monitor animal behavior, and especially insects, as
they require particular attention when tagging due to
their small size.
By addressing these limitations and exploring
these future directions, this method can be further
developed to serve as a versatile tool for ecological
research, enabling more efficient and scalable moni-
toring of individual organisms across diverse environ-
ments, with a particularly lightweight form of mark-
ing
Furthermore, although we ignored the recognition
of non-paint features (such as the abdomen patterns
or body morphology) in this work in order to focus on
the exploration of the potential of explicit paint detec-
tion, these other features are expected to bring com-
plementary information. They could be used in future
work in combination with the paint code to make the
re-id more robust, or to multiply the number of indi-
VISAPP 2025 - 20th International Conference on Computer Vision Theory and Applications
248

viduals that can be recognized by using these other
features to discriminate between individuals sharing
the same paint code, potentially reducing the need for
bi-color marks to single paint marks to further sim-
plify the practical deployment in the field.
ACKNOWLEDGEMENTS
This research was supported by NSF award 2318597,
USDA/NIFA award 2021-67014-34999 and by IQ-
BIO REU, NSF award 1852259. This work used
the UPR High-Performance Computing facility, sup-
ported by NIH/NIGMS, award 5P20GM103475.
REFERENCES
Alburaki, M., Madella, S., and Corona, M. (2021). Rfid
technology serving honey bee research: A compre-
hensive description of a 32-antenna system to study
honey bee and queen behavior. Applied System Inno-
vation, 4(4):88.
Badgujar, C. M., Poulose, A., and Gan, H. (2024). Agricul-
tural object detection with you look only once (yolo)
algorithm: A bibliometric and systematic literature re-
view.
Bergamini, L., Porrello, A., Dondona, A. C., Del Negro, E.,
Mattioli, M., D’alterio, N., and Calderara, S. (2018).
Multi-views embedding for cattle re-identification. In
2018 14th international conference on signal-image
technology & internet-based systems (SITIS), pages
184–191. IEEE.
Borlinghaus, P., Tausch, F., and Rettenberger, L. (2023). A
purely visual re-id approach for bumblebees (bombus
terrestris). Smart Agricultural Technology, 3:100135.
Bozek, K., Hebert, L., Portugal, Y., Mikheyev, A. S., and
Stephens, G. J. (2021). Markerless tracking of an
entire honey bee colony. Nature communications,
12(1):1733.
Cakmak, I., Sanderson, C., Blocker, T. D., Lisa Pham, L.,
Checotah, S., Norman, A. A., Harader-Pate, B. K.,
Tyler Reidenbaugh, R., Nenchev, P., Barthell, J. F.,
and Wells, H. (2009). Different solutions by bees to
a foraging problem. Animal Behaviour, 77(5):1273–
1280.
Chan, J., Carri
´
on, H., M
´
egret, R., Agosto-Rivera, J. L., and
Giray, T. (2022). Honeybee re-identification in video:
New datasets and impact of self-supervision. In Pro-
ceedings of the 17th International Joint Conference
on Computer Vision, Imaging and Computer Graphics
Theory and Applications (VISIGRAPP 2022), volume
5: VISAPP, pages 517–525.
Chappidi, J. and Sundaram, D. M. (2024). Enhanced ani-
mal detection in complex outdoor environments using
modified yolo v7.
Colin, T., Warren, R. J., Quarrell, S. R., Allen, G. R., and
Barron, A. B. (2022). Evaluating the foraging perfor-
mance of individual honey bees in different environ-
ments with automated field rfid systems. Ecosphere,
13(5).
Crall, J. D., Gravish, N., Mountcastle, A. M., and Combes,
S. A. (2015). Beetag: a low-cost, image-based track-
ing system for the study of animal behavior and loco-
motion. PloS one, 10(9):e0136487.
Gal, A., Saragosti, J., and Kronauer, D. J. (2020). anTraX, a
software package for high-throughput video tracking
of color-tagged insects. eLife, 9.
Giray, T., Abramson, C. I., Chicas-Mosier, A., Brewster,
T., Hayes, C., Rivera-Vega, K., Williams, M., and
Wells, H. (2015). Effect of octopamine manipulation
on honeybee decision making: reward and cost dif-
ferences associated with foraging. Animal Behaviour,
100:144–150.
Hung, K.-L. J., Kingston, J. M., Albrecht, M., Holway,
D. A., and Kohn, J. R. (2018). The worldwide im-
portance of honey bees as pollinators in natural habi-
tats. Proceedings of the Royal Society B: Biological
Sciences, 285(1870):20172140.
Jocher, G., Chaurasia, A., and Qiu, J. (2023). Ultralytics
YOLOv8.
Khalifa, S. A. M., Elshafiey, E. H., Shetaia, A. A., El-
Wahed, A. A. A., Algethami, A. F., Musharraf, S. G.,
AlAjmi, M. F., Zhao, C., Masry, S. H. D., Abdel-
Daim, M. M., Halabi, M. F., Kai, G., Al Naggar, Y.,
Bishr, M., Diab, M. A. M., and El-Seedi, H. R. (2021).
Overview of bee pollination and its economic value
for crop production. Insects, 12(8).
Li, S., Li, J., Tang, H., Qian, R., and Lin, W. (2019). ATRW:
a benchmark for amur tiger re-identification in the
wild. arXiv preprint arXiv:1906.05586.
Meyers, L., Cordero, J. R., Bravo, C. C., Noel, F., Agosto-
Rivera, J., Giray, T., and M
´
egret, R. (2023). To-
wards Automatic Honey Bee Flower-Patch Assays
with Paint Marking Re-Identification. Workshop
CV4Animals, in conjunction CVPR 2023, Vancouver,
Canada. arXiv:2311.07407.
Noel, F., Giray, T., Agosto, J. L., Perez, E., Norze, W.,
Padilla, A., Seide, C., and Leconte, Y. (2018). Role
of dopamine on honeybee foraging decisions. In En-
tomology 2018. ESA.
Papafitsoros, K., Adam, L.,
ˇ
Cerm
´
ak, V., and Picek, L.
(2022). Seaturtleid: A novel long-span dataset high-
lighting the importance of timestamps in wildlife re-
identification. arXiv preprint arXiv:2211.10307.
Rodriguez, I. F., Chan, J., Alvarez Rios, M., Branson,
K., Agosto-Rivera, J. L., Giray, T., and M
´
egret, R.
(2022). Automated video monitoring of unmarked and
marked honey bees at the hive entrance. Frontiers in
Computer Science, 3:142.
Rodr
´
ıguez-Cordero, J. A., Santiago-Plaza, G. A., Mey-
ers, L., Noel, F., Figueroa-Santiago, E. J., M
´
egret,
R., Bravo, C. C., Agosto-Rivera, J. L., and Giray, T.
(2024). A real-time edge computing system for mon-
itoring bees at flowers. In Kadoch, M., Lu, K., Ye,
F., and Qian, Y., editors, Proceedings of the Interna-
tional Symposium on Intelligent Computing and Net-
working 2024, pages 365–375, Cham. Springer Na-
ture Switzerland.
Paint Blob Detection and Decoding for Identification of Honey Bees
249

Romero-Ferrero, F., Bergomi, M. G., Hinz, R. C., Heras,
F. J. H., and Polavieja, G. G. d. (2019). idtracker.ai:
tracking all individuals in small or large collectives of
unmarked animals. Nature Methods, 16(2):179.
Santiago-Plaza, G., Meyers, L., Gomez-Jaime, A.,
Mel
´
endez-R
´
ıos, R., Noel, F., Agosto, J., Giray, T.,
Rodr
´
ıguez-Cordero, J., and M
´
egret, R. (2024). Iden-
tification of honeybees with paint codes using convo-
lutional neural networks. In Proceedings of the 19th
International Joint Conference on Computer Vision,
Imaging and Computer Graphics Theory and Applica-
tions - Volume 2: VISAPP, pages 772–779. INSTICC,
SciTePress.
Schneider, S., Taylor, G. W., and Kremer, S. (2018). Deep
learning object detection methods for ecological cam-
era trap data. Canadiense Conference On Computer
And Robot Vision.
Sekachev, B., Manovich, N., Zhiltsov, M., Zhavoronkov,
A., Kalinin, D., Hoff, B., TOsmanov, Kruchinin,
D., Zankevich, A., DmitriySidnev, Markelov, M., Jo-
hannes, Chenuet, M., A-Andre, Telenachos, Mel-
nikov, A., Kim, J., Ilouz, L., Glazov, N., Priya,
Tehrani, R., Jeong, S., Skubriev, V., Yonekura, S.,
Truong, V., Zliang, Lizhming, and Truong, T. (2020).
Opencv/cvat: V1.1.0. Zenodo.
Smith, M. T., Livingstone, M., and Comont, R. (2021). A
method for low-cost, low-impact insect tracking using
retroreflective tags. Methods In Ecology And Evolu-
tion, 12(11):2184–2195.
Streit, S., Bock, F., Pirk, C. W., and Tautz, J. (2003). Au-
tomatic life-long monitoring of individual insect be-
haviour now possible. Zoology, 106(3):169–171.
Wario, F., Wild, B., Couvillon, M. J., Rojas, R., and Land-
graf, T. (2015). Automatic methods for long-term
tracking and the detection and decoding of commu-
nication dances in honeybees. Frontiers In Ecology
And Evolution, 3.
VISAPP 2025 - 20th International Conference on Computer Vision Theory and Applications
250
