
A Computer Vision Approach to Counting Farmed Fish
in Flowing Water
Masanori Nishiguchi
1
, Hitoshi Habe
2,3 a
, Koji Abe
2,3
, Masayuki Otani
2,3
and Nobukazu Iguchi
2,3
1
Graduate School of Science and Engineering, Kindai University, Higashiosaka, Osaka, Japan
2
Faculty of Informatics, Kindai University, Higashiosaka, Osaka, Japan
3
Cyber Informatics Research Institute, Kindai University, Higashiosaka, Osaka, Japan
Masanori.Nishiguchi@kindai.ac.jp, {habe, koji, otani, iguchi}@info.kindai.ac.jp
Keywords:
Object Detection, Object Tracking, Counting, Aquaculture.
Abstract:
Aquaculture is an expanding industry that depends on accurate fish counting for effective production man-
agement, including growth monitoring and feed optimization. Manual counting is time-consuming and labor-
intensive, while commercial counting devices face challenges such as high costs and space constraints. In
ecology, tracking animal movement trajectories is essential, but using devices on small organisms is imprac-
tical, prompting the adoption of video and machine learning techniques. In contrast to traditional biological
studies that often rely on offline analysis, real-time fish counting is vital in aquaculture. This study introduces
a fish count method based on a Multiple Object Tracking (MOT) algorithm explicitly tailored for aquaculture.
The method prioritizes counting accuracy over precise movement tracking, optimizing existing techniques.
The proposed approach provides a viable solution to count fish in aquaculture and potentially other fields.
1 INTRODUCTION
Aquaculture is a rapidly growing industry where ac-
curate fish counts are crucial for managing growth,
feed, and production(FAO, 2024). Manual counting
is impractical, and while ICT-based systems(of Japan,
2022) automate tasks like feeding and measuring,
commercial counting devices face challenges such as
high costs and space requirements.
In ecological research, tracking organism move-
ment provides insights into behavior and group dy-
namics(A. I. Dell and Brose, 2014). However, using
GPS or sensors for small organisms is often imprac-
tical. Instead, video-based methods using machine
learning have become common(Mathis et al., 2018;
Pereira et al., 2022), enabling tracking via object de-
tection and association in video frames, a process cen-
tral to Multiple Object Tracking (MOT).
Conventional MOT systems for biology focus on
offline analysis, prioritizing accuracy over speed. In
aquaculture, real-time counting is essential for tasks
like transferring or shipping fish. This study pro-
poses a fish-counting method using MOT, designed
for aquaculture. Unlike traditional MOT, it empha-
sizes accurate counting rather than precise movement
a
https://orcid.org/0000-0002-7895-2402
trajectories.
The method involves detecting fish in each frame
and associating them across frames to avoid dou-
ble counting, even with standard cameras operating
at 60 fps. Experiments conducted at aquaculture
sites demonstrated the method’s accuracy across vari-
ous conditions, outperforming conventional MOT and
detection-only approaches.
This method offers a practical solution for aqua-
culture and similar scenarios requiring real-time, ac-
curate counts of individual organisms.
2 RELATED WORK
2.1 Object Detection
Object detection methods are categorized as one-stage
and two-stage approaches. One-stage methods, like
YOLO (Redmon et al., 2016), directly estimate object
locations and classifications, making them ideal for
real-time applications. In contrast, two-stage meth-
ods, such as Faster R-CNN (Ren et al., 2015), first
identify candidate regions and then classify them, of-
fering higher accuracy at the cost of slower perfor-
mance. Recent advancements include methods like
Nishiguchi, M., Habe, H., Abe, K., Otani, M. and Iguchi, N.
A Computer Vision Approach to Counting Farmed Fish in Flowing Water.
DOI: 10.5220/0013388800003912
Paper published under CC license (CC BY-NC-ND 4.0)
In Proceedings of the 20th International Joint Conference on Computer Vision, Imaging and Computer Graphics Theory and Applications (VISIGRAPP 2025) - Volume 2: VISAPP, pages
781-789
ISBN: 978-989-758-728-3; ISSN: 2184-4321
Proceedings Copyright © 2025 by SCITEPRESS – Science and Technology Publications, Lda.
781

DETR (Carion et al., 2020), leveraging large language
models.
This study adopts a one-stage approach using
YOLOv8, chosen for its effectiveness in detecting
small objects like juvenile fish, ensuring suitability
for real-time applications.
2.2 Object Tracking
There are several approaches to object tracking. One
standard method is tracking by detection, which as-
sociates detected objects by using algorithms such
as the Hungarian Algorithm to link detection results
and track objects. Examples of this approach include
SORT (Bewley et al., 2016), ByteTrack (Zhang et al.,
2022), and OC-SORT (Cao et al., 2023).
2.3 Fish Tracking and Counting
Recent advances in computer vision have enabled sig-
nificant progress in fish tracking. Wang et al. (Wang
et al., 2019) used TLD and ASMS for high-accuracy
tracking based on fish color and shape. Tools like id-
Tracker (P
´
erez-Escudero et al., 2014) and idTracker.ai
(Romero-Ferrero et al., 2019) reduce ID switches
caused by occlusions or group interactions.
For counting, computer vision methods bal-
ance cost and efficiency. Systems like LDNet
(Li et al., 2024) handle high-density environments,
and segmentation-based approaches (Lilibeth Coro-
nel and Namoco, 1970) measure from single images,
though they struggle with noise. Video-based ap-
proaches, such as Mask R-CNN (Tseng and Kuo,
2020), offer better accuracy and efficiency but often
focus on tanks or static environments. Few methods
address fast-moving fish in waterways.
3 PROPOSED METHOD
3.1 Problem Definition and Overview of
Proposed Method
Although fish can be counted through detection alone,
there are several issues. In the footage used in this
study, the fish exhibit fast and complex movements,
leading to false and missed detections. Additionally,
because the fish are being carried by water, the sys-
tem is affected by noise from the water itself. Unlike
pedestrians, whose appearance can be distinguished
by clothing, fish have slight variation in their external
features and generally look very similar. As a result, it
becomes challenging to differentiate fish that have al-
ready been counted, leading to double counting, mis-
detection of water as fish, or counting multiple fish
passing simultaneously as a single one. This can re-
sult in overcounting.
Narrowing the detection area can reduce over-
counting but increases the risk of missing fish. Thus,
setting the detection range appropriately is crucial.
Additionally, methods like SORT use IoU (Intersec-
tion Over Union), which measures the overlap be-
tween the predicted and detected bounding boxes, for
tracking. However, in the case of fast-moving objects,
the IoU can drop to zero, causing tracking failures and
reducing the accuracy of fish counting.
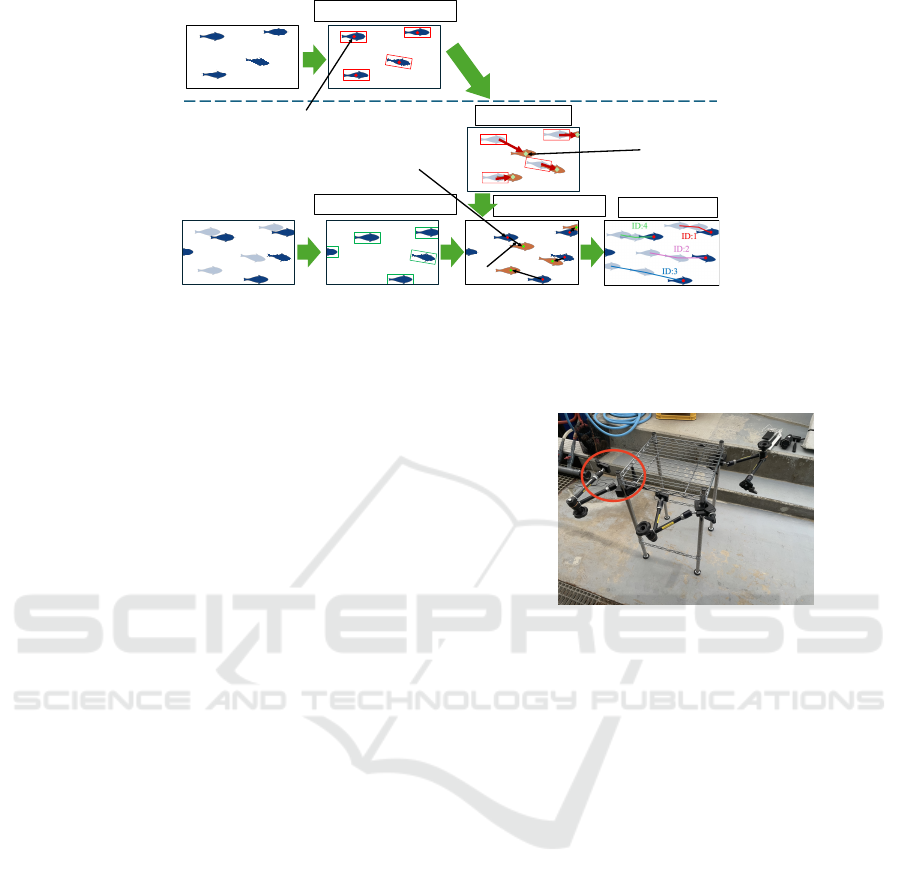
The proposed method to solve these issues is il-
lustrated in Figure 1. In this method, (a) similar to the
standard SORT, object detection is performed on each
frame using YOLO to detect the fish. Then, (b) the
Kalman filter is applied to the detected positions from
the previous time step to predict the current position.
Next, (c) the predicted position is associated with the
detected position at the current time step. Instead of
using IoU, the association is made simply based on
the shortest Euclidean distance. (d) The tracked ob-
jects are considered individual fish and are counted
accordingly. Each of these steps is explained in detail
below.
3.2 Detection
YOLOv8 is used for detection. YOLO is a one-stage
object detection model that can perform both classi-
fication and object detection simultaneously. Its ar-
chitecture is composed of a backbone, a neck, and
a head. Improvements in the new architecture and
convolutional layers enable advanced detection while
maintaining excellent real-time performance. The fish
targeted in this study are relatively small, with a body
length of 3 to 5 cm, making them appear small in the
footage. However, YOLOv8 is capable of detecting
even small objects effectively.
3.3 Prediction
The Kalman filter is used to predict the movement of
fish. It estimates the tracked object’s position, veloc-
ity, and acceleration over time, making it effective for
predicting states from noisy data. The Kalman filter
has also been widely used in recent tracking appli-
cations. Using the Kalman filter makes it easier to
predict the next position of the tracked object. Since
real-time prediction is essential for fish counting and
tracking, the Kalman filter was chosen for its real-
time capabilities and computational efficiency.
VISAPP 2025 - 20th International Conference on Computer Vision Theory and Applications
782
𝒕 = 𝑻
𝒕 = 𝑻 + 𝟏
(a) Object Detection
(b) Prediction
(c) Association
(d) Trajectory
(a) Object Detection
𝒙
!
"
"
𝒙
!
"#$
𝒙
%
"#$
𝑑
!%
Figure 1: Illustration of the proposed method. After inputting the video, (a) object detection is performed, followed by (b)
predicting the positions of the detected fish. (c) The predicted position is then associated with the detection result at the
subsequent frame by calculating the Euclidean distance between the center coordinates of the prediction and the detection
result, with the closest match being selected. (d) The fish are tracked, and IDs are assigned. The number of tracked objects,
identified by their IDs, is then counted.
3.4 Association
In the video used in this study, the distance the fish
move between frames is significant, making it unsuit-
able to use IoU-based association methods like SORT,
as it lowers the accuracy of fish counting. IoU-based
association is weak in handling occlusions, and track-
ing fast-moving objects often fails. As a result, ob-
jects assigned an ID in one frame may be assigned a
different ID in the next frame, leading to an inflated
count.
To address this, the association between fish is
made based on the Euclidean distance between the
center coordinates of the bounding boxes predicted by
the Kalman filter and the bounding boxes detected by
YOLO.
First, fish detection is performed at each time step
t, and the bounding boxes of the detected fish are ob-
tained, with the center of the bounding box considered
as the position x
t
i
of the fish, where i is the index rep-
resenting individual fish. Next, state estimation is per-
formed using the Kalman filter, which estimates and
updates the state over time. The position information
of the object in the next frame is predicted based on
past position information and the prediction model as
b
x
t+1
i
= F(x
t
i
). Then, the Euclidean distance between
each predicted position and the detection result in the
next frame d
i j
= ||
b
x
t+1
i
− x
t+1
j
||
2
is calculated, and if
the distance is smaller than a predetermined threshold
D
T
, the objects are considered to be associated. Al-
though this process is quite simple, as shown in later
experiments, it allows for sufficiently accurate associ-
ation even for fast-moving objects.
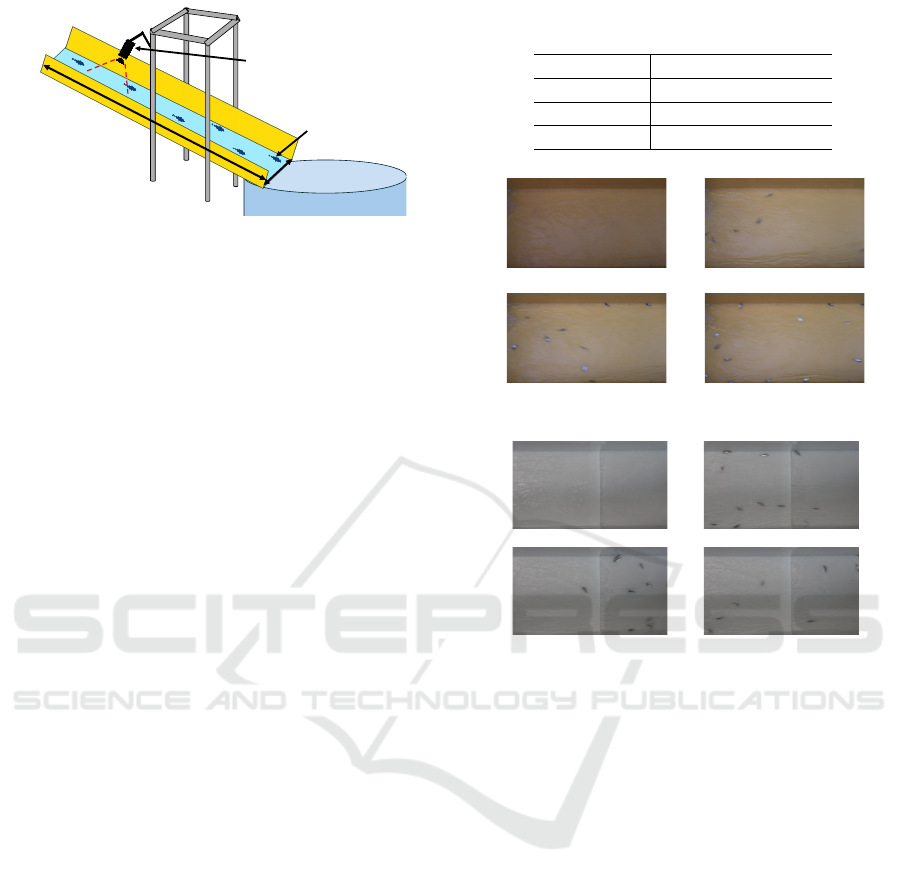
Figure 2: Equipment for Experiments.
3.5 Tracking
After the association step, tracklets are created, and
IDs are assigned to them. Then, the prediction for
each tracklet is matched with new detections to con-
tinue tracking. If an object fails to be tracked, it is
considered a tracking failure, and the Kalman filter
is used to predict the object’s position from the point
of failure. In the next frame (t+1), the association is
re-established if the new detection result is within the
threshold of the predicted position from the Kalman
filter. If a tracklet remains in a failed tracking state for
a certain number of frames, it is deleted. This method
aims to achieve real-time counting by improving com-
putational efficiency, making fast fish counting feasi-
ble.
4 EXPERIMENT
4.1 Datasets
For the experiment, a setup was constructed as shown
in Figure 2, with a camera mounted on the camera
arm at the location marked in red, and the shooting
A Computer Vision Approach to Counting Farmed Fish in Flowing Water
783
Fish tank
SONY FDR AX-60
35cm
193cm
Fish
Figure 3: Filming Condition.
environment was arranged as shown in Figure 3. The
camera was positioned perpendicular to the waterway
to ensure that the size of the fish remained consis-
tent throughout the footage. The fish were released
into the water and recorded the fish being directed to
a different tank through a waterway. The video was
recorded using a SONY FDR-AX60 camera, and the
shooting conditions are listed in Table 1. The target
fish had body lengths of 3 to 5 cm. The recording
took place at the Oshima Hatchery, Kindai University
Aquaculture Technology and Production Center.
To evaluate the method under various conditions,
we used the following three datasets:
4.1.1 Dataset 1: YOLO Training Dataset
To train the YOLO object detection model, images
were randomly extracted from videos of fish flow-
ing through a waterway recorded at different times
of the day. 488 images containing fish were se-
lected and randomly divided into training and vali-
dation datasets. Manual annotation provided ground-
truth data for training.
4.1.2 Dataset 2: Dataset for Fish Counting
Evaluation
The first dataset for fish counting experiments was
recorded in the same waterway environment with a
uniform yellow background, as used for YOLO train-
ing. A total of 27 videos were prepared to count the
number of fish passing through the waterway. This
environment is well-suited for evaluating the perfor-
mance of the detection model and the essential accu-
racy of the MOT-based counting method.
Among these videos, 18 were recorded at differ-
ent times on the same day, while the remaining nine
were recorded on separate days, introducing subtle
environmental changes. This dataset is referred to as
Dataset 2. Videos recorded on the same day are la-
beled with letters (e.g., 2-A, 2-B, 2-C), while videos
recorded on different days are labeled with numbers
(e.g., 2-1, 2-2, 2-3). Sample images of Dataset 2 are
shown in Figure 4.
Table 1: Specifications of the Camera and Video Used for
Experiments.
Camera SONY FDR AX-60
Resolution 1920×1080 pixel
Frame Rate 60fps
Bit Rate 50Mbs
Figure 4: Sample Frames of Video Used in Dataset 2.
Figure 5: Sample Frames of Video Used in Dataset 3.
4.1.3 Dataset 3: Dataset for Fish Counting
Evaluation with Different Backgrounds
A separate set of four videos with a white background
was prepared to evaluate the impact of background
color as Dataset 3. This dataset was used to assess
the performance of the proposed method under differ-
ent conditions. Although the videos were recorded on
dates different from those in Dataset 2, the waterway
conditions were similar. Sample images of Dataset 3
are shown in Figure 5.
Using these datasets, we conducted three major
experiments. The results are presented below.
4.2 Experiment 1: Fish Detection
In Experiment 1, since the proposed method follows
the tracking by detection paradigm of MOT, poor
detection accuracy by YOLO can significantly im-
pact the accuracy of fish counting. By verifying the
accuracy of YOLOv8, we aim to confirm whether
YOLOv8 can detect fish accurately.
To build a model for detecting fish using
YOLOv8, we used Dataset 1, which were recorded
VISAPP 2025 - 20th International Conference on Computer Vision Theory and Applications
784
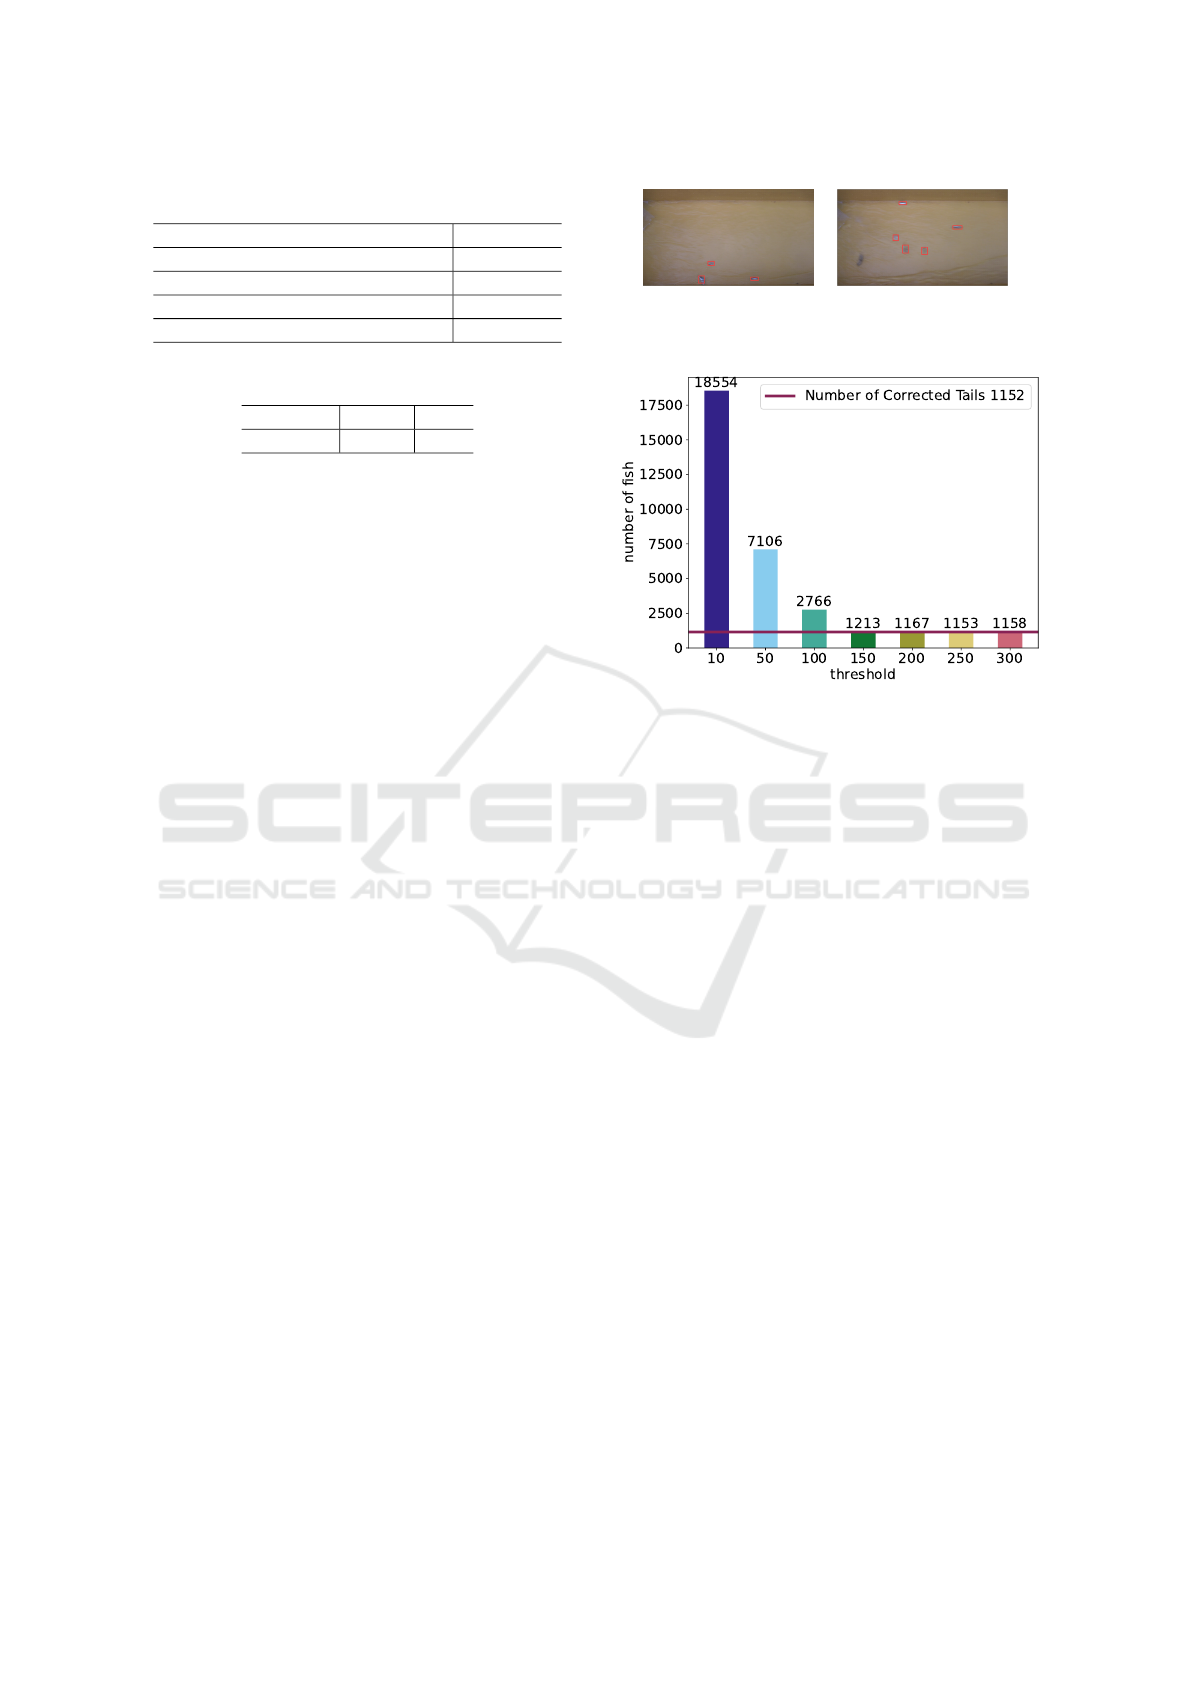
Table 2: YOLOv8 Training Parameters.
Epochs 50
Number of Images for Training 390
Number of Images for Verification 98
Batch Size 16
Network YOLOv8n
Table 3: Object Detection Results of YOLOv8.
Precision Recall AP
95.4 93.8 95.6
under the same conditions as the fish-counting
footage Dataset 2 but from a different time. 390 im-
ages were prepared for training and 98 images for val-
idation. The training conditions are outlined in Table
2.
The results of detection using YOLO are shown
in Table 3. The evaluation metrics used were Preci-
sion, Recall, and AP. Precision represents the propor-
tion of objects predicted as fish that were recognized
as fish. Recall represents the proportion of actual fish
that were correctly detected as fish. AP (Average Pre-
cision) is the average precision across various param-
eters, indicating the overall detection performance.
All three evaluation metrics exceeded 93%, indi-
cating that YOLOv8 can detect small fish with high
accuracy. However, there were some issues, such as
false detections of water, missed detections, or fail-
ing to distinguish between two fish and detecting one
fish as two. Additionally, in cases where fish were oc-
cluded, the system sometimes detected more fish than
were present. Figure 6 shows examples of missed and
false detections. However, we believe these issues
can be improved by adding temporal information, in-
creasing the number of training data, and extending
the training iterations.
4.3 Experiment 2: Fish Counting
In Experiment 2, we examined whether accurate fish
counting could be achieved. The ground truth for the
number of fish was obtained by manually counting the
fish in the footage, and the results were compared.
In the proposed method, it is necessary to set the
distance threshold D
T
. First, we evaluate the re-
sults under various threshold values. Then, we assess
the method’s performance using the prepared diverse
datasets to evaluate its robustness and generalizabil-
ity.
(a) (b)
Figure 6: Examples of Incorrect Detections.
Figure 7: Results of Varying the Distance Threshold for
Dataset 2-A.
4.3.1 Evaluation of Impact of Euclidean
Distance Threshold on Association
Figure 7 shows the impact of varying the distance
threshold D
T
for Dataset 2. If this threshold is set too
low, the number of failed associations will increase,
leading to a higher count. Conversely, if the threshold
is too high, objects that should not be associated may
be linked, resulting in a lower count.
The results show that when the threshold D
T
is
small, the estimated fish count is significantly higher,
which aligns with the abovementioned discussion.
However, once the threshold exceeds 150, the count
stabilizes near the correct value, indicating that in-
creasing the threshold does not lead to many unnec-
essary associations. In other words, this threshold is
not highly sensitive, and setting it above a particular
value ensures accurate results.
The estimated result of the proposed method was
1,153 fish, with a difference of only one fish com-
pared to the ground truth of 1,152. While there were
instances of missed detections, tracking failures, and
double counting, these errors offset each other, result-
ing in a value close to the actual count. This demon-
strates that the proposed method is effective for fish
counting and serves its purpose well.
Figure 8 shows the results of the same experi-
ment conducted on Dataset 3-1, respectively. The re-
sult reveals a similar trend, with values very close to
the ground truths of 1262. Notably, for Dataset 3-1,
A Computer Vision Approach to Counting Farmed Fish in Flowing Water
785
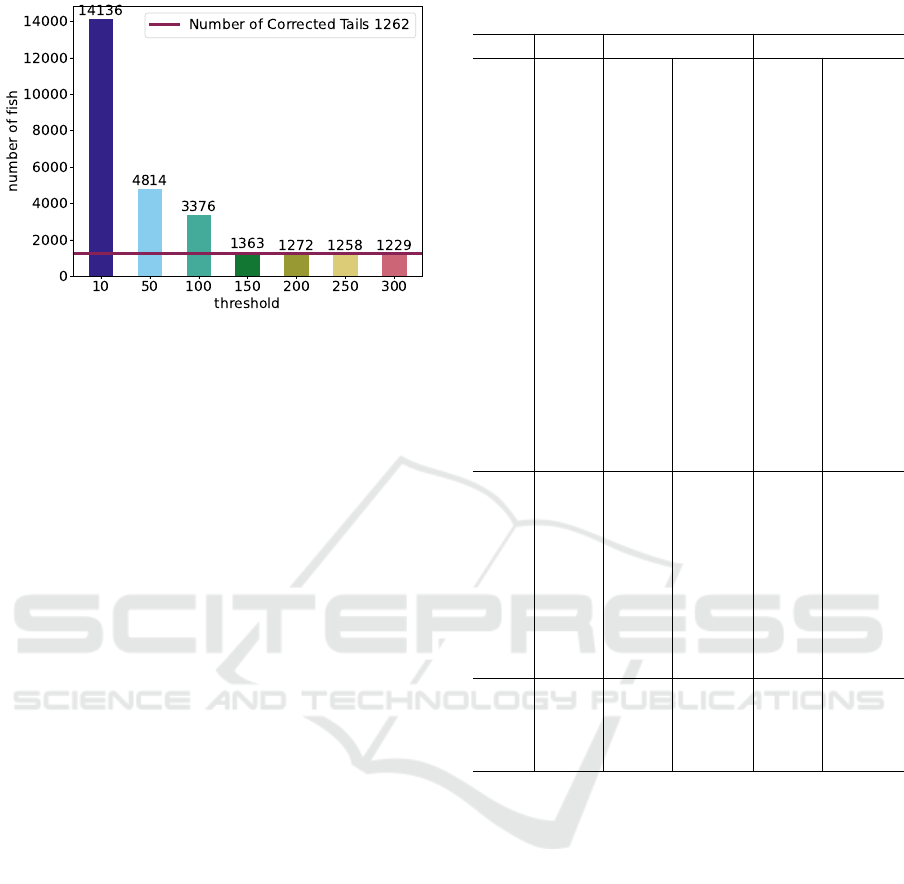
Figure 8: Results of Varying the Distance Threshold for
Dataset 3-1.
which features a background color different from the
images used for YOLO training, good results were
achieved without being affected by the background
color.
4.3.2 Evaluation of Fish Counting Under
Various Conditions
From the results in the previous section, it was found
that setting the distance threshold D
T
greater than 150
generally produces favorable results. Therefore, we
evaluated fish counting on all prepared datasets using
D
T
values of 150 and 250, where stable results were
observed.
Table 4 presents the experimental results. GT
refers to the counting results obtained through man-
ual annotation, and the fish counts obtained using the
two different D
T
values are also shown.
For Dataset 2-A to 2-R, most videos showed a ten-
dency for the fish count to exceed the ground truth
by 5–10% when D
T
= 150, whereas the error was
around 3% when D
T
= 250. This is because, at
D
T
= 150, there were some instances where fish with
large movements were not correctly associated. In
contrast, at D
T
= 250, the associations were more
successful, reducing the likelihood of overcounting.
In 2-G, which had the highest number of fish
(9,441), the count with D
T
= 150 was 9,857, approx-
imately 4.4% higher than the ground truth. However,
with D
T
= 250, the count improved to 9,315, reduc-
ing the difference to about 1.4%. This indicates that
accurate counting can still be achieved even in high-
density conditions with a large number of fish.
For Dataset 2-1 to 2-9, both D
T
= 150 and D
T
=
250 showed a tendency for the counting results to ex-
ceed the ground truth. However, with D
T
= 250, the
error remained within the acceptable range at around
10%. One observed cause of this overcounting is that
Table 4: Counting Results Across All Datasets.
Data GT D
t
= 150 D
t
= 250
2-A 1,152 1,213 +5% 1,153 +0.1%
2-B 934 980 +4.9% 945 +1.2%
2-C 836 880 +5.3% 843 +0.8%
2-D 4,616 4,927 +6.7% 4,627 +0.2%
2-E 5,066 5,242 +3.5% 4,992 −1.5%
2-F 516 546 +5.9% 514 −0.4%
2-G 9,441 9,857 +4.4% 9,315 −1.4%
2-H 594 652 +9.8% 604 +1.7%
2-I 308 338 +9.7% 320 +3.9%
2-J 562 600 +6.8% 570 +1.4%
2-K 1,084 1,166 +7.6% 1,101 +1.6%
2-L 1,006 1,079 +7.2% 1,018 +1.2%
2-M 208 240 +15% 223 +7.2%
2-N 682 723 +6.0% 695 +1.9%
2-O 365 381 +4.4% 376 +3.0%
2-P
667 711 +6.6% 678 +1.7%
2-Q 717 790 +10% 728 +1.5%
2-R 3,469 3,799 +9.5% 3,374 −2.8%
2-1 576 653 +13% 608 +5.6%
2-2 283 303 +7.1% 295 +4.2%
2-3 237 274 +16% 258 +8.9%
2-4 73 83 +13% 77 +5.5%
2-5 260 271 +4.2% 272 +4.6%
2-6 120 133 +10% 128 +6.7%
2-7 115 128 +11% 121 +5.2%
2-8 801 872 +8.9% 836 +4.4%
2-9 3,936 4,272 +8.5% 4,009 +1.9%
3-1 1,262 1,357 +7.5% 1,261 −0.1%
3-2 1,345 1,438 +6.9% 1,362 +1.3%
3-3 1,680 1,875 +11% 1,675 −0.3%
3-4 1,567 1,760 +12% 1,558 −0.6%
fish passing along the edges of the waterway can re-
flect off the walls, leading to multiple counts. This
issue could potentially be addressed by revising the
recording conditions.
Dataset 3 involved significantly different condi-
tions, yet the error trends were similar to those ob-
served in Dataset 2-A to 2-R. This indicates that the
proposed method can perform stable fish counting
even when the environment changes.
4.4 Detailed Evaluation
Additional experiments were conducted to verify the
effectiveness of the proposed method. All subsequent
experiments were conducted using Dataset 2-1. And,
the threshold D
T
was set to 250.
VISAPP 2025 - 20th International Conference on Computer Vision Theory and Applications
786
Table 5: Comparison with Counting Using Detection Re-
sults Alone.
Method Number of Fish
YOLOv8 alone 45,845
Proposed Method 1,153
Table 6: Comparison of Conventional MOT Methods.
Detector Tracking Number of Fish
YOLOv8 SORT 1,883
OC-SORT 1,726
ByteTrack 2,268
Ours 1,153
Ground Truth 1,152
4.4.1 Comparison with Counting Using
Detection Only
The results obtained using only YOLOv8 for de-
tection and counting are presented in Table 5. In
other words, this approach does not perform tempo-
ral tracking but rather sums the number of detections
in individual frames, and these results are compared.
As shown in Table 3, fish in a single image can
be detected with sufficient accuracy. However, when
counting detections from consecutive frames as sepa-
rate individuals, the count increases significantly. To
prevent this, narrowing the detection range is undesir-
able, as it increases the risk of missed detections.
4.4.2 Comparison with Tracking Methods
Typically Used in MOT
The proposed method was compared with traditional
tracking methods used in existing MOT techniques.
All detectors were based on the YOLOv8 model used
in Experiments 1 and 2. The results are shown in Ta-
ble 6.
The results show that the proposed method
achieved a lower fish counting error rate than IoU-
based association methods. First, in the case of SORT,
it assumes that the movement between frames is slight
and uses IoU for tracking. As a result, it often fails
to re-identify objects once they are lost, considering
them as separate individuals, which likely led to the
observed results.
Next, OC-SORT consists of three components.
ORU reduces error accumulation during occlusion,
OCM enhances directional consistency for nonlinear
movements, and OCR recovers lost tracks after short-
term occlusions. These features contributed to lower
errors compared to SORT. However, using IoU-based
association for fast-moving objects increases the dif-
ficulty.
Table 7: Verification of the Kalman Filter’s Effect.
Prediction Number of Fish
Kalman Filter 1,153
without Kalman Filter 1,731
Lastly, ByteTrack utilizes low-confidence detec-
tion results, which can lead to errors when track-
ing fast-moving objects, as motion blur often oc-
curs. Additionally, since it associates detection re-
sults with high-confidence detection, discrepancies
between predictions and detection results can cause
misassociations or unmatched tracks.
4.4.3 Verification of Effectiveness of Kalman
Filter
To verify the effectiveness of the Kalman filter’s pre-
dictions, we compared two approaches: one where no
motion prediction was performed between frames and
the detection results from frame t and frame t +1 were
directly used for the association, and another where
the Kalman filter was applied. The results are shown
in Table 7.
The Kalman filter makes it easier to associate ob-
jects by filtering based on past position and velocity
information, making it less susceptible to noise and
allowing for movement-aware predictions. Without
the Kalman filter, the association of detection results
between frames becomes more prone to errors due to
sudden object movements or the influence of noise,
such as water. This can lead to tracking failures and
frequent ID switches, which is likely the cause of the
increase in the fish count.
4.4.4 Evaluation of Impact of Frame Rate
Finally, we evaluate the fish count results when vary-
ing the frame rate. The higher the frame rate, the
smaller the fish movement between frames, making
tracking easier and improving the accuracy of fish
counting. From an accuracy perspective, a higher
frame rate is preferable. Still, as mentioned in Section
1, there are situations where real-time processing is
required, and higher frame rates make real-time pro-
cessing more difficult. Therefore, we evaluated with
a lower frame rate. We generated 30, 15, and 12 fps
footage from the 60fps footage. The same method
is applied to the generated footage. The results are
shown in Table 8.
When D
T
= 150, reducing the frame rate to 30fps
caused the fish count to increase compared to the
ground truth of 1152. However, at 15fps, the count
decreased, and it dropped further at 12fps. This is
because, at 30fps, the increased fish movement be-
tween frames leads to association failures, resulting in
A Computer Vision Approach to Counting Farmed Fish in Flowing Water
787

Table 8: Counting Results with Different Frame Rates.
Frame Rate D
t
= 150 D
t
= 250 D
t
= 300
60 fps 1,213 1,153 1,158
30 fps 1,618 1,190 1,178
15 fps 1,270 721 834
12 fps 995 650 487
an overestimation of the count. At lower frame rates,
fewer fish are captured in the images, as the frame rate
becomes too low to record their presence effectively.
A similar trend was observed for D
T
= 250 and
D
T
= 300. At 60fps, all three threshold values pro-
vided satisfactory results. However, at 30fps, it was
found that DT must be set to 250 or 300 to achieve
reliable results. The conditions for D
T
= 150 at 60fps
and D
T
= 300 at 30fps can be considered nearly
equivalent, and indeed, the fish counting results were
almost identical under these settings.
As stated in Section 1, real-time processing is re-
quired in aquaculture settings, making lower frame
rates more desirable. In such cases, it is necessary
to consider the movement speed of the fish and set an
appropriate D
T
value.
5 SUMMARY
In this paper, we proposed a method for counting fast-
swimming fish to apply in aquaculture settings. Since
real-time counting is considered, we employed sim-
ple techniques, but the method has achieved sufficient
accuracy. Future challenges include conducting de-
tailed evaluations in different environments and with
various fish species and developing a real-time sys-
tem.
ACKNOWLEDGEMENTS
We would like to thank the staff of the Oshima Hatch-
ery at the Kindai University Aquaculture Technology
and Production Center for their helpful support. And,
this work was supported by MEXT KAKENHI Grant
Numbers JP21H05302 and JP23K11158.
REFERENCES
A. I. Dell, J. A. Bender, K. B. I. D. C. G. G. d. P. L. P.
J. J. N. A. P.-E. P. P. A. D. S. M. W. and Brose, U.
(2014). Automated image-based tracking and its ap-
plication in ecology. Trends in Ecology & Evolution,
29(7):417–428.
Bewley, A., Ge, Z., Ott, L., Ramos, F., and Upcroft, B.
(2016). Simple online and realtime tracking. pages
3464–3468.
Cao, J., Pang, J., Weng, X., Khirodkar, R., and Kitani, K.
(2023). Observation-centric sort: Rethinking sort for
robust multi-object tracking. In Proceedings of the
IEEE/CVF Conference on Computer Vision and Pat-
tern Recognition, pages 9686–9696.
Carion, N., Massa, F., Synnaeve, G., Usunier, N., Kirillov,
A., and Zagoruyko, S. (2020). End-to-end object de-
tection with transformers. In Vedaldi, A., Bischof, H.,
Brox, T., and Frahm, J.-M., editors, Computer Vision –
ECCV 2020, volume 12346 of Lecture Notes in Com-
puter Science, pages 213–229. Springer, Cham.
FAO (2024). In Brief to The State of World Fisheries and
Aquaculture 2024: Blue Transformation in Action.
Li, X., Zhuang, Y., You, B., Wang, Z., Zhao, J., Gao,
Y., and Xiao, D. (2024). Ldnet: High accuracy
fish counting framework using limited training sam-
ples with density map generation network. Journal
of King Saud University - Computer and Information
Sciences, 36(7):102143.
Lilibeth Coronel, W. B. and Namoco, C. (1970). Identifica-
tion of an efficient filtering- segmentation technique
for automated counting. The International Arab Jour-
nal of Information Technology (IAJIT), 15(04):76 –
82.
Mathis, A., Mamidanna, P., Cury, K. M., Abe, T., Murthy,
V. N., Mathis, M. W., and Bethge, M. (2018).
Deeplabcut: markerless pose estimation of user-
defined body parts with deep learning. Nature Neu-
roscience, 21:1281–1289.
of Japan, F. A. (2022). Fisheries of japan—FY2022
(2021/2023).
Pereira, T. D., Tabris, N., Matsliah, A., Turner, D. M., Li, J.-
P., Ravindranath, S., Papadoyannis, E. S., Normand,
E., Deutsch, D. S., Wang, Z. Y., McKenzie-Smith,
G. C., Mitelut, C. C., Castro, L. A., D’Uva, J., Kislin,
M., Sanes, J. R., Kocher, S. D., Murthy, M., and Shae-
vitz, J. W. (2022). Sleap: A deep learning system for
multi-animal pose tracking. Nature Methods, 19:486–
495.
P
´
erez-Escudero, A., Vicente-Page, J., Hinz, R., Arganda,
S., and Polavieja, G. (2014). Idtracker: Tracking in-
dividuals in a group by automatic identification of un-
marked animals. Nature methods, 11.
Redmon, J., Divvala, S., Girshick, R., and Farhadi, A.
(2016). You only look once: Unified, real-time object
detection. In Proceedings of the IEEE Conference on
Computer Vision and Pattern Recognition (CVPR).
Ren, S., He, K., Girshick, R., and Sun, J. (2015). Faster
r-cnn: Towards real-time object detection with re-
gion proposal networks. In Cortes, C., Lawrence,
N., Lee, D., Sugiyama, M., and Garnett, R., editors,
Advances in Neural Information Processing Systems,
volume 28. Curran Associates, Inc.
Romero-Ferrero, F., Bergomi, M. G., Hinz, R. C., Heras,
F. J., and de Polavieja, G. G. (2019). idtracker.ai:
tracking all individuals in small or large collectives of
unmarked animals. Nature Methods, 16:179–182.
VISAPP 2025 - 20th International Conference on Computer Vision Theory and Applications
788

Tseng, C.-H. and Kuo, Y.-F. (2020). Detecting and count-
ing harvested fish and identifying fish types in elec-
tronic monitoring system videos using deep convolu-
tional neural networks. ICES Journal of Marine Sci-
ence, 77(4):1367–1378.
Wang, J., Zhao, M., Zou, L., Hu, Y., Cheng, X., and Liu,
X. (2019). Fish tracking based on improved tld algo-
rithm in real-world underwater environment. Marine
Technology Society Journal, 53(3):80–89.
Zhang, Y., Sun, P., Jiang, Y., Yu, D., Weng, F., Yuan,
Z., Luo, P., Liu, W., and Wang, X. (2022). Byte-
track: Multi-object tracking by associating every de-
tection box. In Avidan, S., Brostow, G., Ciss
´
e, M.,
Farinella, G. M., and Hassner, T., editors, Computer
Vision – ECCV 2022, pages 1–21, Cham. Springer Na-
ture Switzerland.
A Computer Vision Approach to Counting Farmed Fish in Flowing Water
789
