
Extracting and Modeling Tabular Data from Marine Geology
Publications into a Heterogeneous Information Network
Muhammad Asif Suryani
1 a
, Ewa Burwicz-Galerne
2 b
, Brigitte Mathiak
1 c
,
Klaus Wallmann
3 d
and Matthias Renz
4 e
1
GESIS - Leibniz-Institute for the Social Sciences, 50667 Cologne, Germany
2
MARUM - Center for Marine Environmental Sciences, University of Bremen, 28359 Bremen, Germany
3
GEOMAR Helmholtz Centre for Ocean Research Kiel, 24148 Kiel, Germany
4
Institute of Informatik, Christian-Albrechts-Universit
¨
at zu Kiel, 24118 Kiel, Germany
Keywords:
Information Extraction, Tabular Data, Research Data Management, Marine Science Publication,
Heterogeneous Information Network, Data Modeling.
Abstract:
Scientific publications serve as a source of disseminating information across research communities, often con-
taining diverse data elements such as plain-text, tables, and figures. Tables in particular offer a structured
presentation of essential research data, enabling efficient information access. Automatic extraction of tabular
data alongside contextual information from scientific publications can significantly enhance research work-
flows and integrate more research data into scholarly research cycle, particularly supporting Research Data
Management (RDM). In marine geology, the researchers conduct expeditions at oceanographic locations and
accumulate substantial amounts of valuable data such as Sedimentation Rate (SR), Mass Accumulation Rate
(MAR) alongside relevant contextual information, often enriched with spatio-temporal context in tables of
publications. These expeditions are costly and time intensive, emphasizing on the value of making such data
more accessible and reusable. This paper introduces an end to end approach to extract and model heteroge-
neous tabular data from marine geology publications. Our approach extracts metadata and tabular content
from publications, modeling them into a Heterogeneous Information Network (HIN). The network uncovers
hidden relationships and patterns across multiple documents, offering new insights and facilitating enhanced
data referencing. Experimental results and exploration on marine geology datasets demonstrate the effective-
ness of our approach, showcasing its potential to support research data management and data driven scientific
exploration.
1 INTRODUCTION
Scientific publications are valuable sources of infor-
mation that presents data in plain text, tables, and
figures. These publications are generally available in
Portable Document Format (PDF). These PDFs pro-
vide access to the relevant information in a stream-
lined reading experience. However, due to the rapid
increase in the number of publications, the manual
extraction of relevant information is becoming dif-
a
https://orcid.org/0000-0003-1669-5524
b
https://orcid.org/0000-0003-4551-5609
c
https://orcid.org/0000-0003-1793-9615
d
https://orcid.org/0000-0002-1795-376X
e
https://orcid.org/0000-0002-2024-7700
ficult and time-consuming. Moreover, the complex
internal structure of PDFs also makes information
extraction from plain text, tables, and figures even
more challenging. PDFs are primarily designed for
platform-independent viewing and printing (Petersen
et al., 2021).
To automatically extract the relevant information
from these data components of publications it is nec-
essary to have a broader information extraction cover-
age. As for the context elaboration, researcher utilize
plain-text and for graphical representation images are
presented. However, tables are generally showcased
as a set of organized information which researchers
want to emphasize in their research studies. For ex-
ample numerical information is generally organized
in tables and relatively easily accessible to users. But
Suryani, M. A., Burwicz-Galerne, E., Mathiak, B., Wallmann, K. and Renz, M.
Extracting and Modeling Tabular Data from Marine Geology Publications into a Heterogeneous Information Network.
DOI: 10.5220/0013389900003905
In Proceedings of the 14th International Conference on Pattern Recognition Applications and Methods (ICPRAM 2025), pages 453-460
ISBN: 978-989-758-730-6; ISSN: 2184-4313
Copyright © 2025 by Paper published under CC license (CC BY-NC-ND 4.0)
453
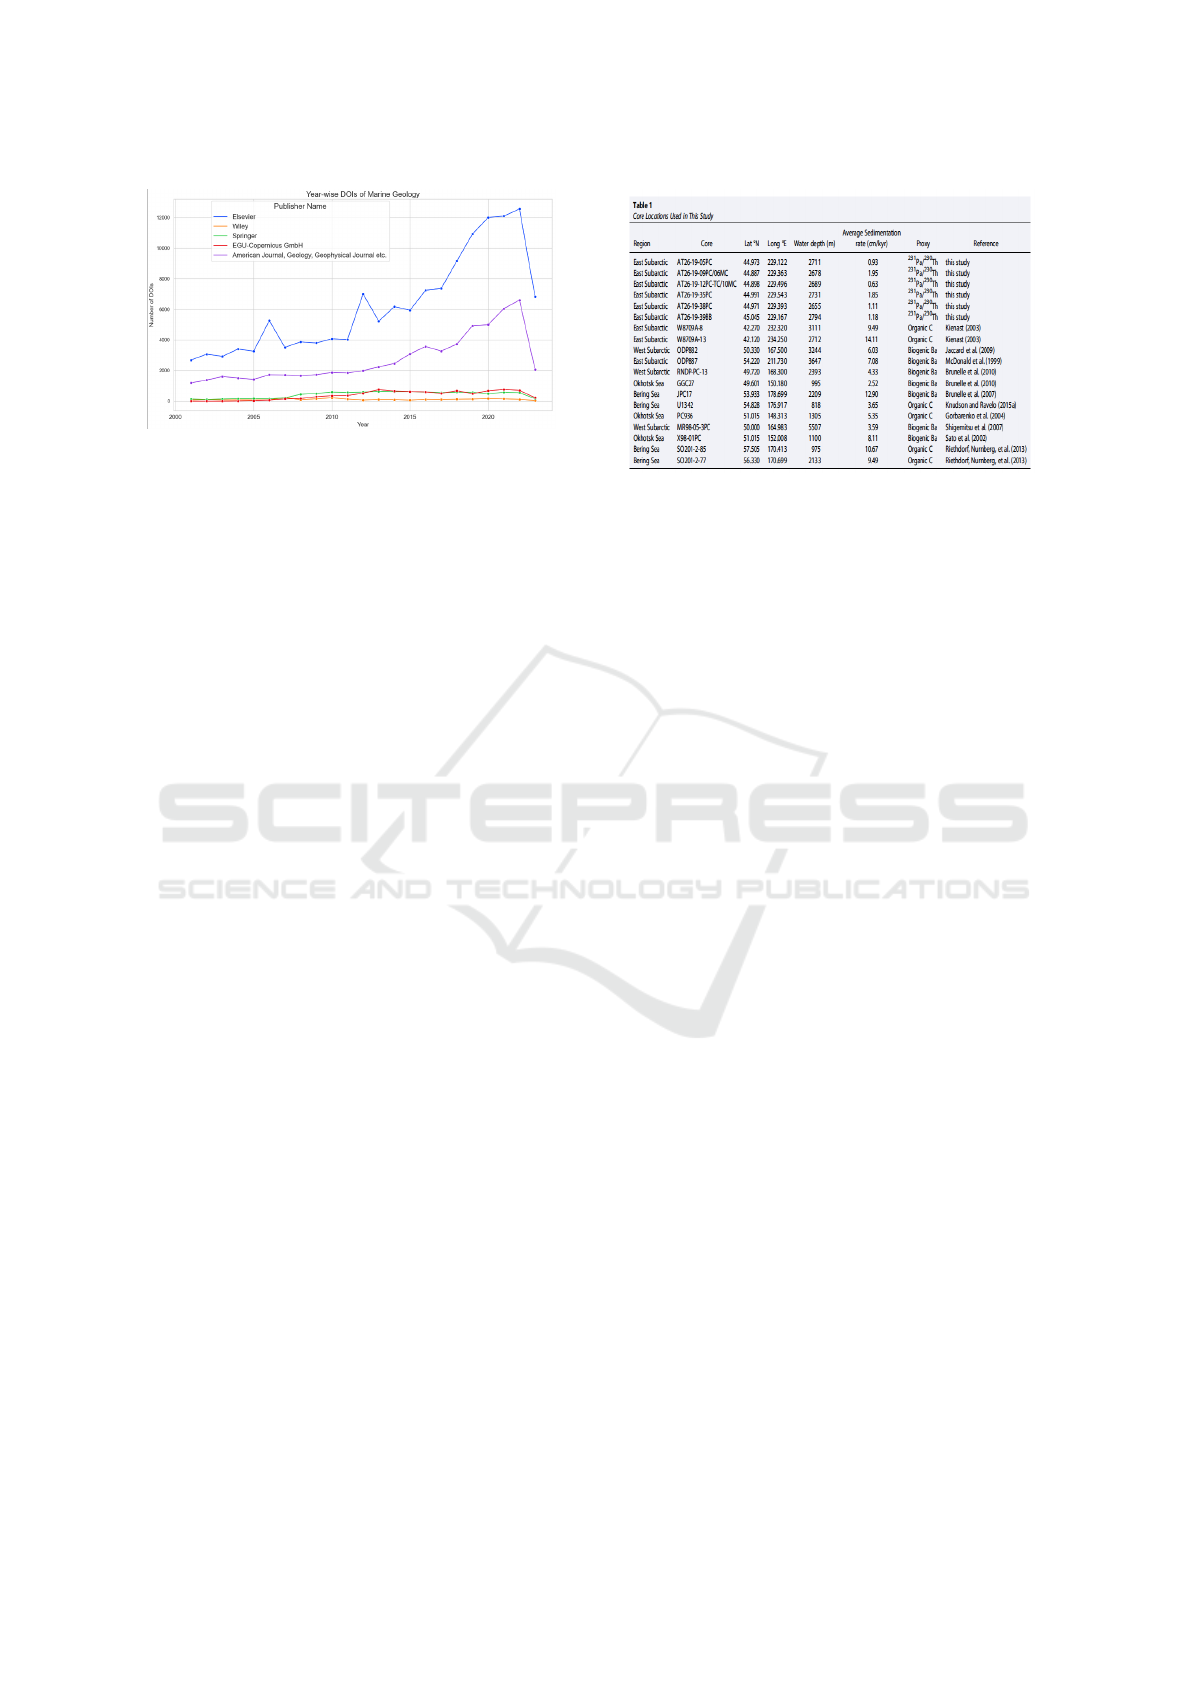
Figure 1: Publications by Years (Hendricks et al., 2020).
the access also depends on the granularity of the infor-
mation available in these tables (G
¨
opfert et al., 2022).
Moreover, a broader extraction approach is get-
ting indispensable which could support the extraction
of complex quantitative information from these tables
of publications to overcome manual procedures of in-
formation extraction. Besides, there are various fac-
tors which need to be considered in this regard, as ta-
bles are structured quite diversely regarding the num-
ber of (nested) rows and columns, table orientation
and depend on the template of publishers (Martinez-
Rodriguez et al., 2020),(Ceritli and Williams, 2021).
Marine Geologists perform extensive experiments
to record diverse scientific measurements at various
oceanographic locations. These experiments are quite
expensive in terms of efforts and cost. As researchers
have to spend weeks on expedition ships under chal-
lenging weather conditions to collect the samples to
study the marine environment. There have been var-
ious parameters which could be of interest of marine
geologists such as the Sedimentation Rate (SR) and
Mass Accumulation Rate (MAR) at the seafloor is an
excellent example (Chuang et al., 2019). Marine geol-
ogists have recorded these measurements for over one
hundred years and typically reported them in tables
of respective scientific publications. So, proper rep-
resentation of such quantitative information would be
tremendously helpful for both readers and also for the
automatic extraction process to carry out relevant ex-
traction conveniently. In order to further emphasis on
the importance and scale of this study the information
on the number of publications is presented in Figure 1
(Petersen et al., 2021; G
¨
opfert et al., 2022),(Martinez-
Rodriguez et al., 2020),(Ceritli and Williams, 2021),
(Hendricks et al., 2020).
To further emphasis on the tabular representations
of targeted measurements i.e. Sedimentation Rate
and Mass Accumulation Rate, it is essential to ex-
plain their relevant contextual information. In Fig-
ure 2 a sample table comprise of various columns
inciting contextual information. The most impor-
tant features are: Core which specifies the name
Figure 2: Sample Table taken from PDF (Costa et al., 2018).
of location where the experimentation has been per-
formed.Lat/Long columns provide the location infor-
mation about these measurements. Similarly Water
Depth provide the depth information. Average Sed-
imentation rate column represents the values being
measured at these specific locations. Lastly Proxy
showcases which method is being adopted to record
these measurements. Moreover, all the features are
elaborated in order of their contextual importance. It
is essential to note that the header representations for
these features vary widely across tables, and the tar-
geted measurements do not have proper representa-
tions in the International System of Units (SI), making
the extraction process even more challenging (Costa
et al., 2018).
Extracting relevant information from these table
instances can address a wide range of research ques-
tions including:
1. Where were these measurements taken, and what
are the identifiers for these locations?
2. What are the reported values and units of SR and
MAR?
3. Which authors reported these values?
4. What are the connections between studies based
on authors and locations?
5. What are the methods and depths associated with
these measurements?
However, an access to such information alongside
their respective contextual information would provide
marine geologists with broader insights and benefit
them by having convenient access to their desired in-
formation and could accelerate the knowledge discov-
ery process (Suryani et al., 2022). It is also worth
highlighting that these targeted measurements and
their corresponding spatial information have never
been compiled in any repository yet but were reported
primarily in publications. This paper discusses the
ICPRAM 2025 - 14th International Conference on Pattern Recognition Applications and Methods
454

framework that extracts tables from scientific publi-
cations parse these tables to extract quantitative in-
formation from marine geology publications to ex-
tract relevant information. Finally, the extracted in-
formation alongside respective metadata is being ex-
ploited to populate a Heterogeneous Information Net-
work comprising of metadata and measurements from
the respective publications.
2 RELATED WORK
Scientific publications play a crucial role in research
by presenting detailed information about experiments
and results. Thus access to such research data could
be beneficial for the communities to define future
research directions. However, research data in this
problem setting may provide specialized numerical
and spatial information, which facilitates the informa-
tion acquisition process about experiments or expedi-
tions. The primary function of Research Data Man-
agement (RDM) is to provide essential information
about conducted experiments, showcasing previously
relevant and interconnected data. This contributes to
advancing FAIR data principles and improving the
delivery of research data across communities (Ducat-
teeuw, 2021).
Marine Geologists mainly report scientific mea-
surements such as Mass Accumulation Rate (MAR)
and Sedimentation Rate (SR) in publications, repre-
sented in various data elements such as text and ta-
bles. These documents do not support a fully auto-
matic information extraction from these data elements
of publications. Contrarily, numerous studies previ-
ously focused on information extraction from these
data elements of publications but only to certain ex-
tent (Suryani et al., 2022).
Metadata extraction has evolved over time and
various approaches are available, the most promi-
nent being Grobid, which is used in numerous studies
(Lopez, 2009). Other metadata-related studies have
focused on collaboration networks, citation analysis
and publication trends (Moulin and Amaral, 2020;
Wahle et al., 2022).
Tabula is an open-source library that allows users
to extract tables from PDFs into CSVs (tab, 2022).
Camelot is another open-source Python library which
extracts tables from PDFs in CSVs. In addition,
camelot offers modularity and allows to make it
adaptable in any extraction pipeline (cam, 2022).
Recently, measurement extraction from tabular
data was carried out using Quantulum3 module, a
community-maintained Python library, which focuses
on extraction of volumetric units, i.e. liter and pints
from the tabular data. However, the extraction was
only performed on spreadsheets instead of PDFs (Cer-
itli and Williams, 2021). ExtracTable is an approach
recently proposed that extracts tabular data from text
files and CSVs by detecting the row patterns and
separating the columns accordingly (H
¨
ubscher et al.,
2023). However, this approach not able to address ta-
ble extraction from the PDFs.
Recently authors proposed Data Acquisition
Framework (DAF) which extracts diverse data ele-
ments from scientific publications. The DAF frame-
work has ability to extract plain-text, tables, images
and metadata from scientific publications with min-
imal template dependency. The DAF exploits hy-
brid approaches to perform the extraction from pub-
lications and performed better on chemical domain
and marine science publications(Suryani et al., 2023),
(Zhu and Cole, 2022).
Moreover, the network modeling of diverse infor-
mation into a network could be challenging as well
as interesting and previously addressed numerous ap-
plications. In a recent study a novel approach based
on Heterogeneous Information Network (HIN) tar-
gets potential relationships such as citation links, au-
thor collaborations, and research areas. By populating
such network using a random walk strategy to sim-
ulate natural sentences, the approach effectively dis-
covers relevance between papers (Du et al., 2020).
With the rapid growth of digital publishing, effi-
ciently visualizing scholarly data has become increas-
ingly demanding. This data includes millions of raw
data points such as authors, papers, citations, and
scholarly networks. Various visualization techniques
can be applied to better represent data structures and
uncover hidden patterns. The study introduces the ba-
sic concepts and collection methods for scholarly data
and provides a comprehensive overview of related vi-
sualization tools and techniques (Liu et al., 2022).
3 TABLE TO NETWORK
The section describes the respective framework and
discusses its individual components. The frame-
work consists of Tabular Data Extraction, Information
Parser and Network Modeling modules as depicted in
Figure 3. Generally, PDF is the primary format in
which scientific publications are available, so for ex-
traction of various data elements the focus will be on
the raw PDF documents.
Extracting and Modeling Tabular Data from Marine Geology Publications into a Heterogeneous Information Network
455
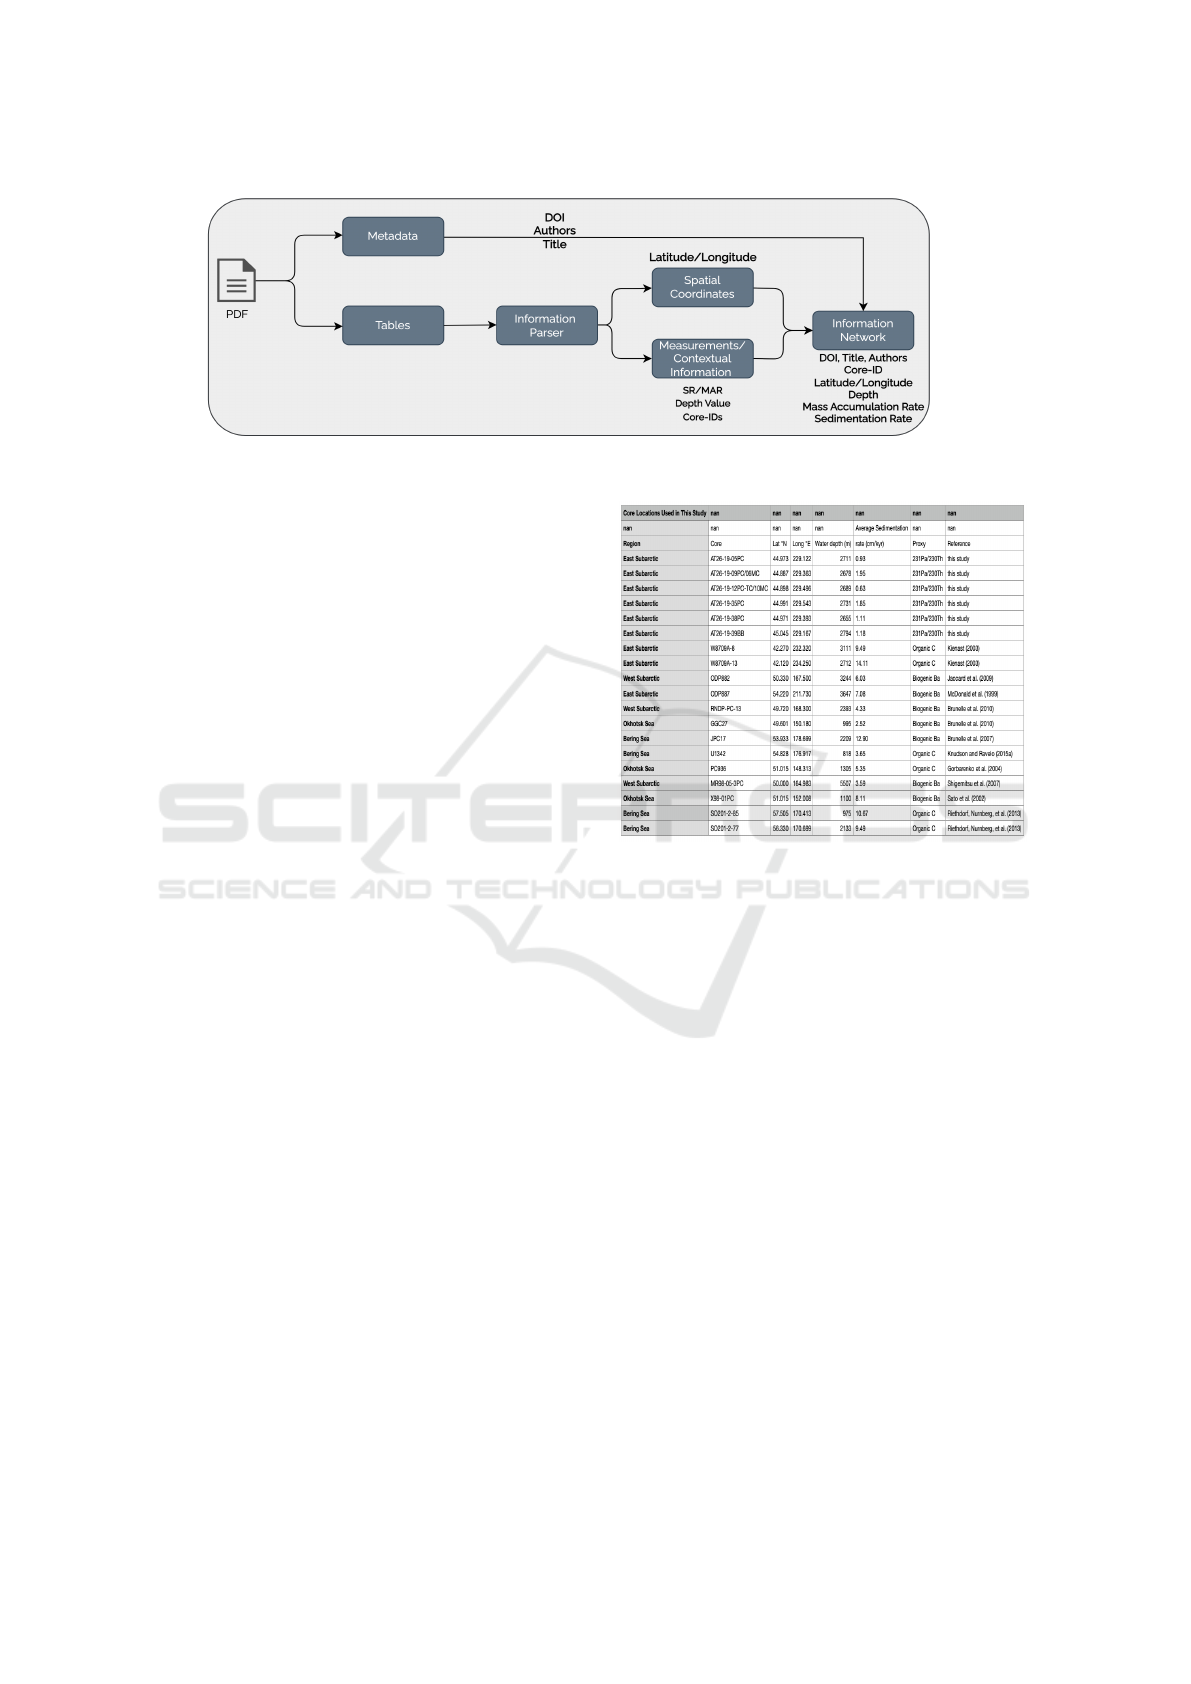
Figure 3: Block Diagram.
3.1 Data Extraction
The Data Extraction module takes on scientific pub-
lications to perform two crucial tasks, i.e. metadata
extraction and table extraction. To extract these data
components, we exploited the implementation of our
previously proposed framework i.e. Data Acquisition
Framework (DAF) (Suryani et al., 2023). The frame-
work perform hybrid approach to extract the metadata
features such as DOI, Authors and Title. The meta-
data features are generally available on the first page
of publication and follows certain patterns. The DAF
also utilizes various routines to acquire metadata fea-
tures and later provide a consolidated set of metadata
features. For tabular data, DAF breaks the task into
two distinct steps i.e. Detection and Extraction. For
the detection of tables it transform the pages of the
PDF document to coordinates and by heuristic of cap-
tion of tables to find the bounding box of the prospec-
tive tabular regions and later passed these coordinates
to base (cam, 2022) module for the extraction of tabu-
lar data to comma separated files. It is also important
to mention that DAF has better extraction coverage of
metadata features targeting domain specific research
publications as compared to (Zhu and Cole, 2022) in
chemical domain publications. The extracted sample
of tabular data is shown in Figure 4.
3.2 Information Parser
The Information Parser module exploits the extracted
tabular data from data extraction module. Informa-
tion parser module plays a crucial role in this prob-
lem setting by initially performing table processing,
which involves information detection, correction and
segregation tasks. The information parser module is
specifically designed to handle tables within the con-
text of marine geology publications, considering these
essential attributes:
1. Distinct identifiers associated with each oceano-
graphic location such as Core-ID.
Figure 4: Example of Extracted Table by DAF (Costa et al.,
2018).
2. Latitude and Longitude: Expressed in either de-
grees or decimals.
3. Mass Accumulation Rate (MAR) and Sedimenta-
tion Rate (SR) expressed in Mass/Area/Time and
Length/Time respectively.
4. Water Depth values offering vertical position to
respective identifiers generally expressed in me-
ters.
To address these information segregation from ta-
bles, we studied over 100 relevant papers to have an
overview of possible information representation sce-
narios for each of the targeted features. We care-
fully compiled an extensive dictionary encompassing
a multitude of potential variants for each relevant fea-
ture. Particularly, we identified twelve distinct vari-
ants for Core-IDs, fifteen variations for location data,
sixteen alternatives for MAR and SR headers, and
seven diverse representations for water depth mea-
surements.
The Figure 4 shows the extracted table from the
relevant publications, which indicates the efficacy of
our DAF for the extraction of tabular data from pub-
ICPRAM 2025 - 14th International Conference on Pattern Recognition Applications and Methods
456

Figure 5: Parsed Table Example (Costa et al., 2018).
lications. Later, each extracted table is parsed to ex-
tract relevant features while maintaining internal re-
lationships intact. Core-IDs often lack a fixed pat-
tern, encompassing alphanumeric strings, numbers,
or arbitrary names. So for Core-IDs, the parser refer-
ences our dictionary and tracks the relevant column.
A similar approach is employed for identifying depth
columns, though their presence is not usual. How-
ever, parsing latitude and longitude information from
extracted tables is the challenging task. As oceano-
graphic location coordinates are expressed in degrees
and minutes encounter encoding issues, such as “ °
” becoming “ 8 ” or “ 0 ” and “ ’ ” turning into “ 1
”, such complexities are not much in numbers but are
complex and not handled in this study. The sample
of parsed table is shown in Figure 5. Additionally,
measurement columns like MAR and SR are cross-
referenced with dedicated headers and units dictio-
naries respectively to have relevant measurements and
their corresponding location coordinates and core-ids.
The Figure 4 showcases the parsed tabular infor-
mation performed by the information parser which
indicates the ability to reproduce the tabular content
from the marine geology publications (Costa et al.,
2018). Hence indicating the importance and pave the
way to have tabular research data from relevant scien-
tific publications available across research.
3.3 Network Modeling
This section explains the proposed data model which
exploits metadata features and parsed tabular infor-
mation from the publications. Heterogeneous Infor-
mation Network (HIN) is used to represent and ana-
lyze complex linked data comprising various types of
entities and relationships. HIN incorporates diverse
node and edge types, capturing the multifaceted na-
Figure 6: Proposed Data Model.
ture of diverse data. HIN can be defined as a graph
G = (V, E) where V denotes the set of nodes (or ver-
tices) and E represents the set of edges. This rep-
resentation and understanding of interconnected data,
makes HINs particularly useful in various potential
studies (Liu et al., 2022). In this problem setting,
HINs are populated by leveraging the proposed data
models, which integrate the relational data and meta-
data by performing exploratory analyses to showcase
the broader spectrum of information from publica-
tions.
The data model leverages the extracted metadata
features alongside the parsed tabular data from the
respective publication sources. Figure 6 illustrates
the data model, which organizes heterogeneous fea-
tures from marine geology publications. It structures
both metadata and tabular data, while capturing docu-
ment level relationships intact. Furthermore, the data
model facilitates the generation of a heterogeneous in-
formation network, revealing potential relationships
among targeted entities and providing a broader con-
text across documents.
4 EXPERIMENTAL RESULTS
This section provides explanation of the experimental
setup employed, followed by a brief discussion on the
gathered exploratory results.
4.1 Data Description
In this exploratory study, publications from Marine
Geology were gathered from various publishers. A
comprehensive exploration covering over 300 full ar-
ticles was conducted, serving various purposes, such
as collection of diverse expressions of information
representation. The selection criteria for these pub-
lications was centered around an important require-
Extracting and Modeling Tabular Data from Marine Geology Publications into a Heterogeneous Information Network
457
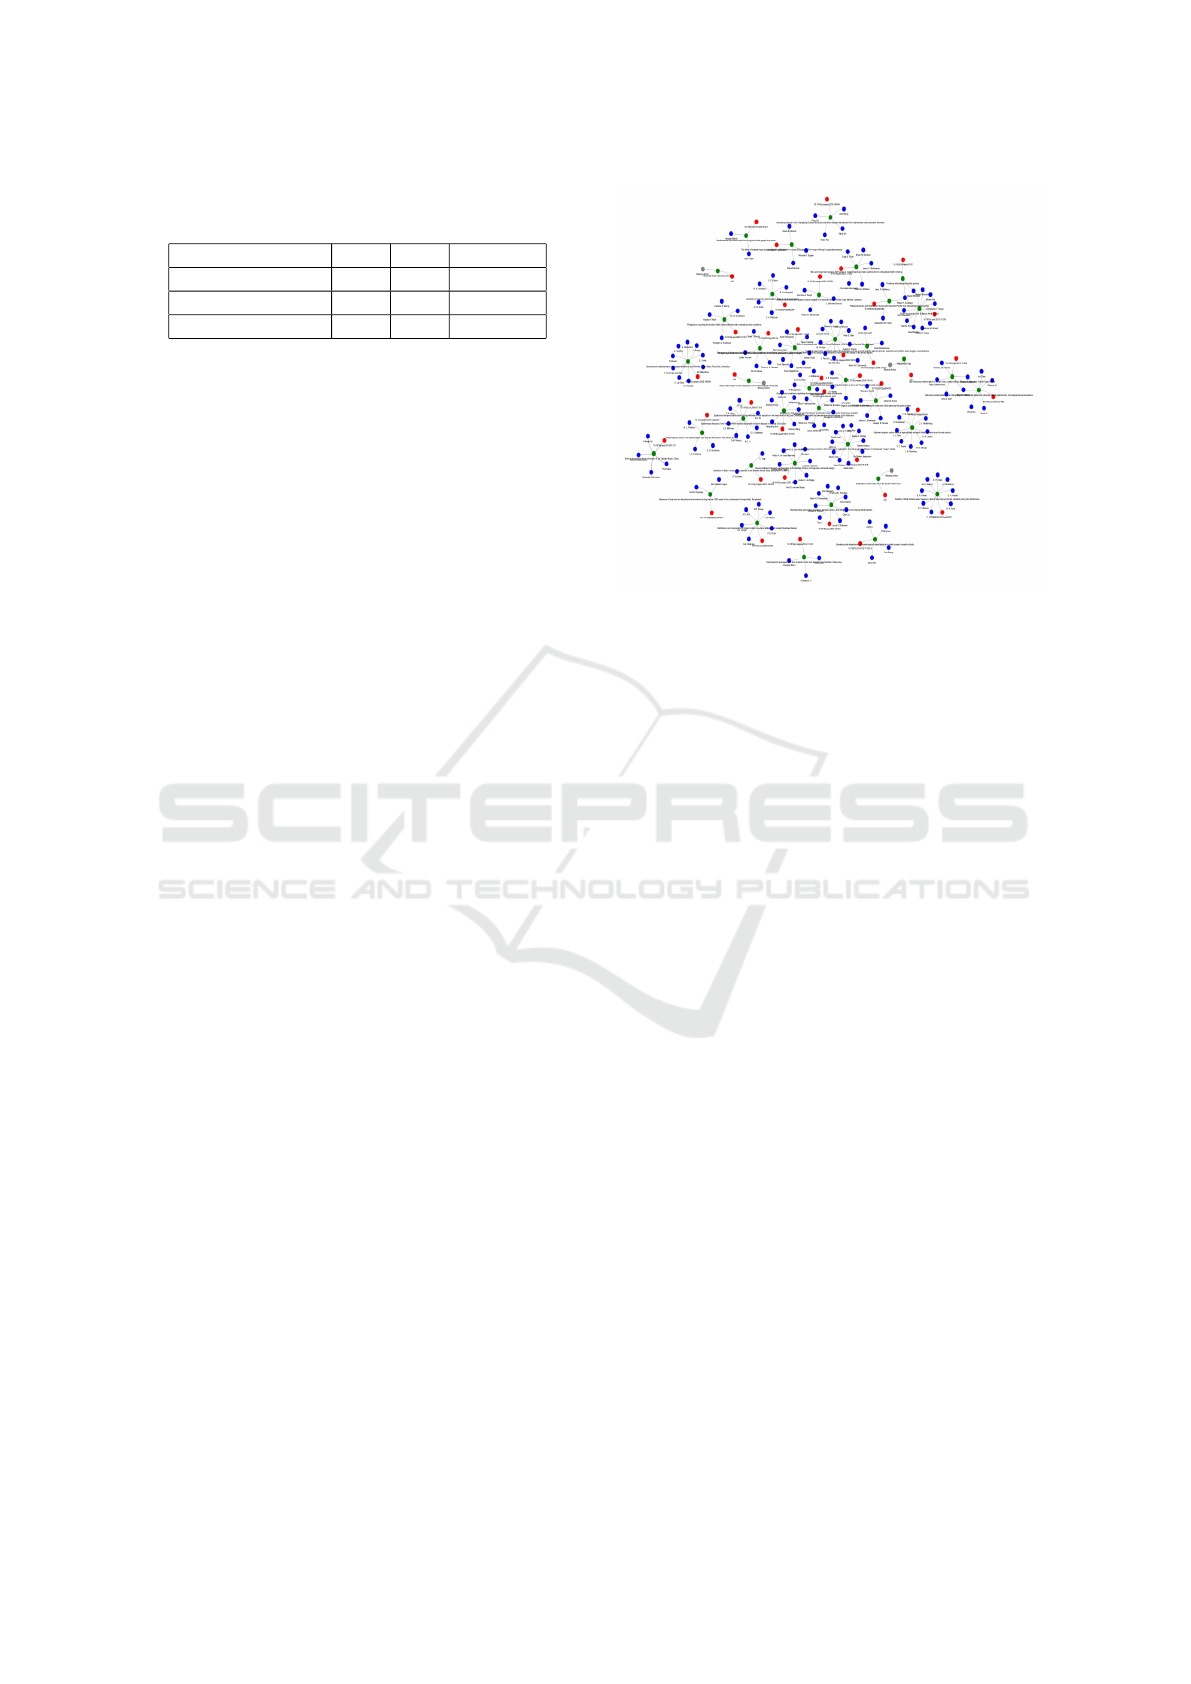
Table 1: Collected Results of Metadata Features from Pub-
lications.
Metadata Feature P R F1-Score
DOI 1.0 0.90 0.95
Title 0.95 1.0 0.97
Author 1.0 0.90 0.95
ment, as each publication must carry location coordi-
nates and relevant measurements in tables.
Moreover, it is also important to mention that the
problem, we are addressing here is not explored be-
fore, so to search for the relevant sources require con-
siderable efforts. Furthermore, an evaluation of the
overall framework was undertaken on forty full pa-
pers from Marine Geology covering different pub-
lishers. However, collection of data for experimenta-
tion from various publishers will also be important to
test the template coverage of Data Acquisition Frame-
work (Suryani et al., 2023).
4.2 Results and Discussion
The set of publications are initially processed by Data
Acquisition Framework (DAF) and results are col-
lected(Suryani et al., 2023). The first set of results
comprise of targeted metadata features such as DOIs,
Author information and the title of the publications
which will be helpful in answering the questions re-
lated to the origination of research activity such as the
authors being involved in the research study. Beside,
it is also helpful in studying the relationships across
metadata features. The results in this regard are com-
piled and shown in Table 1.
There were a total of 111 table instances across
the publications, out of which DAF successfully ex-
tracted 106. The criterion for true table extraction
was to ensure that all rows and columns remained in-
tact. Among these 106 table instances, 46 were iden-
tified as relevant, carrying the desired information for
our proposed study. Furthermore, the information
parser successfully parsed 40 of these relevant tables,
while the remaining 6 encountered issues where lo-
cation coordinates were misaligned, as described in
Section 3.2. The later steps involve modeling the ex-
tracted information into a heterogeneous information
network. For the sake of simplicity, information mod-
eling is performed at two levels: metadata and com-
plete. By exploiting the importance of metadata fea-
tures, information modeling is initially performed on
the extracted metadata features, showcasing the meta-
information to relevant research communities. Figure
7 illustrates a network of metadata features of publica-
tions. For better understanding, all node types follow
a distinct color scheme, DOI instances are represented
Figure 7: Network based on Metadata of Marine Geology
Publications.
in red, author nodes in blue, and titles in green.
Finally, we constructed a comprehensive network
which models all the extracted information from the
publications i.e. metadata features, relevant measure-
ments and contextual information. For better ex-
ploration the features are denoted in different color
scheme to enhance the information accessibility. The
network in this regard is shown in Figure 8. Here the
information against core ID is presented in pink and
all relevant tabular information is shown in purple.
Moreover, the network in Figure 8 also showcase the
author level information as well as the core level con-
nectivity to showcase the diverse relationships. Hence
capable of addressing various questions including:
Finally, we constructed a comprehensive network
that models all the extracted information from the
publications, including metadata features, relevant
measurements, and contextual information. To facil-
itate better exploration, the features are represented
using a distinct color scheme to enhance information
accessibility as shown in Figure 8.
In this figure, information associated with the
core-ID is presented in pink, while all relevant tab-
ular information is displayed in purple. Moreover, the
network in Figure 8 also illustrates author-level infor-
mation and core-level connectivity, highlighting the
diverse relationships which address various questions,
including:
1. What are the identifiers for the targeted locations?
2. Who measured these values?
3. Where are SR and MAR values measured.
4. What is the water depth value corresponding to
these measurements in specific regions?
ICPRAM 2025 - 14th International Conference on Pattern Recognition Applications and Methods
458
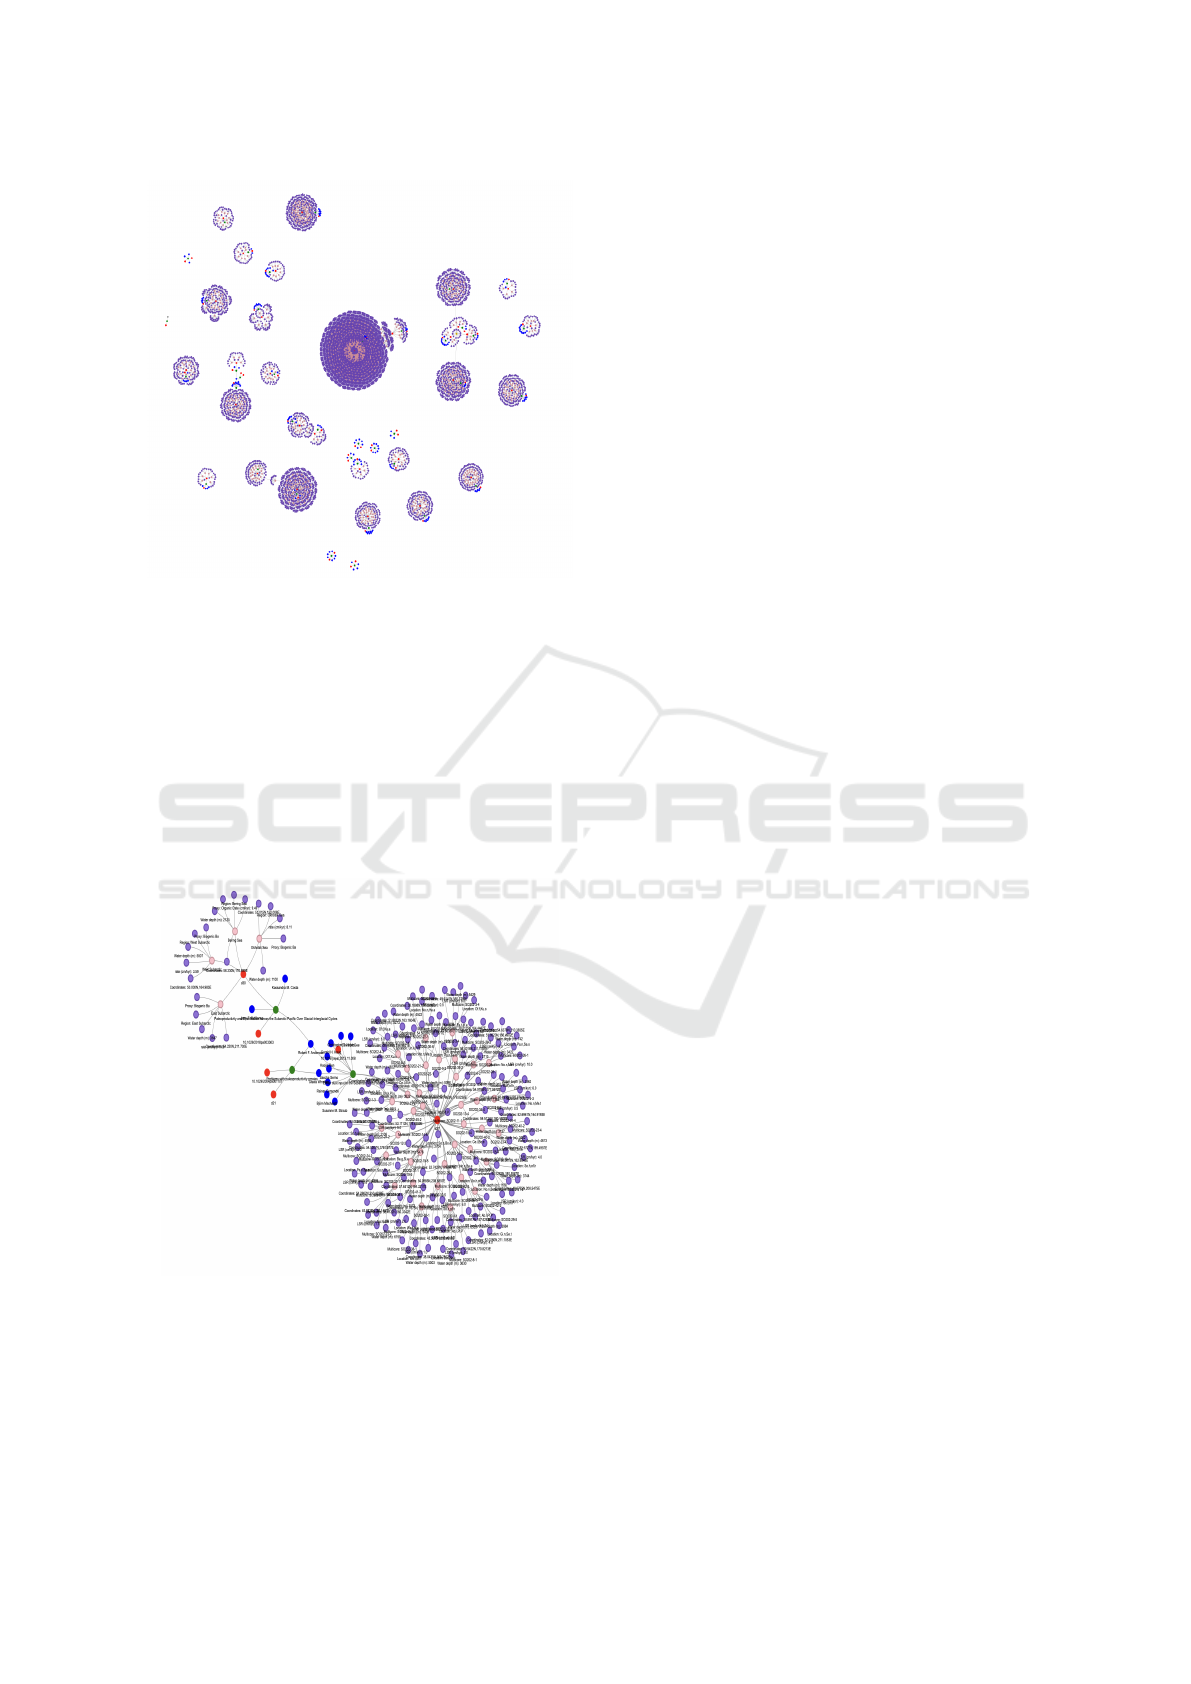
Figure 8: Network Comprise of metadata and parsed tabular
data from Marine Geology Publications.
5. Who are the potential collaborators targeting geo-
graphical regions?
Hence, to enhance information delivery, a small
subset of the complete network is presented in Fig-
ure 9, illustrating author level relationships between
two documents. Additionally, it highlights poten-
tial location based research collaborations and identi-
fies groups or individuals working at specific oceano-
graphic locations.
Figure 9: Subset of the Network Showing Potential Rela-
tionships across Publications.
This exploratory study aims to highlight the di-
verse information available across research publica-
tions by facilitating research data management and
the open science initiative. One of the major aspects is
to integrate more research data from marine geology
into the scholarly eco-system at different granulari-
ties. Figure 7 aims to provide author level relation-
ships within a set of publications, which are equally
essential for an abstract overview.
5 CONCLUSION
The proposed framework addresses the challenging
task of extracting tables from scientific publications
to enhance the information discovery process by re-
trieving diverse quantitative data along with contex-
tual information from tables in PDF files. This ap-
proach contributes to making research data more ac-
cessible and usable within the marine geology do-
main. Unlike prevalent approaches that primarily fo-
cus on textual data, our framework emphasizes tab-
ular data, generating valuable insights that were pre-
viously limited to the researchers. The potential out-
come of the framework is the creation of document-
level Heterogeneous Information Network that lever-
ages heterogeneous metadata and tabular content.
In addition, it is essential to discuss the potential
challenges in this problem setting. The variance in
the representation of tabular data in publications is a
key aspect to consider, as it elevates the challenges
in the table detection and extraction process. Further-
more, metadata plays a crucial role in facilitating in-
formation profiling, however, its extraction is equally
challenging, primarily due to the variety of templates.
Furthermore, the lack of standardized guidelines for
representing such diverse data in marine geology pub-
lications is notable and need to be focused in future
for a streamlined delivery of information.
Moreover, it is essential to highlight two key as-
pects: the availability of relevant publications and the
extraction of data from these publications. Regarding
availability, finding relevant publications while ad-
hering to FAIR principles is challenging, despite the
availability of large number of publications. Besides,
in terms of data extraction, numerous historical docu-
ments exist that are not true PDF files, indicating to-
wards an enhanced data extraction approach capable
of extracting relevant information from images.
Beyond marine geology, the proposed framework
holds promise as a versatile solution applicable across
various scientific domains. Additionally, integrating
it with textual information extraction could enable
a comprehensive automated approach for efficiently
extracting heterogeneous data from all components
of scientific publications. Future directions include
leveraging the extracted information for applications
such as recommender systems, research community
Extracting and Modeling Tabular Data from Marine Geology Publications into a Heterogeneous Information Network
459

detection, and spatial research collaborations. Fur-
thermore, addressing the diverse representations of
tabular data by transforming PDFs into LaTeX ex-
pressions represents an exciting future research direc-
tion. Lately, the adoption of Large Language Mod-
els (LLMs) for various Natural Language Processing
(NLP) tasks paves the way for their potential adop-
tion in information extraction, highlighting exciting
prospects for future research.
ACKNOWLEDGEMENTS
This work was partially funded by the Helmholtz As-
sociation (grant HIDSS-0005). EB-G received sup-
port from the Cluster of Excellence ‘The Ocean Floor
– Earth’s Uncharted Interface’ (EXC 2077) funded by
Deutsche Forschungsgemeinschaft (DFG) - Project
number 390741603 hosted by the Research Faculty
MARUM-Center for Marine Environmental Sciences,
University of Bremen, Germany. This work has been
partially supported by the Deutsche Forschungsge-
meinschaft (DFG, German Research Foundation), un-
der SmartER project (Grant number 515537520). Au-
thors also acknowledge the sources being used and the
efforts of all collaborators.
REFERENCES
(2022). Camelot. Last accessed 4 May 2023.
(2022). Tabula-py. Last accessed 4 May 2023.
Ceritli, T. and Williams, C. K. (2021). Identifying the
units of measurement in tabular data. arXiv preprint
arXiv:2111.11959.
Chuang, P.-C., Yang, T. F., Wallmann, K., Matsumoto, R.,
Hu, C.-Y., Chen, H.-W., Lin, S., Sun, C.-H., Li, H.-
C., Wang, Y., et al. (2019). Carbon isotope exchange
during anaerobic oxidation of methane (aom) in sedi-
ments of the northeastern south china sea. Geochimica
et Cosmochimica Acta, 246:138–155.
Costa, K. M., McManus, J. F., and Anderson, R. F. (2018).
Paleoproductivity and stratification across the sub-
arctic pacific over glacial-interglacial cycles. Paleo-
ceanography and Paleoclimatology, 33(9):914–933.
Du, N., Guo, J., Wu, C. Q., Hou, A., Zhao, Z., and
Gan, D. (2020). Recommendation of academic pa-
pers based on heterogeneous information networks.
In 2020 IEEE/ACS 17th International Conference on
Computer Systems and Applications (AICCSA), pages
1–6. IEEE.
Ducatteeuw, V. (2021). Developing an urban gazetteer: A
semantic web database for humanities data. In Pro-
ceedings of the 5th ACM SIGSPATIAL International
Workshop on Geospatial Humanities, pages 36–39.
G
¨
opfert, J., Kuckertz, P., Weinand, J., Kotzur, L., and
Stolten, D. (2022). Measurement extraction with nat-
ural language processing: A review. Findings of the
Association for Computational Linguistics: EMNLP
2022, pages 2191–2215.
Hendricks, G., Tkaczyk, D., Lin, J., and Feeney, P. (2020).
Crossref: The sustainable source of community-
owned scholarly metadata. Quantitative Science Stud-
ies, 1(1):414–427.
H
¨
ubscher, L., Jiang, L., and Naumann, F. (2023). Ex-
tractable: Extracting tables from raw data files. BTW
2023.
Liu, J., Shi, C., Yang, C., Lu, Z., and Philip, S. Y. (2022). A
survey on heterogeneous information network based
recommender systems: Concepts, methods, applica-
tions and resources. AI Open, 3:40–57.
Lopez, P. (2009). Grobid: Combining automatic biblio-
graphic data recognition and term extraction for schol-
arship publications. In Research and Advanced Tech-
nology for Digital Libraries: 13th European Con-
ference, ECDL 2009, Corfu, Greece, September 27-
October 2, 2009. Proceedings 13 , pages 473–474.
Springer.
Martinez-Rodriguez, J. L., Hogan, A., and Lopez-Arevalo,
I. (2020). Information extraction meets the semantic
web: a survey. Semantic Web, 11(2):255–335.
Moulin, T. C. and Amaral, O. B. (2020). Using collabo-
ration networks to identify authorship dependence in
meta-analysis results. Research Synthesis Methods,
11(5):655–668.
Petersen, T., Suryani, M. A., Beth, C., Patel, H., Wall-
mann, K., and Renz, M. (2021). Geo-quantities: A
framework for automatic extraction of measurements
and spatial context from scientific documents. In
17th International Symposium on Spatial and Tempo-
ral Databases, pages 166–169.
Suryani, M. A., Hahne, S., Beth, C., Wallmann, K., and
Renz, M. (2023). Daf: Data acquisition framework to
support information extraction from scientific publica-
tions. In Proceedings of the 15th International Joint
Conference on Knowledge Discovery, Knowledge En-
gineering and Knowledge Management - Volume 1:
KDIR, pages 468–476. INSTICC, SciTePress.
Suryani, M. A., W
¨
olker, Y., Sharma, D., Beth, C., Wall-
mann, K., and Renz, M. (2022). A framework for ex-
tracting scientific measurements and geo-spatial infor-
mation from scientific literature. In 2022 IEEE 18th
International Conference on e-Science (e-Science),
pages 236–245. IEEE.
Wahle, J. P., Ruas, T., Mohammad, S. M., and Gipp, B.
(2022). D3: A massive dataset of scholarly metadata
for analyzing the state of computer science research.
arXiv preprint arXiv:2204.13384.
Zhu, M. and Cole, J. M. (2022). Pdfdataextractor: A tool
for reading scientific text and interpreting metadata
from the typeset literature in the portable document
format. Journal of Chemical Information and Model-
ing, 62(7):1633–1643.
ICPRAM 2025 - 14th International Conference on Pattern Recognition Applications and Methods
460
