
Longitudinal Analysis of Disease Progression in the Elderly: An Approach
to Mitigate the Burden of Frailty, Functional and Cognitive Decline
Patrizia Ribino
1 a
, Giovanni Paragliola
2 b
, Claudia Di Napoli
2 c
, Luca Serino
2 d
,
Davide Chicco
3,5 e
and Francesca Gasparini
3,4 f
1
Istituto di Calcolo e Reti ad Alte prestazioni, Consiglio Nazionale delle Ricerche (CNR), Palermo, Italy
2
Istituto di Calcolo e Reti ad Alte prestazioni, Consiglio Nazionale delle Ricerche (CNR), Naples, Italy
3
Dipartimento di Informatica Sistemistica e Comunicazione, Universit‘a di Milano-Bicocca, Milan, Italy
4
NeuroMI, Milan Center for Neuroscience, Universit‘a di Milano-Bicocca, Milan, Italy
5
Institute of Health Policy Management and Evaluation, University of Toronto, Toronto, Ontario, Canada
{patrizia.ribino, giovanni.paragliola, claudia.dinapoli, luca.serino}@icar.cnr.it,
Keywords:
Longitudinal Clustering, Mental Health, Clustering Trajectories, Unsupervised Machine Learning.
Abstract:
Mitigating age-related cognitive and functional decline is of paramount importance, especially in aging countries
that are increasingly at risk of frailty and disability among the elderly population. This decline not only poses
significant challenges for the elderly themselves but also contributes to an increased burden on caregivers. In
particular, Alzheimer’s disease (AD) is the leading cause of cognitive decline in people aged 65 and older. It
typically begins with mild memory problems that gradually worsen, leading to significant loss of brain function.
Early detection of indicators of cognitive decline is critical to the diagnosis and treatment of neurodegenerative
diseases, so acting as early as possible can improve the quality of life of older adults. This study analyzes the
OASIS-3 dataset of Electronic Mental Health Records (EMHRs), focusing on identifying different trajectories
of cognitive decline over time in stable and progressing individuals. Unlike many studies that analyze groups
of patients at single points in time, this study uses a longitudinal approach to examine Alzheimer’s disease
progression over time using clustering analysis. This study uses a k-means-based joint longitudinal data
algorithm to cluster joint trajectories to identify distinct subgroups within a population according to their
longitudinal profiles.
1 INTRODUCTION
Preventing age-related cognitive and functional decline
is a critical priority, particularly in ageing countries
whose number is rapidly increasing due to natality
problems and advances in medicine.
Frailty, defined by reduced functionality and in-
creased vulnerability, requires targeted interventions.
Among these interventions, the possibility of early de-
tection of risk factors leading to vulnerability is crucial,
as highlighted in several initiatives, such as the Age-It
project (https://ageit.eu/wp/). This project is funded
a
https://orcid.org/0000-0003-3266-9617
b
https://orcid.org/0000-0003-3580-9232
c
https://orcid.org/0000-0002-8626-5805
d
https://orcid.org/0000-0003-0077-1799
e
https://orcid.org/0000-0001-9655-7142
f
https://orcid.org/0000-0002-6279-6660
by the EU’s Next Generation program, under which
our study is conducted. In this context, this article
leverages the benefits of longitudinal analysis to iden-
tify clinical markers for stratifying populations and
tracking cognitive trajectories in the elderly at risk of
developing Alzheimer’s disease (AD). AD affects mil-
lions of people worldwide, 6.7 million are estimated
only among Americans (Better, 2023), and is the lead-
ing neurological cause of dementia in people aged 65
and older (Reitz et al., 2011). The disease typically be-
gins with mild memory loss that progressively worsens
over time, eventually leading to significant cognitive
decline and loss of brain function.
In 2011, the National Institute on Aging and the
Alzheimer’s Association introduced revised criteria
for diagnosing Alzheimer’s disease, outlining three
distinct stages of the disease (Sperling et al., 2011).
The preclinical stage marks the onset of measurable bi-
Ribino, P., Paragliola, G., Di Napoli, C., Serino, L., Chicco, D. and Gasparini, F.
Longitudinal Analysis of Disease Progression in the Elderly: An Approach to Mitigate the Burden of Frailty, Functional and Cognitive Decline.
DOI: 10.5220/0013396800003911
Paper published under CC license (CC BY-NC-ND 4.0)
In Proceedings of the 18th International Joint Conference on Biomedical Engineering Systems and Technologies (BIOSTEC 2025) - Volume 2: HEALTHINF, pages 1083-1091
ISBN: 978-989-758-731-3; ISSN: 2184-4305
Proceedings Copyright © 2025 by SCITEPRESS – Science and Technology Publications, Lda.
1083

ological and pathological changes but without obvious
symptoms. This is followed by Mild Cognitive Impair-
ment (MCI), where patients have subtle but detectable
problems with memory and cognitive functions.
Finally, in the AD stages, cognitive decline be-
comes so severe that people lose the ability to carry
out everyday tasks and require assistance with basic
activities of daily living.
However, in the elderly, some cognitive skills, such
as memory capacity, cognitive abilities, reasoning,
understanding, judgment, emotions, personality, and
behavior, suffer from subtle changes associated with
the normal aging process. In contrast, others suffer a
greater cognitive decline than expected. Still, not all
decrements in cognitive functioning in this population
are precursors of disease.
Moreover, it has been established that not all MCI
patients necessarily develop AD in the future (Manly
et al., 2008; Overton et al., 2020; Qin et al., 2023).
Generally, there are two kinds of clinical changes for
MCI patients: (1) MCI stables (MCIs) are those who
retain MCI diagnosis at future time points, and (2)
MCI progressors (MCIp) are those who show symp-
toms of AD in the future. Therefore, early detection
of indicators of cognitive decline over time is of ut-
most importance as it could help diagnose and treat
neurodegenerative diseases.
However, several studies are limited to single time-
point visits separately (Ribino et al., 2023; Escudero
et al., 2011; Holilah et al., 2021; Putri et al., 2023).
Longitudinal studies are more appropriate since differ-
ent subgroups of patients may exhibit different cogni-
tive progressions over their lifetime.
Longitudinal studies allow the analysis of large
datasets containing measures taken repeatedly over
time to identify unknown patterns in high-dimensional
and heterogeneous data types. The variable of interest,
measured over time, represents a trajectory.
Numerous studies have been conducted on trajec-
tory analysis (Warren Liao, 2005). Some attempt to
classify trajectories based on model knowledge (De la
Cruz-Mes
´
ıa et al., 2008) while others focus on clus-
tering real-world trajectories by segmenting them into
smaller sections (Lee et al., 2007). In addition, some
studies focus on specific areas, such as clustering gene
trajectories (Bar-Joseph et al., 2002), and some aim
to improve performance through improved clustering
methods (Tseng and Lin, 2007).
This article exploits unsupervised machine learn-
ing techniques, such as clustering, to identify sub-
groups or clusters in the data that are distinguished
by an appropriate measure of similarity without prior
knowledge of the assignment of observations to clus-
ters or the existence of clusters. When several variables
are measured over time, joint trajectories are obtained.
Rather than analyzing each variable separately, joint
trajectories are used to understand how multiple vari-
ables co-vary or evolve about each other. By clustering
common trajectories, distinct subgroups within a pop-
ulation can be identified, providing a deeper insight
into individual development patterns over time across
multiple dimensions.
Clustering multiple longitudinal characteristics is
a more complex task due to inter- and intra-feature de-
pendencies, mixed data types (such as continuous and
categorical variables), different measurement times
for features (Sun et al., 2016; Feng et al., 2018), se-
curity and privacy issues (Balkus et al., 2022), and
determining the optimal number of clusters.
In this work, we use our custom implementation of
a k-means-based joint longitudinal data algorithm (Rib-
ino et al., 2024) to identify different trajectories of cog-
nitive decline over time in stable and progressing in-
dividuals. Moreover, we adopt feature selection meth-
ods based on correlation coefficients, centroid-based
methods, and appropriate normalization to improve
the model’s performance. The results obtained by ana-
lyzing the Open Access Series of Imaging Studies-3
(OASIS-3) database (http://oasis-brains.org) highlights
four different elderly profiles. The first one delineates
the elderly who do not show a cognitive decline. The
second one encompasses individuals who exhibit min-
imal cognitive impairments. The third may represent
MCIs individuals. Finally, the last one identifies el-
derly people who show relevant cognitive decline.
The rest of the paper is organized as follows. In
Section 2, the approach and the data used for this work
are presented. Section 3 presents the results of the
clustering analysis. Finally, in Section 4, conclusions
are drawn.
2 DATA AND METHODS
2.1 Dataset Description
Data used in this article were obtained from the
Open Access Series of Imaging Studies-3 (OASIS3)
database (http://oasis-brains.org) (LaMontagne et al.,
2019). OASIS-3, collected by Washington University
Knight Alzheimer Disease Research Center provided
MR imaging and related clinical data of 1098 partic-
ipants, consisting of 605 cognitively normal adults
and 493 individuals at various stages of cognitive de-
cline ranging in age from 42 to 95 years. Participants
were assessed through clinical protocols following the
National Alzheimer’s Coordinating Center Uniform
Data Set (UDS) (Besser et al., 2018). For each partici-
Scale-IT-up 2025 - Workshop on Scaling Up Care for Older Adults
1084

pant, OASIS-3 documents the corresponding entries
in a time series. Dementia status was assessed for
the UDS using the Clinical Dementia Rating (CDR)
Scale (Morris, 1997) with
CDR = 0
indicating normal
cognitive function,
CDR = 0.5
very mild impairment,
CDR = 1
mild impairment, and
CDR = 2
moderate
dementia. Once participants reached
CDR = 2
, they
were no longer eligible for in-person assessments. All
participants were required to have a
CDR ≤ 1
at the
time of the most recent Clinical assessment. Partici-
pants also underwent neuropsychological assessment
through several neuropsychological tests, including
the Mini-Mental State Examination (MMSE) (Folstein
et al., 1975). The MMSE is based on scores ranging
from 0 (severe impairment) to 30 (no impairment).
For the purpose of this study, only patients with five
consecutive visits occurring with an annual frequency,
with a tolerance of two months, were selected from the
original data, resulting in a final dataset of 166 subjects.
Variables related to brain images were not considered
because the time-frequency of these analyses is not
coherent with the time-frequency of the considered
visits. Moreover, final clinical assessments are also
not included in the analyzed data.
2.2 Longitudinal Clustering and
Features Selection
In this paper, our custom implementation of k-means-
based longitudinal clustering for multivariate time se-
ries was used (Ribino et al., 2024). This method is
based on Time series K-means clustering (Tavenard
et al., 2020), a relatively novel method commonly used
to identify univariate time series patterns. K-means
(MacQueen, 1967) is a popular clustering algorithm
that aims to partition n elements into k clusters, in
which each observation belongs to the cluster with
the nearest centre. It starts by randomly assigning the
clusters centroid in the space. Then, each data point
is assigned to one of the clusters based on its distance
from the cluster’s centroid. Normally, K-means use
Euclidean distance. However, in the case of time series,
it generally performs poorly. This paper uses K-means
for multivariate time series by employing soft-DTW
distance. Soft-DTW (Cuturi and Blondel, 2017) is a
differentiable loss function suitable for Dynamic Time
Warping. This allows for the application of gradient-
based algorithms in the context of time series analysis.
The barycenter is defined as the time series that min-
imizes the aggregate distance between itself and the
other time series within a given dataset. Moreover, a
feature selection process was conducted to select the
most relevant features to reduce input features, thus
improving the computational cost of modeling and the
model’s performance. Firstly, the features with at least
20% of undefined values were eliminated because they
did not significantly contribute to the study and could
wrongly affect the clustering. Then, filtering using the
Pearson correlation coefficient was performed. After
that, a feature centroid-based feature selection method
was implemented in the K-mean-based longitudinal
clustering, where the features with the closest similar-
ity between cluster centroids (i.e., overlapping) were
discarded (since they decreased cluster separation),
and the algorithm performed a new execution with the
new set of features.
3 CLUSTERING RESULTS
Among the 166 patients here considered, at the first
visit, 123 of them (74.1%) were individuals with Nor-
mal Cognition (NC) (
CDR = 0
), 41 (24.7%) with MCI
(CDR = 0.5), and 2 (1.2%) with mild AD (CDR = 1),
respectively. All 166 underwent four consecutive
follow-up visits, each occurring at one-year intervals,
on average.
The proposed longitudinal clustering method has
been applied to this cohort of individuals, trying to
identify feature trends that allow stratifying individu-
als (that is, healthy, MCI, or AD) who do not change
their clinical state during the follow-up period and in-
dividuals who change their clinical state from healthy
to MCI and MCI to AD at the follow-up visits. To
achieve the desired objective, the CDR and MMSE
scores have been excluded from the clustering analysis,
as these two indicators are widely utilized in assess-
ing AD. This exclusion was implemented to prevent
any potential bias in the clustering process. Moreover,
we set the number of clusters
k = 4
with the aim of
detecting trajectories related to four types of cogni-
tive evolution: i) stable cognitively normal subjects,
ii) cognitively normal subjects that change in MCI, iii)
MCIs subjects, and iv) MCIp, that are MCI patients
who are more likely to progress to AD.
The feature selection process results in the follow-
ing relevant features: subject’s age, geriatric depres-
sion scale, presence of thyroid symptoms, and a subset
of NeuroPsychiatric Symptoms (NPS), mainly depres-
sion in the last two years, agitation, depression at the
time of the visit, anxiety, disinhibition, and irritability.
The longitudinal clustering performance was evalu-
ated using the three common metrics: 1) the Silhouette
score utilized to assess the cohesion and separation
of clusters in the
[−1;+1]
interval (the higher, the
better); 2) the Davies-Bouldin Index (DBI)) that mea-
sures the ratio of within-cluster distances to between-
cluster distances in the
[0;∞]
interval (the lower the
Longitudinal Analysis of Disease Progression in the Elderly: An Approach to Mitigate the Burden of Frailty, Functional and Cognitive
Decline
1085

1 2 3 4 5
Cluster 1
0.05 0.07 0.08 0.09 0.11
Cluster 2 0.36 0.24 0.31 0.38 0.40
Cluster 3 0.43 0.50 0.50 0.50 0.50
Cluster 4
0.50 0.40 0.60 0.60 1.20
0.00
0.20
0.40
0.60
0.80
1.00
1.20
1.40
CDR
1 2 3 4 5
Cluster 1
29.0 28.9 28.9 29.0 28.7
Cluster 2 28.0 28.0 27.6 27.1 27.5
Cluster 3 29.0 28.4 28.1 28.1 28.6
Cluster 4
26.8 26.0 25.0 21.8 18.8
15.0
17.0
19.0
21.0
23.0
25.0
27.0
29.0
MMSE
Figure 1: Trends of the CDR and MMSE average values for the four clusters (each reported with a different color) computed
over five consecutive visits. CDR: Clinical Dementia Rating. MMSE: Mini-Mental State Examination.
better); and 3) the Calinski-Harabasz Index (CHI)
that evaluates the ratio of between-cluster dispersion
to within-cluster dispersion in the
[0;∞]
interval (the
higher the better). We obtained with
k = 4
respec-
tively:
Silhouette = +0.502
,
CHI = 154.367
, and
DBI = 1.085
, demonstrating the appropriateness of
the features and number of clusters chosen.
In Figure 1, the trends of the CDR and MMSE
variables for each cluster and for each time point are
reported to assess the validity of the identified clusters
in accurately representing stable or progressor subjects.
In Figure 2, the graphical results of the longitudinal
clustering on the OASIS-3 variables resulting from the
feature selection process are reported.
As Figure 1 shows, Cluster 1 groups individuals
whose CDR trajectory is stable on a value of
CDR = 0
and
MMSE = 29
on average, thus delineating elderly
that do not show a cognitive decline. As we can note
in Figure 2, such individuals show an average age of
74
years at the baseline without problems of Thyroid,
with a slight Geriatric Depression Scale (GDS). More-
over, the trajectories of the specific domains consid-
ered by the Neuropsychiatric Inventory Questionnaire
(NPI)(Cummings, 1997) (that is, anxiety, agitation,
depression in the last month, disinhibition, and irri-
tability) remained stable, showing no problems in each
domain over time.
Cluster 2 encompasses individuals who exhibit
minimal cognitive impairments (
0 ≤ CDR ≤ 0.5
) that
may be indicative of typical age-related cognitive de-
cline or subjects that are likely to develop MCI. This
is supported by the MMSE trajectory, which demon-
strates a subtle decrease while remaining within the
range associated with normal cognitive function. As
Cluster 1, individuals in Cluster 2 show a slight GDS,
and they do not have problems with Thyroid. How-
ever, it is interesting to observe the trajectories of
NPI domains in Figure2. Mainly, Individuals in Clus-
ter 2 are characterized by depression episodes within
the last two years from the follow-up visits (that is,
DEP2YRS), and they show an increase in depression
in the last visits (that is, DEPD). Moreover, they show
agitation, disinhibition, and irritability with slightly
increasing anxiety.
Cluster 3 groups individuals whose CDR trajectory
is stable at
CDR = 0.5
and
MMSE ≈ 28
on average,
thus delineating MCI stable individuals. As Cluster 1
and Cluster 2, individuals in Cluster 3 show a slight
GDS, and they do not have problems with the thyroid.
They do not experience depression, anxiety, and disin-
hibition. They are slightly irritable and show a slightly
decreasing level of agitation.
Finally, Cluster 4 groups individuals that show
a cognitive decline as highlighted by the
CDR
and
MMSE
trajectories. These individuals have a higher
level of GDS at the baseline than individuals of the
other clusters, with a slight presence of thyroid prob-
lems at the last visit. As individuals in Cluster 2,
they experienced depression in the last two years from
the follow-up visits. However, they show depression
symptoms also during the follow-up visit on average.
We observed a relatively stable trend of irritability and
modest increases in disinhibition and anxiety.
3.1 Statistical Analysis
A statistical analysis was conducted to compare the
clinical characteristics, prevalence of neuropsychiatric
symptoms, and cognitive performance among the iden-
tified clusters at the baseline and final follow-up visit.
In particular, the categorical variables were exam-
ined using a Chi-squared test (Pearson, 1900) to deter-
mine statistically significant differences among clus-
ters. In contrast, the analysis of quantitative variables
employed the ANOVA test or the Kruskal-Wallis test
(Kruskal and Wallis, 1952) based on the normality of
their distribution. All statistical analyses were per-
formed using Python libraries. The threshold for statis-
tical significance was set to
p < 0.05
. Tables 1 and 2
report the characteristics of individuals in each cluster
along with the related p-value. Qualitative variables
were represented in terms of frequency and percentage,
while quantitative variables were represented using
mean and standard deviation (mean ±SD).
Scale-IT-up 2025 - Workshop on Scaling Up Care for Older Adults
1086
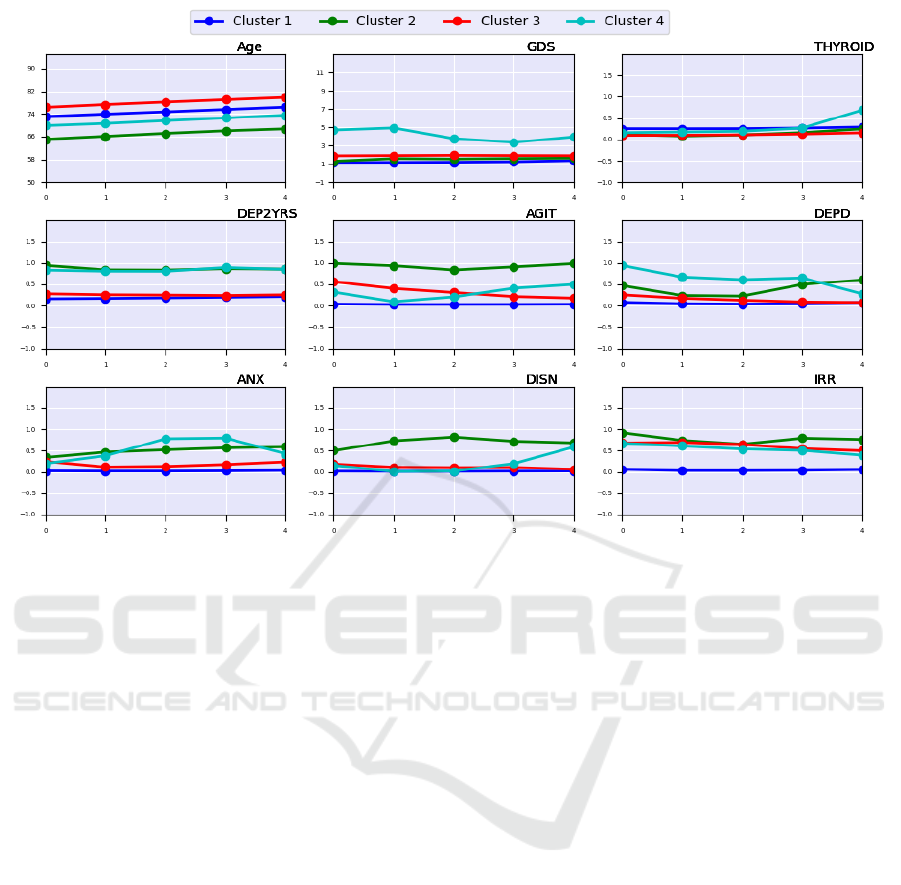
Figure 2: Trends of the centroids values of the four clusters (each reported with a different color) for the selected features
computed over the five consecutive visits. Age: age of the patient. GDS: Geriatric Depression Scale. THYROID: Presence of
Thyroid symptoms. DEP2YRS: Depression in the last 2 years. AGIT: Agitation. DEPD: Depression at the time of the visit.
ANX: Anxiety. DISN: Disinhibition. IRR: Irritability.
A Kruskal-Wallis H test was performed to evaluate
statistical differences among clusters concerning the
age variable that do not follow a normal distribution.
A
p −value = 1.3E − 0.3
and
p −value = 1.2E − 0.3
show statistical evidence that a difference among
groups exists both at baseline and at the final visit.
After a pairwise comparison with post hoc Dunn’s test,
we can only assess that individuals in Cluster 1 and
Cluster 2 are statistically older than individuals in Clus-
ter 3 (
p−value = 0.03
and
p−value = 0.002
). No sta-
tistical evidence is found among other clusters. A sig-
nificant difference is highlighted for the MMSE score
at baseline and final visit (
p − value = 5.6E −03
and
p − value = 2.0E − 02
). However, post hoc Dunn’s
test reveals that MMSE at the baseline is significantly
different from Cluster 1 and Cluster 2 with respect to
Cluster 4 (
p − value = 0.02
and
p − value = 0.048
).
Conversely, MMSE at the last visit significantly dif-
fered between Cluster 1 and Cluster 4. Moreover, clus-
ters significantly differ in CDR, and pairwise compari-
son shows a difference between Cluster 1 and Cluster
2, Cluster 3 and Cluster 4. Although the thyroid trajec-
tory shows an increment of the thyroid symptoms at
the last follow-up visit of AD subjects, statistical anal-
ysis reveals that such a difference is not statistically
significant. Finally, all the domains of NPI show a sta-
tistical difference among clusters. However, a post hoc
Chi-squared test shows there is no statistical difference
in depression symptoms between Cluster 1 and Clus-
ter 3, as it can be noted from Figure 2 the DEP2YRS
and DEPD overlap. The same occurs between Cluster
2 and Cluster 4.
4 CONCLUSIONS
Applying the K-mean-based longitudinal clustering for
multivariate time series has shown promising results in
grouping the population with respect to the progression
of cognitive decline considering the OASIS-3 dataset.
Interesting insights also came from the analysis of the
longitudinal clusters with respect to the most relevant
features. Our approach confirms the literature’s find-
ings (Qiu et al., 2022; Kim et al., 2021; Roberto et al.,
2021) that both neuropsychiatric symptoms are among
the relevant features associated with cognitive decline,
as well as thyroid dysfunction is associated with an
increased risk of cognitive impairment (Figueroa et al.,
2021). These findings are encouraging in detecting
possible risk factors. In addition, our approach pro-
Longitudinal Analysis of Disease Progression in the Elderly: An Approach to Mitigate the Burden of Frailty, Functional and Cognitive
Decline
1087

Table 1: Baseline characteristics of participants.
Features Cluster 1 Cluster 2 Cluster 3 Cluster 4 p-value
(N=124) (N=7) (N=29) (N=5)
Age (years) 1.3E-03†
mean (SD) 72.7 ± 6.5 76 ± 5.4 65 ± 8.5 69.8 ± 2.6
[min, max] [59, 90] [66,87 ] [50, 76 ] [68, 74 ]
MMSE 5.6E-03†
mean (SD) 29.0 ± 1.3 28.0 ± 2.5 29.0 ± 1.8 26.8 ± 1.3
[min, max] [23, 30] [19, 30] [25, 30] [25, 28]
CDR 4.6E-14†
mean (SD) 0.05 ± 0.15 0.36 ± 0.26 0.43 ± 0.35 0.5 ± 0
[min, max] [0, 0.5] [0, 1] [0.5, 0.5]
GDS 5.6E-03†
mean (SD) 1.2 ± 1.5 1.1 ± 0.7 1.8 ± 1.6 5.8 ± 2.9
[min, max] [0, 6] [0, 2] [0, 5] [4,10]
THYROID 8E-01‡
Yes 95 (76.6%) 6 (85.7%) 26 (89.7%) 4 (80%)
No 26 (21%) 1 (14.3%) 3 (10.3%) 1 (20%)
Unknown 3 (2.4%) 0 (0%) 0 (0%) 0 (0%)
DEP2YRS 1.1E-07‡
Yes 103 (83.7%) 0 (0%) 21 (72.4%) 1 (20%)
No 20 (16.3%) 7 (100%) 8 (27.6%) 4 (80%)
AGIT 7.13E-18‡
Yes 119 (96%) 0 (0%) 11 (37.9%) 3 (60%)
No 5 (4%) 7(100%) 18 (62.1%) 2 (40%)
DEPD 8.1E-09‡
Yes 113 (91.1%) 3 (42.9%) 21 (72.4%) 0 (0%)
No 11 (8.9%) 4 (57.1%) 8 (27.5%) 5 (100%)
ANX 3.7E-06‡
Yes 121 (97.6%) 5 (71.4%) 20 (69%) 4 (80%)
No 3 (2.4%) 2 (28.6%) 9 (31%) 1 (20%)
DISN 3.7E-06‡
Yes 122 (98.4%) 4 (57.1%) 23 (79.3%) 4 (80%)
No 2 (1.6%) 3 (42.9%) 6 (20.7%) 1 (20%)
IRR 9.5E-17‡
Yes 115 (92.7%) 0 (0%) 9 (31%) 2 (40%)
No 9 (7.3%) 7 (100%) 20 (69%) 3 (60%)
† Kruskal-Wallis H test, ‡CHI-Square test
vides insights about longitudinal profiles of these fea-
tures for stable and progressing individuals supported
by also statistical analysis. The early detection of
risk factors may contribute to setting targeted inter-
ventions before the disease manifests, thus improving
the elderly’s quality of life and also decreasing public
healthcare costs. However, several further analyses
should be performed to assess the generality of the
results. Different numbers of clusters could be investi-
gated, and the obtained results should be interpreted
and validated by a domain expert. The adoption of a
single dataset limits the generalization of the obtained
findings, so additional experiments are required.
Conflict of Interest
The authors declare they have no conflict of interest.
Funding
This study work was funded by the European Union
– Next Generation EU programme, in the context of
The National Recovery and Resilience Plan, Invest-
ment Partenariato Esteso PE8 “Conseguenze e sfide
dell’invecchiamento”, Project Age-It (Ageing Well in
an Ageing Society). This work was also partially sup-
ported by Ministero dell’Universit
`
a e della Ricerca
of Italy under the “Dipartimenti di Eccellenza 2023-
Scale-IT-up 2025 - Workshop on Scaling Up Care for Older Adults
1088

Table 2: Characteristics of participants at the last visit.
Features Cluster 1 Cluster 2 Cluster 3 Cluster 4 p-value
(N=124) (N=7) (N=29) (N=5)
Age (years) 1.2E-03†
mean (SD) 76.7 ± 6.5 80 ± 5.4 69 ± 8.5 73.8 ± 2.6
[min, max] [63, 94] [70,91 ] [54, 80 ] [72, 78 ]
MMSE 2E-02†
mean (SD) 28.7.0 ± 2.1 27.5 ± 4.2 28.6 ± 1.5 18.8 ± 6.9
[min, max] [16, 30] [12, 30] [26, 30] [11, 26]
CDR 3.4E-08†
mean (SD) 0.1 ± 0.3 0.36 ± 0.44 0.5 ± 0.28 1.2 ± 0.58
[min, max] [0, 2] [0, 2] [0, 1] [1, 2]
GDS 5.6E-03†
mean (SD) 1.4 ± 1.7 1.7 ± 1.8 1.9 ± 2.1 3.3 ± 3
[min, max] [0, 7] [0, 5] [0, 8] [0,7]
THYROID 4.3E-01‡
Yes 91 (73.4%) 5 (71.4%) 25 (86.2%) 3 (60%)
No 28 (22.6%) 2 (28.6%) 3 (10.3%) 1 (20%)
Unknown 5 (4%) 0 (0%) 1 (3.5%) 1 (20%)
DEP2YRS 1.1E-04‡
Yes 97 (78.2%) 1 (14.3%) 19 (67.9%) 1 (20%)
No 27 (21.8%) 6 (85.7%) 9 (32.1%) 4 (80%)
AGIT 3.8E-15‡
Yes 120 (96.7%) 0 (0%) 24 (82.8%) 3 (60%)
No 4 (3.3%) 7(100%) 5 (17.2%) 2 (40%)
DEPD 4.1E-04‡
Yes 114 (91.9%) 3 (42.9%) 27 (93.1%) 4(80%)
No 10 (8.1%) 4 (57.1%) 2 (6.9%) 1 (20%)
ANX 1.8E-07‡
Yes 120 (96.7%) 3 (42.9%) 22 (75.9%) 3 (60%)
No 4 (3.3%) 4 (57.1%) 7 (24.1%) 2 (40%)
DISN 2.7E-16‡
Yes 122 (98.4%) 2 (28.6%) 28 (96.6%) 2 (40%)
No 2 (1.6%) 5 (71.4%) 1 (3.4%) 3 (60%)
IRR 9.5E-17‡
Yes 117 (94.4%) 2 (28.6%) 15 (51.7%) 3 (60%)
No 7 (5.6%) 5 (71.4%) 14 (48.3%) 2 (40%)
† Kruskal-Wallis H test, ‡CHI-Square test
2027” ReGAInS grant assigned to Dipartimento di
Informatica Sistemistica e Comunicazione at Univer-
sit
`
a di Milano-Bicocca. The funders had no role in
study design, data collection and analysis, decision to
publish, or manuscript preparation.
Availability of Data and Software Code
Unfortunately, due to OASIS-3’s data policy, we are
not authorized to release the OASIS-3 dataset and the
software code we employed in this study. The access
to this dataset can be requested at: https://sites.wustl.
edu/oasisbrains/home/access/
REFERENCES
Balkus, S. V., Fang, H., and Wang, H. (2022). Federated
fuzzy clustering for longitudinal health data. In Pro-
ceedings of CHASE 2022 – the 2022 IEEE/ACM Con-
ference on Connected Health: Applications, Systems
and Engineering Technologies, pages 128–132.
Bar-Joseph, Z., Gerber, G., Gifford, D. K., Jaakkola, T. S.,
and Simon, I. (2002). A new approach to analyzing
gene expression time series data. In Proceedings of the
Sixth Annual International Conference on Computa-
tional Biology, RECOMB ’02, page 39–48, New York,
NY, USA. Association for Computing Machinery.
Besser, L., Kukull, W., Knopman, D. S., Chui, H., Galasko,
Longitudinal Analysis of Disease Progression in the Elderly: An Approach to Mitigate the Burden of Frailty, Functional and Cognitive
Decline
1089

D., Weintraub, S., Jicha, G., Carlsson, C., Burns, J.,
Quinn, J., Sweet, R. A., Rascovsky, K., Teylan, M.,
Beekly, D., Thomas, G., Bollenbeck, M., Monsell, S.,
Mock, C., Zhou, X. H., Thomas, N., Robichaud, E.,
Dean, M., Hubbard, J., Jacka, M., Schwabe-Fry, K.,
Wu, J., Phelps, C., and Morris, J. C. (2018). Version
3 of the National Alzheimer’s Coordinating Center’s
uniform data set. Alzheimer Disease & Associated
Disorders, 32(4):351–358.
Better, M. A. (2023). Alzheimer’s disease facts and figures.
Alzheimers Dement, 19(4):1598–1695.
Cummings, J. L. (1997). The neuropsychiatric inventory:
assessing psychopathology in dementia patients. Neu-
rology, 48(5 suppl 6):10S–16S.
Cuturi, M. and Blondel, M. (2017). Soft-DTW: a differen-
tiable loss function for time-series. In International
Conference on Machine Learning, pages 894–903.
PMLR.
De la Cruz-Mes
´
ıa, R., Quintana, F. A., and Marshall, G.
(2008). Model-based clustering for longitudinal data.
Computational Statistics & Data Analysis, 52(3):1441–
1457.
Escudero, J., Zajicek, J. P., and Ifeachor, E. (2011). Early
detection and characterization of alzheimer’s disease
in clinical scenarios using bioprofile concepts and k-
means. In 2011 Annual International Conference of
the IEEE Engineering in Medicine and Biology Society,
pages 6470–6473. IEEE.
Feng, Z., Niu, Z., Huang, J., Tang, W., and Wu, Q. (2018). A
novel load clustering method based on entropy features
considering longitudinal characteristics. In Proceed-
ings of PESGM 2018 – the 2018 IEEE Power & Energy
Society General Meeting, pages 1–5.
Figueroa, P. B. S., Ferreira, A. F. F., Britto, L. R., Doussoulin,
A. P., and Torrao, A. d. S. (2021). Association between
thyroid function and Alzheimer’s disease: a systematic
review. Metabolic Brain Disease, 36(7):1523–1543.
Folstein, M. F., Folstein, S. E., and McHugh, P. R. (1975).
“Mini-Mental State”: a practical method for grading
the cognitive state of patients for the clinician. Journal
of Psychiatric Research, 12(3):189–198.
Holilah, D., Bustamam, A., and Sarwinda, D. (2021). Detec-
tion of alzheimer’s disease with segmentation approach
using k-means clustering and watershed method of mri
image. In Journal of Physics: Conference Series, vol-
ume 1725, page 012009. IOP Publishing.
Kim, D., Wang, R., Kiss, A., Bronskill, S. E., Lanctot, K. L.,
Herrmann, N., and Gallagher, D. (2021). Depression
and increased risk of alzheimer’s dementia: longitu-
dinal analyses of modifiable risk and sex-related fac-
tors. The American Journal of Geriatric Psychiatry,
29(9):917–926.
Kruskal, W. H. and Wallis, W. A. (1952). Use of ranks in one-
criterion variance analysis. Journal of the American
statistical Association, 47(260):583–621.
LaMontagne, P. J., Benzinger, T. L., Morris, J. C., Keefe,
S., Hornbeck, R., Xiong, C., Grant, E., Hassenstab,
J., Moulder, K., Vlassenko, A. G., Raichle, M. E.,
Cruchaga, C., and Marcus, D. (2019). OASIS-3: lon-
gitudinal neuroimaging, clinical, and cognitive dataset
for normal aging and Alzheimer disease. medRxiv,
(2019-12):1–37.
Lee, J.-G., Han, J., and Whang, K.-Y. (2007). Trajectory
clustering: a partition-and-group framework. In Pro-
ceedings of the 2007 ACM SIGMOD International Con-
ference on Management of Data, SIGMOD ’07, page
593–604, New York, NY, USA. Association for Com-
puting Machinery.
MacQueen, J. (1967). Some methods for classification and
analysis of multivariate observations.
Manly, J. J., Tang, M.-X., Schupf, N., Stern, Y., Vonsat-
tel, J.-P. G., and Mayeux, R. (2008). Frequency and
course of mild cognitive impairment in a multiethnic
community. Annals of Neurology: Official Journal of
the American Neurological Association and the Child
Neurology Society, 63(4):494–506.
Morris, J. C. (1997). Clinical dementia rating: a reliable
and valid diagnostic and staging measure for dementia
of the alzheimer type. International Psychogeriatrics,
9(S1):173–176.
Overton, M., Pihlsg
˚
ard, M., and Elmst
˚
ahl, S. (2020). Di-
agnostic stability of mild cognitive impairment, and
predictors of reversion to normal cognitive functioning.
Dementia and Geriatric Cognitive Disorders, 48(5-
6):317–329.
Pearson, K. (1900). X. on the criterion that a given system of
deviations from the probable in the case of a correlated
system of variables is such that it can be reasonably
supposed to have arisen from random sampling. The
London, Edinburgh, and Dublin Philosophical Maga-
zine and Journal of Science, 50(302):157–175.
Putri, W., Hastari, D., Faizah, K. U., Rohimah, S., and Safira,
D. (2023). Implementation of na
¨
ıve bayes classifier for
classifying alzheimer’s disease using the k-means clus-
tering data sharing technique. Public Research Journal
of Engineering, Data Technology and Computer Sci-
ence, 1(1):47–54.
Qin, Y., Han, H., Li, Y., Cui, J., Jia, H., Ge, X., Ma, Y., Bai,
W., Zhang, R., Chen, D., Yi, F., and Yu, H. (2023).
Estimating bidirectional transitions and identifying
predictors of mild cognitive impairment. Neurology,
100(3):e297–e307.
Qiu, J., Goldstein, F. C., and Hanfelt, J. J. (2022). An ex-
ploration of subgroups of neuropsychiatric symptoms
in mild cognitive impairment and their risks of conver-
sion to dementia or death. The American Journal of
Geriatric Psychiatry, 30(8):925–934.
Reitz, C., Brayne, C., and Mayeux, R. (2011). Epidemiol-
ogy of alzheimer disease. Nature Reviews Neurology,
7(3):137–152.
Ribino, P., Di Napoli, C., Paragliola, G., Serino, L., Gas-
parini, F., and Chicco, D. (2023). Exploratory analysis
of longitudinal data of patients with dementia through
unsupervised techniques. In CEUR Workshop Pro-
ceedings of AIxAS 2023 – the 4th Italian Workshop
on Artificial Intelligence for an Ageing Society, 6-9
November 2023, Rome, Italy, volume 3623, page 67 –
87.
Ribino, P., Paragliola, G., Di Napoli, C., Mannone, M.,
Gasparini, F., and Chicco, D. (2024). Clustering of
Scale-IT-up 2025 - Workshop on Scaling Up Care for Older Adults
1090

longitudinal clinical dementia rating data to identify
predictors of alzheimer’s disease progression. In Pro-
cedia Computer Science, volume 251, pages 326–333.
Elsevier.
Roberto, N., Portella, M. J., Marqui
´
e, M., Alegret, M.,
Hern
´
andez, I., Maule
´
on, A., Rosende-Roca, M., Ab-
delnour, C., Esteban de Antonio, E., Tartari, J. P., et al.
(2021). Neuropsychiatric profile as a predictor of cog-
nitive decline in mild cognitive impairment. Frontiers
in Aging Neuroscience, 13:718949.
Sperling, R. A., Aisen, P. S., Beckett, L. A., Bennett, D. A.,
Craft, S., Fagan, A. M., Iwatsubo, T., Jack, Jr, C. R.,
Kaye, J., Montine, T. J., Park, D. C., Reiman, E. M.,
Rowe, C. C., Siemers, E., Stern, Y., Yaffe, K., Car-
rillo, M. C., Thies, B., Morrison-Bogorad, M., Wag-
ster, M. V., and Phelps, C. H. (2011). Toward defin-
ing the preclinical stages of Alzheimer’s disease: rec-
ommendations from the National Institute on Aging-
Alzheimer’s Association workgroups on diagnostic
guidelines for Alzheimer’s disease. Alzheimer’s &
Dementia, 7(3):280–292.
Sun, Y., Fang, L., and Wang, P. (2016). Improved k-means
clustering based on efros distance for longitudinal data.
In Proceedings of CCDC 2016 – the 2016 Chinese
Control and Decision Conference, pages 3853–3856.
Tavenard, R., Faouzi, J., Vandewiele, G., Divo, F., Androz,
G., Holtz, C., Payne, M., Yurchak, R., Rußwurm, M.,
Kolar, K., and Woods, E. (2020). Tslearn, a machine
learning toolkit for time series data. Journal of Ma-
chine Learning Research, 21(118):1–6.
Tseng, H. and Lin, C. (2007). A simulated annealing ap-
proach for curve fitting in automated manufacturing
systems. Journal of Manufacturing Technology Man-
agement, 18(2):202–216.
Warren Liao, T. (2005). Clustering of time series data—a
survey. Pattern Recognition, 38(11):1857–1874.
Longitudinal Analysis of Disease Progression in the Elderly: An Approach to Mitigate the Burden of Frailty, Functional and Cognitive
Decline
1091
