
Intraoperative Electrocorticography Signal Synthesis to Improve the
Classification of Epileptiform Tissue
Leonor Almeida
1,∗ a
, Sem Hoogteijling
2,3,∗ b
, In
ˆ
es Silveira
1 c
, Dania Furk
1 d
, Irene Heijink
2,3 e
,
Maryse van’t Klooster
2 f
, Hugo Gamboa
1 g
, Lu
´
ıs Silva
1 h
and Maeike Zijlmans
2,3 i
1
Laborat
´
orio de Instrumentac¸
˜
ao, Engenharia Biom
´
edica e F
´
ısica da Radiac¸
˜
ao (LIBPhys-UNL), Departamento de F
´
ısica,
Faculdade de Ci
ˆ
encias e Tecnologia, FCT, Universidade Nova de Lisboa, 2829-516 Caparica, Portugal
2
Department of Neurology and Neurosurgery, Brain Center, University Medical Center Utrecht, Part of ERN EpiCARE,
P.O. box 85500, 3508 GA Utrecht, The Netherlands
3
Stichting Epilepsie Instellingen Nederland (SEIN), The Netherlands
Keywords:
Synthetic Data, Epilepsy, Epileptiform Activity, Epileptogenic Tissue, ioECoG, GAN.
Abstract:
Epilepsy surgery is a viable option for treating drug-resistant cases where anti-seizure medications fail, but
accurately localizing epileptic tissue remains challenging. This process can be guided by the visual assess-
ment of intraoperative electrocorticography (ioECoG). Data scarcity limits developing machine learning (ML)
models for automatic epileptic tissue classification. To address this, we propose a generative model based
on Generative Adversarial Networks (GANs) to synthesize realistic ioECoG signals. Our approach identified
three distinct ioECoG patterns using Agglomerative Clustering, which guided training individual Deep Convo-
lutional Wasserstein GANs with Gradient Penalty (DCwGAN-GP). Synthetic data (SD) was evaluated across
multiple dimensions: fidelity using temporal (e.g., Wasserstein distance (WD)), frequency and time-frequency
metrics; diversity through dimensionality reduction; and utility by comparing ML performance with and with-
out SD. It replicated temporal and frequency characteristics of real signals (fidelity), though lacked variability
(diversity) due to potential data misclassifications. Specifically, the WD between real and synthetic signals
outperformed literature benchmarks (i.e., 0.043 ± 0.025 vs. 0.078). Classifiers trained on a combination of
real and SD achieved 88% accuracy, compared to 85% with real data alone. These results demonstrate the po-
tential of SD to replicate real signals, address data scarcity, augment ioECoG datasets, and advance ML-based
epilepsy surgery research.
1 INTRODUCTION
Epilepsy is a central nervous system disorder (Shoka
et al., 2023) characterized by abnormal brain activ-
ity, affecting approximately 50 million people glob-
ally (WHO, 2019). While anti-seizure medication
is the first line of treatment (Consales et al., 2021),
about a third of patients have drug-resistant epilepsy
a
https://orcid.org/0009-0003-1185-9750
b
https://orcid.org/0000-0002-4455-6700
c
https://orcid.org/0000-0003-0675-3444
d
https://orcid.org/0009-0008-7139-8665
e
https://orcid.org/0009-0005-9266-1168
f
https://orcid.org/0000-0002-6594-8965
g
https://orcid.org/0000-0002-4022-7424
h
https://orcid.org/0000-0001-9811-0571
i
https://orcid.org/0000-0003-1258-5678
∗
These authors contributed equally to this work.
and do not achieve seizure control through this pro-
cedure (Duncan and Taylor, 2023). For these peo-
ple, epilepsy surgery offers a viable solution, poten-
tially curing seizures and improving their quality of
life (Consales et al., 2021). The surgery procedure
involves the removal of the epileptogenic tissue, that
is, the brain tissue responsible for triggering seizures
(Zijlmans et al., 2019). To localize epileptic tis-
sue, pathological electrographic activity in the intra-
operative electrocorticogram (ioECoG) can be used,
including spikes, sharp waves and ictiform spike pat-
terns or the more recently discovered high frequency
oscillations (HFOs) (Fern
´
andez and Loddenkemper,
2013) (Greiner et al., 2016) (Wang et al., 2024)
(Zweiphenning et al., 2022). This method involves
placing electrodes directly on surgically exposed cor-
tex to precisely map the tissue to be removed (Tatum,
2021). However, differentiating epileptiform activ-
Almeida, L., Hoogteijling, S., Silveira, I., Furk, D., Heijink, I., Klooster, M. V., Gamboa, H., Silva, L. and Zijlmans, M.
Intraoperative Electrocorticography Signal Synthesis to Improve the Classification of Epileptiform Tissue.
DOI: 10.5220/0013398500003911
Paper published under CC license (CC BY-NC-ND 4.0)
In Proceedings of the 18th International Joint Conference on Biomedical Engineer ing Systems and Technologies (BIOSTEC 2025) - Volume 1, pages 1141-1153
ISBN: 978-989-758-731-3; ISSN: 2184-4305
Proceedings Copyright © 2025 by SCITEPRESS – Science and Technology Publications, Lda.
1141

ity from normal ioECoG patterns remains a challenge
(Zweiphenning et al., 2022). Clinicians often rely
on visual interpretation, which is prone to human er-
rors and can miss critical information (Li et al., 2020)
(Saminu et al., 2022). Also, the typically visible
pathological interictal EEG activity may not be opti-
mally predicting the diseased tissue: epileptic spikes
are seen over a broader area than just the seizure on-
set zone and epileptic HFOs can be difficult to discern
from artefacts and physiological HFOs. This high-
lights the need for more reliable ways to distinguish
epileptic and non-epileptic tissue.
Recent research shows promise in using ML for
automatic detection of interictal epileptiform dis-
charges in intracranial EEG (iEEG) signals (Saminu
et al., 2022) by efficiently identifying epilepsy
biomarkers such as spikes, improving diagnostic ac-
curacy and assist in epilepsy surgery (Chaibi et al.,
2024). A step further is to use ML not to detect
short epileptiform events but also background activ-
ity that differs between epileptic and non-epileptic tis-
sue (Hoogteijling et al., 2024). Data scarcity limits
the effectiveness of ML models, which require large
datasets to accurately distinguish epileptiform pat-
terns (Du et al., 2024a). To overcome this, the gener-
ation of SD (SD) for medical applications has gained
importance not only for augmenting training datasets
and therefore improving the performance of ML mod-
els in EEG based tasks, but also for addressing pa-
tient privacy concerns (Pascual et al., 2021) (Aznan
et al., 2019) (Park et al., 2024) (Carrle et al., 2023)
(Wu et al., 2024) (Fang et al., 2024) (Nia et al., 2024).
Common data augmentation methods include
GANs, Variational Auto-Enconders and Diffusion
Models (Liang et al., 2023). While GANs have made
significant strides in SD generation, their application
in the medical domain, particularly for EEG data, re-
mains challenging due to its high variability, which
leads to issues such as mode collapse, complex train-
ing dynamics, and instability (Habashi et al., 2023),
(Liang et al., 2023). Nevertheless, GANs remains the
leading method for SD generation (Liang et al., 2023)
(Carrle et al., 2023) (Fan et al., 2024) (Habashi et al.,
2023). Over the past decade, several GAN archi-
tectures have emerged to address earlier limitations.
Conditional GAN (cGAN), introduced in 2014 (Mirza
and Osindero, 2014), has been effective in enhancing
training stability and reducing mode collapse (Panwar
et al., 2020). (Pascual et al., 2021) utilized cGAN
for synthesizing 4-second EEG signals, while (Car-
rle et al., 2023) applied it for depression diagnosis,
demonstrating the utility of cGANs in generating tar-
geted SD for specific clinical applications. Similarly,
(Aznan et al., 2019) used Deep Convolutional GANs
(DCGAN) to generate 3-second dry-EEG signals for
a Steady State Visually Evoked Potential task. Other
variations, such as Wasserstein GANs with Gradient
Penalty (wGAN-GP), offer even more stable gradi-
ents and robust training, resulting in higher-quality
SD (Fang et al., 2024) (Nia et al., 2024). Recent ad-
vancements have integrated Long Short Term Mem-
ory (LSTM) layers (Du et al., 2024b) or U-Net gener-
ators (Pascual et al., 2019) (Pan et al., 2023) to better
capture time-series characteristics. Auxiliary decod-
ing techniques, such as those used by (Liang et al.,
2023) and (Aznan et al., 2020) further improve sig-
nal quality by classifying input data alongside distin-
guishing real from SD.
(Hartmann et al., 2018) pioneered EEG sig-
nal synthesis with EEG-GAN, using an improved
wGAN-GP for generating single-channel signals.
This framework utilized convolutional layers for up-
sampling and downsampling, and was evaluated us-
ing Fr
´
echet Inception Distance, Inception Score, and
sliced Wasserstein Distance (WD) (Xu et al., 2022)
compared different GAN variants, finding that DCw-
GAN performed best for generating multichannel
EEG data. In recent work, (Wu et al., 2024) intro-
duced a conditional transformer-based wGAN-GP for
synthesizing stereoelectroencephalography (SEEG)
epileptic signals. This approach leveraged trans-
formers to capture time dependencies, with eval-
uation through t-SNE, Cosine Similarity, Jensen-
Shannon Distance, and classifier performance, with
results outperforming traditional augmentation meth-
ods. Similarly, (Du et al., 2024a) proposed a
Deep Convolutional Wasserstein GAN with Gradient-
Penalty (DCwGAN-GP) to generate time-frequency
representations, improving classification performance
when combined with real data (RD). Finally, (Cook
et al., 2024) presented an architecture for generating
EEG signals to predict brain age, comparing cGAN,
wGAN, and wGAN-GP models. These were evalu-
ated through the Kolmogorov-Smirnov test and clas-
sifier performance, with all models showing improve-
ment when combined SD with RD.
This study aimed to develop a generative model
using GANs to produce synthetic ioECoG data that
captures both epileptic and non-epileptic characteris-
tics. To achieve this, we performed a clustering anal-
ysis on the original dataset to identify distinct data
patterns, which were subsequently processed using
the DCwGAN-GP generative model. The resulting
synthetic signals were evaluated for fidelity, diver-
sity, and utility, ensuring comprehensive assessment
across these domains.
The document is structured as follows: Section
2 details the methods, including data handling, gen-
SyntBioGen 2025 - Special Session on Synthetic biosignals generation for clinical applications
1142

erative process, and evaluation metrics. Section 3
presents the results, followed by their discussion in
Section 4. Finally, Section 5 summarizes the conclu-
sions and proposes future work.
2 METHOD
2.1 Sample
As part of the Synthetic and Scalable Data Platform
for Medical Empowered AI (AISym4Med) project,
conducted in collaboration with the Utrecht Medical
Center (UMCU), this study analyzed data from 18 pa-
tients who underwent intraoperative electrocorticog-
raphy (ioECoG)-guided epilepsy surgery at UMCU,
Netherlands, from 2008 onward. Specifically, only
pre-resection data were utilized in this analysis.
2.1.1 Participants
The ioECoG data, sourced from the UMCU-SEIN
RESPect database, is stored in a Brain Imaging Data
Structure (BIDS) format (Demuru et al., 2022), with
all patients providing informed consent. Included pa-
tients had ioECoG sampled at 2048 Hz, electrode
placement photos, and were at least 1-year post-
surgical seizure free (Engel 1A). Exclusion criteria in-
cluded prior brain surgery, multiple epileptic foci, or
surgeries involving an amygdala-hippocampectomy.
2.1.2 Procedure
During surgery, the ioECoG was recorded using elec-
trode grids or strips with 1 cm interelectrode dis-
tance. Recordings were made while propofol anes-
thesia was paused to prevent suppression of epilep-
tiform activity (Sun et al., 2024). The ioECoG en-
abled the identification of epileptiform patterns in real
time, assisting neurosurgeons by tailoring the extent
of the resection. More details about the data col-
lection can be found in (Hoogteijling et al., 2024).
The pipeline of this study starts with processing and
analysing the raw ioECoG. The signals were clustered
into different groups based on specific data patterns.
Each cluster is then fed into its own generative model,
producing SD that aligns with the structure defined
during the clustering stage.
2.2 Signal Processing and Analysis
To preserve the statistical integrity of the ioECoG
signals for authentic data generation, they were only
trimmed and filtered, following the recommendations
of (Delorme, 2023). The signals were shortened at
their midpoint, reducing the average length from 360
to 60 seconds, matching the duration used by (van
Klink et al., 2014). A 4th-order Butterworth filter
was applied (Rasheed and Miften, 2023) (Wu et al.,
2024) with a 0.16 Hz low-cut to remove drift arti-
facts (Miller, 2019) and a 512 Hz high-cut to re-
tain high-frequency oscillations (HFOs) (Zweiphen-
ning et al., 2022). Additionally, an Infinite Impulse
Response Notch filter at 50 Hz intervals was used
to eliminate powerline noise. Subsequently, an in-
depth analysis of both the time and frequency do-
mains was performed. Given that the patients were
under anesthesia, it was anticipated that specific fre-
quency bands, particularly the delta and alpha bands,
would exhibit increased power compared to other fre-
quency band(Shin et al., 2020). Accordingly, the rel-
ative power of each frequency band, as well as the
dominant frequency, were systematically examined.
2.3 Clustering
An unsupervised clustering analysis was performed
to group signals into distinct clusters based on their
intrinsic characteristics. This data-driven approach
facilitated a deeper understanding of the variability
within the dataset and enabled the design of a more
tailored generative process. By associating specific
labels with individual generative models, this method
improved the precision and diversity of SD genera-
tion.
2.3.1 Feature Extraction
For the clustering analysis, 33 features were ex-
tracted using the TSFEL (v0.1.7) (Barandas et al.,
2020), Numpy (v1.26.4) (Harris et al., 2020), and
Scipy (v1.13.0) (Virtanen et al., 2020) libraries, cov-
ering temporal, frequency, time-frequency, and non-
linear domains. Temporal features followed meth-
ods from (Rasheed and Miften, 2023) and (Du et al.,
2024c), known for clustering epileptic EEG signals.
Time-frequency features were based on (Chaibi et al.,
2024), while frequency and non-linear features were
computed specifically for this study, some including:
Relative Band Power, Dominant Frequency, Hurst
Exponent and Autocorrelation.
Following feature extraction, the features were
standardized using the StandardScaler from Scikit-
Learn (v1.4.1.post1) (Pedregosa et al., 2018) and fea-
tures with a correlation above 95% were removed to
reduce redundancy (Zhou et al., 2022). To identify
key features, the signals were categorized as resected
and non-resected according to the clinicians’ labels,
Intraoperative Electrocorticography Signal Synthesis to Improve the Classification of Epileptiform Tissue
1143

and the mean values of each feature were compared
between the groups.
2.3.2 Cluster Analysis
To determine the appropriate number of clusters for
the clustering algorithm, the Elbow method and Sil-
houette analysis were applied. After selecting the
most discriminative features and determining the opti-
mal number of clusters, the Agglomerative Clustering
algorithm from Scikit-Learn (Pedregosa et al., 2018)
with the Ward’s method (Kononenko and Kukar,
2007) was used to classify the signals into distinct
patterns. The clusters were then labelled based on
the signal characteristics and their alignment with the
clinician labels (i.e., resected and non-resected).
2.4 Generative Model
This section describes the proposed generative model,
DCwGAN-GP, covering the input data, architecture,
parameters, and training process. The model was de-
veloped using Pytorch (v2.3.1) (Paszke et al., 2019)
and an NVIDIA RTX 6000 Ada GPU (NVIDIA Cor-
poration, 2024). To generate SD for each cluster,
a separate generative model was created per cluster,
following the same architecture and training process,
with only the batch size differing for the final cluster.
2.4.1 Data Preparation
After initial processing, the clustered ioECoG signals
were further prepared for the generative model. This
involved segmenting the 60-second signals into 20-
second windows and downsampling them to 512 Hz
for computational efficiency. The signals were then
normalized and transformed into tensors as input for
the model.
2.4.2 Model Architecture
The model architecture, shown in Figure 1, uses 1D
CNNs for both the Generator and Critic, trained with
a Wasserstein Distance loss and Gradient Penalty.
While CNNs are typically utilized for image gen-
eration, 1D CNNs are stated to effectively capture
patterns in one-dimensional EEG data (Aznan et al.,
2019). The Generator processes a latent vector Z of
size 100 through a series of 1D Transposed Convolu-
tional Layers, configured with a kernel size of 4, stride
of 2, and padding of 1 to upsample the input (Aznan
et al., 2019). Batch normalization and ReLU activa-
tion are applied between layers. A Tanh activation
is used in the final layer to generate synthetic sam-
ples, G(z). The Critic processes both real and syn-
thetic samples using 1D Convolutional Layers with
the same configuration of kernel size 4, stride 2, and
padding 1. It uses Spectral Normalization for stability
(Zhong et al., 2023) and Leaky ReLU activation with
alpha 0.2 (Park et al., 2024), except in the final block.
The Critic outputs a score distinguishing real from
synthetic samples, with the loss back-propagating to
improve both networks.
2.4.3 Model Training and Tuning
The training process for the DCwGAN-GP ran for a
set number of epochs, processing batches of RD in
each iteration. The Critic was trained five times for
each Generator update, where each Critic update be-
gan with zeroing its gradients to prevent accumula-
tion. The Critic then computed scores for both real
C(x) and SD C(G(z)), applying the gradient penalty,
calculated as equation 1 (Shu et al., 2023):
GP = λE
x∼p
data
(x)
h
(∥∇C( ˆx)∥
2
− 1)
2
i
(1)
The Critic’s loss was then calculated using equa-
tion 2 (Shu et al., 2023):
L = E
x∼p
g
[C(G(z))] − E
x∼p
data
(x)
[C(x)] + GP (2)
This loss aimed to maximize the difference be-
tween scores for real and SD while penalizing large
gradients. The loss was backpropagated, and the
Critic’s parameters were updated using the Adam op-
timizer. For the Generator, its gradients were zeroed,
and a new batch of SD G(z) was generated using the
latent tensor Z. The Critic evaluated this SD, produc-
ing a score C(G(z)). The generator’s loss is then cal-
culated as 3 (Shu et al., 2023):
loss
G
= −E[C(G(z))] (3)
The loss was backpropagated, and the Generator’s
parameters were updated using the Adam optimizer.
At the end of each epoch, learning rate schedulers ad-
justed the learning rates for both models to optimize
training progression. Following training, the model
underwent hyperparameter tuning over 51 iterations
to achieve optimal performance. The final version
included six layers in the Generator and five in the
Critic. The training parameters are detailed in Table
1. The batch size was set to 40, with exception on the
final model, which was reduced to 30.
2.5 Evaluation Metrics
This section outlines the evaluation metrics used to
assess the quality of the generated ioECoG signals,
categorized into fidelity, diversity and utility.
SyntBioGen 2025 - Special Session on Synthetic biosignals generation for clinical applications
1144
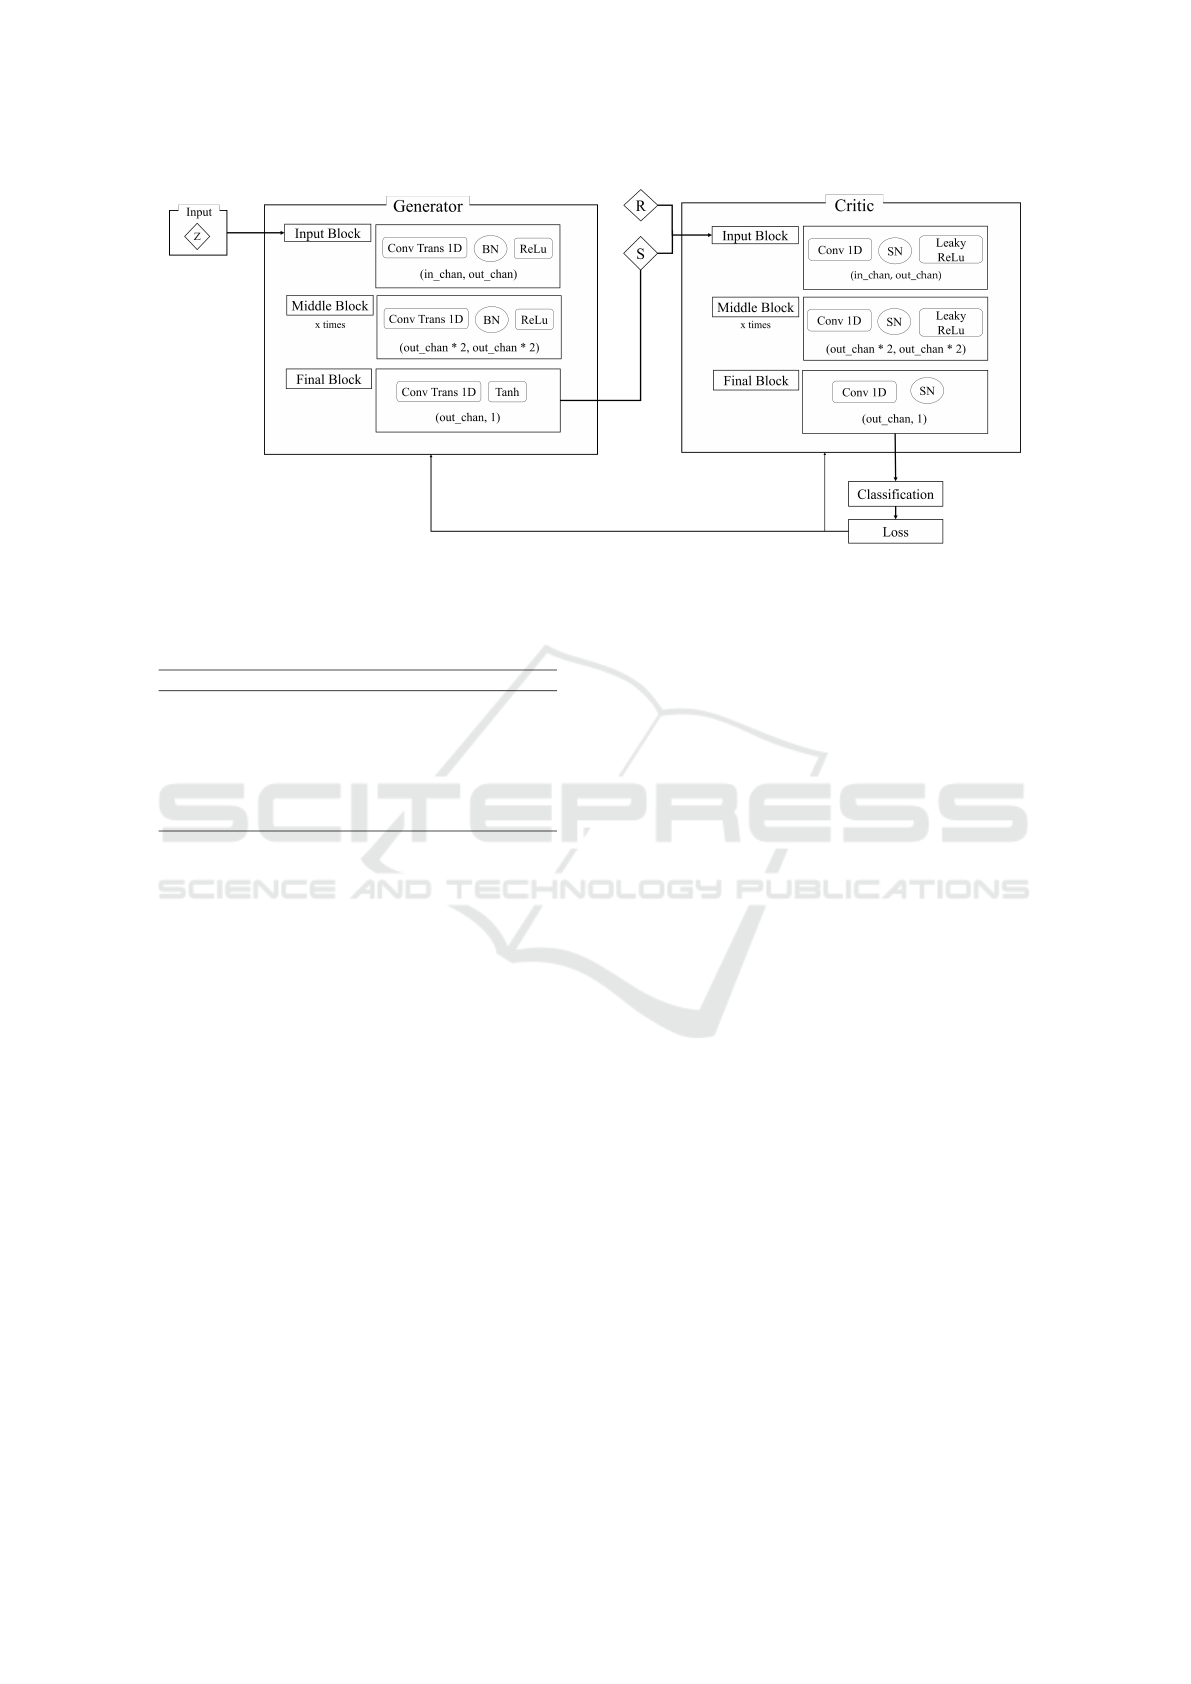
Figure 1: Generative model’s architecture. Each Neural Network is comprised of three types of blocks: input, middle and
final block. The input and final block are constituted by one layer, while the middle block was constituted by several layers.
The number of layers contained in the middle block was defined through the optimization of the model.
Table 1: Training Parameters for DCwGAN-GP.
Training Parameters
Number of Epochs 2000
Batch Size 40
Learning Rate 0.00005
Critic Interactions 5
Gradient Penalty Lambda 10
Latent Dimension 100
Number of samples Data points in each cluster
2.5.1 Fidelity Analysis
Fidelity analysis evaluates how closely synthetic sig-
nals resemble real ones across time, frequency, and
time-frequency domains without replicating them ex-
actly (Naeem et al., 2020) (Figueira and Vaz, 2022).
In this dimension, we calculated metrics for three
pairings: real-real, real-synthetic, and synthetic-
synthetic. The real-real pairing serves as a reference
to evaluate the fidelity of the synthetic data. To per-
form this analysis, each sample was compared with
every other sample within its respective pairing group.
In the time domain, the mean and standard devi-
ation (STD) of both real and synthetic signals were
evaluated, and the Wasserstein Distance (WD) was
calculated to quantify differences in their probabil-
ity distributions. In the frequency domain, the Power
Spectral Density (PSD) was computed for both sets
of signals to ensure similar spectral characteristics,
and a plot was created to visually compare the power
distribution across frequencies. Finally, for the time-
frequency domain, scalograms were generated using
the Morlet Wavelet Transform to capture dynamic
changes in frequency content over time. Similarity
between real and synthetic scalograms was quanti-
fied using the Pearson Correlation Coefficient, Co-
sine Similarity, Structural Similarity Index (SSIM)
and Mean Squared Error (MSE). This metrics were
calculated with the Scipy (Virtanen et al., 2020) and
Scikit-Learn Image Processing libraries (van der Walt
et al., 2014).
2.5.2 Diversity Analysis
To evaluate the diversity of SD in comparison to
RD, Principal Component Analysis (PCA) and t-
distributed Stochastic Neighbor Embedding (t-SNE)
were employed as dimensionality reduction tech-
niques. These methods enabled a visual comparison
of the distribution of synthetic samples against the
original data (Jansen, 2020).
2.5.3 Utility Analysis
To evaluate the utility of the SD, several classifica-
tion models were developed and trained on three
datasets: RD, SD, and a combination of both. The
aim was to determine if the SD could improve
the model’s ability to distinguish between clusters,
with better performance on the combined dataset
indicating the utility of the SD. The statistical
significance of the observed differences was then
evaluated using a Z-test, which compares the per-
formance metrics between datasets to determine
if the observed variations are likely due to chance.
Model Training and Evaluation
The same features used in the clustering process (Sec-
tion 2.3.1) were applied in the classifiers. The data
was split into 70% training and 30% testing sets, us-
ing stratified sampling to maintain class proportions.
Various ML classifiers were developed using the
Intraoperative Electrocorticography Signal Synthesis to Improve the Classification of Epileptiform Tissue
1145

Scikit-Learn library (Pedregosa et al., 2018), includ-
ing Logistic Regression, Support Vector Machines
(SVM), Random Forest, Neural Network Multi-Layer
Perceptron, Gradient Boosting, and Balanced Ran-
dom Forest. These models were chosen for their abil-
ity to handle imbalanced datasets (Chen et al., 2004),
capture complex non-linear patterns (Jaiswal, 2024),
and perform well with tabular data (Tuychiev, 2023),
with the first two serving as baselines for compar-
ison. A 10-fold Stratified Cross-Validation method
was used with the shuffle parameter set to ”True” to
minimize bias from any inherent order, ensuring the
models generalization to unseen data and avoiding
overfitting. Performance metrics such as Accuracy,
F1-Score, Precision, Recall and AUC were used to
compare the models’ effectiveness.
3 RESULTS
3.1 Clustering Analysis
Three clusters were chosen for the Agglomerative
Clustering algorithm. Based on the alignment with
the clinician binary classifications (non-resected and
resected tissue) and the data characteristics, the clus-
ters were labelled as: Cluster 0 (Noisy), Cluster 1
(Epileptic), and Cluster 2 (Non-Epileptic). Specifi-
cally, Cluster 0 consisted of 28 signals, with 57.14%
of the data points classified as non-resected and
42.86% as resected. Cluster 1 included 71 sig-
nals, comprising 39.89% non-resected and 61.11%
resected data points. Cluster 2 contained 31 signals,
of which 83.87% were non-resected and 16.13% were
resected. Some overlap occurred in the 3D scatter
plots between Clusters 0 and 1, and Clusters 1 and 2.
Figure 2 illustrates three representative signals from
each cluster.
Figure 2: Illustration of three representative signals of each
cluster. The signals were normalized, therefore the ampli-
tude is in arbitrary units.
Cluster 0 exhibited irregular and noisy fluctua-
tions with no clear structure. Cluster 1, on the other
hand, had more structured patterns, while Cluster 2
showed a level of organization higher than Cluster 0,
but its patterns were still not as structured as those
in Cluster 1. Furthermore, the frequency analysis re-
vealed that Cluster 0 had a low PSD with no dominant
frequency peaks (as shown in Figure 5), reflecting its
noisy nature. In contrast, Cluster 1 demonstrated a
strong delta band peak with higher variability in the
PSD. Cluster 2 showed consistent delta-band peaks,
although with less variability compared to Cluster 1.
3.2 Evaluation of Synthetic Data
3.2.1 Fidelity Analysis
Time Analysis
The mean signals and their respective STD for real
and SD across Clusters 0, 1, and 2, depicted in Fig-
ure 3, reveal consistent waveform patterns. However,
synthetic signals in Cluster 0 display a slightly higher
amplitude and increased noise compared to their real
counterparts. In turn, the WD analysis illustrated in
Figure 4 shows relatively small differences between
the data pairings (real-real (RR), real-synthetic (RS)
and synthetic-synthetic (SS)). WD is highest for the
RR pairing, followed by RS, and lowest for SS. Clus-
ter 1 consistently has the highest WD across all pair-
ings, Cluster 2 is moderate, and Cluster 0 has the low-
est values. For the RS pairing, the WD values were
0.043 ± 0.025 for Cluster 0, 0.065 ± 0.045 for Cluster
1, and 0.045 ± 0.036 for Cluster 2.
Frequency Analysis
In the frequency domain depicted in Figure 5,
the synthetic signals match closely with the real
ones in low-frequency behavior, especially in the
delta band. However, the SD exhibit lower variabil-
ity, as indicated by their lower STD across all clusters.
Time-Frequency Analysis
Figure 6 evaluates the similarity between real and
synthetic scalograms across real-real (RR), real-
synthetic (RS), and synthetic-synthetic (SS) pairings.
Cosine Similarity increased from 0.729 ± 0.037 (RR)
to 0.795 ± 0.005 (SS), indicating greater similarity
within SD. SSIM and Pearson’s Correlation followed
a similar pattern, with Cluster 1 and Cluster 2 scor-
ing higher than Cluster 0. The Pearson correlation of
cluster 0 improved significantly in SS (+0.275), but
remained lower overall compared to other clusters.
Cluster 0 consistently exhibited the lowest similar-
ity across all metrics, while Clusters 1 and 2 demon-
strated moderate-to-high similarity, particularly in RS
pairings, where Pearson’s Correlation reached 0.694
± 0.087 and 0.672 ± 0.063, and Cosine Similarity
scored 0.757 ± 0.066 and 0.747 ± 0.051, respectively.
MSE showed a clear reduction, decreasing by 0.182
SyntBioGen 2025 - Special Session on Synthetic biosignals generation for clinical applications
1146
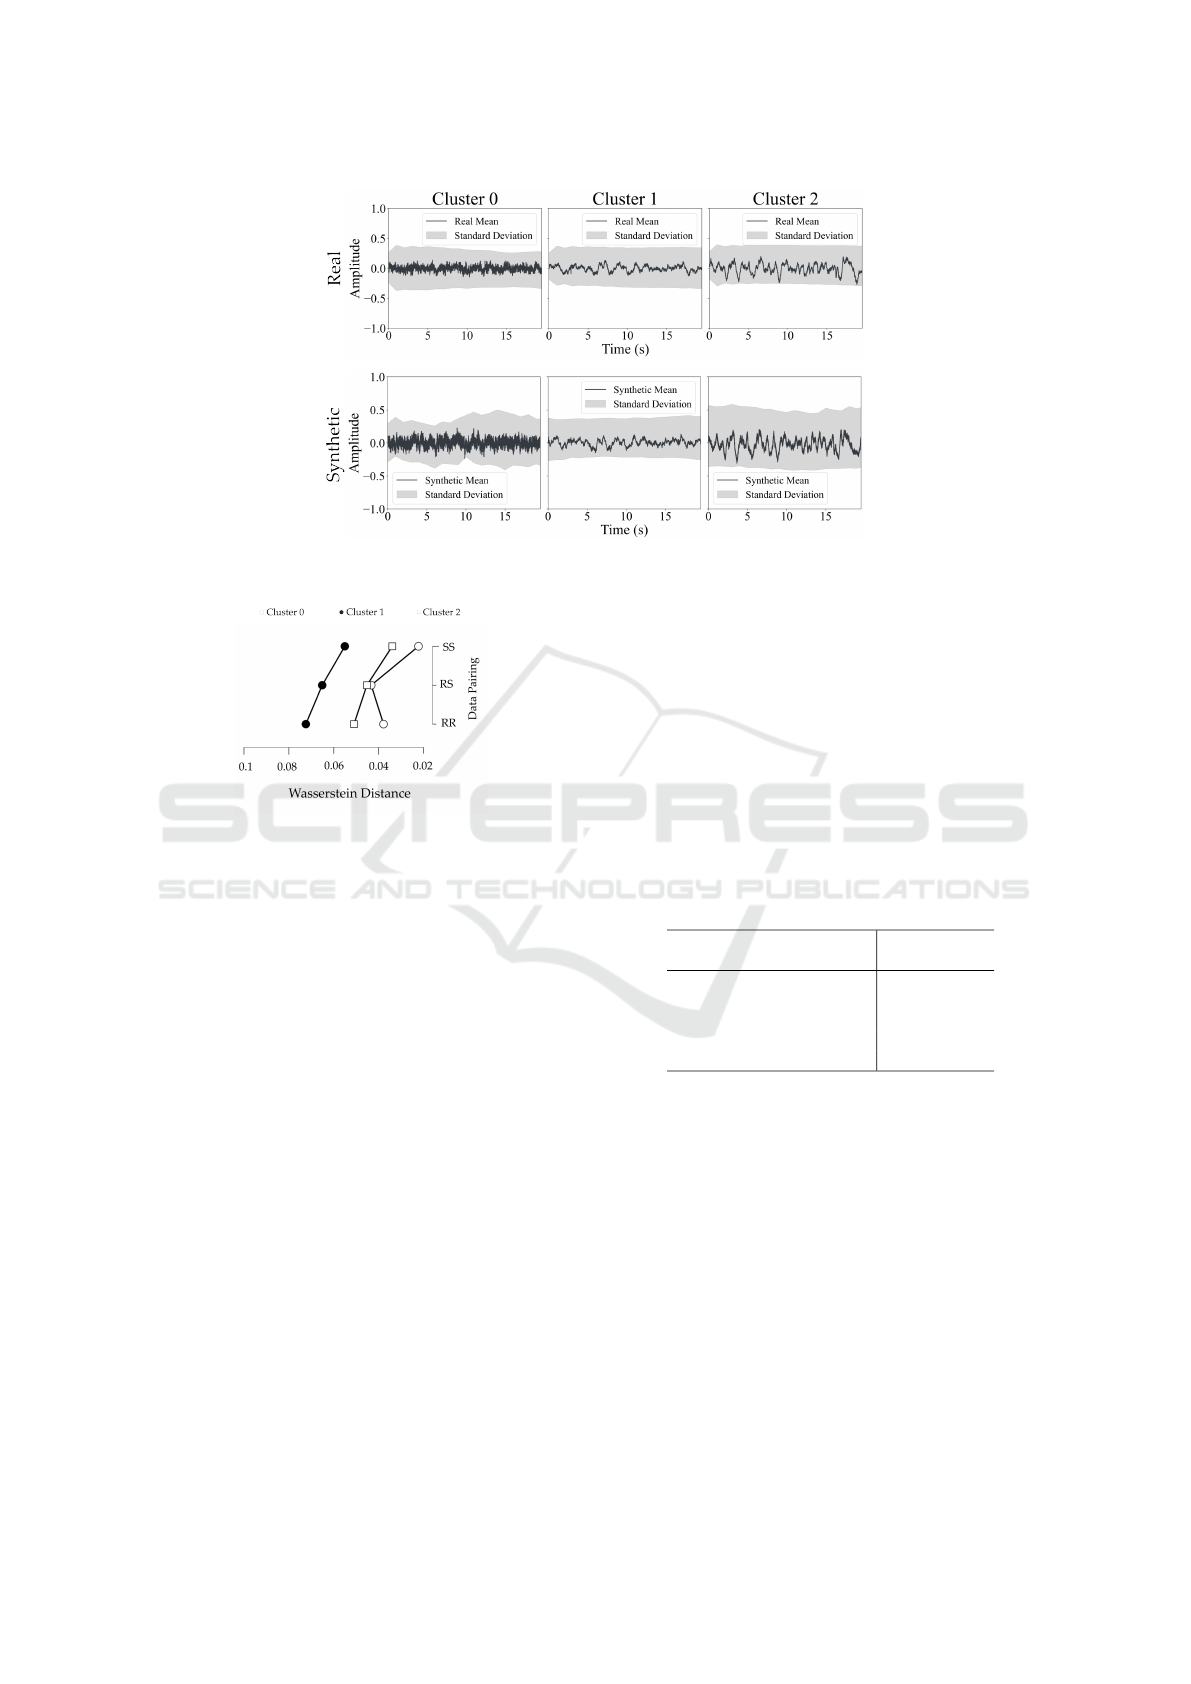
Figure 3: Comparison of the mean and respective Standard Deviation of the signals between real and synthetic clusters. The
signals are normalized, therefore the amplitude is in arbitrary units.
Figure 4: Comparison of the Wasserstein Distance between
different data pairing. In this case, this metric is being
compared between the real and synthetic (RS) signals, and
within the real (RR) and synthetic (SS) signals separately.
± 0.052 from RR to SS, with Cluster 1 achieving the
lowest error in RS (0.499 ± 0.078). Despite these
trends, the differences between RR and SS pairings
remained relatively modest overall, with Cluster 0
again showing the largest variations in SSIM (0.180
± 0.051) and Pearson’s Correlation (0.275 ± 0.119).
These results highlight greater internal consistency
within SD and the varying performance of clusters,
with Clusters 1 and 2 outperforming Cluster 0 across
all similarity metrics.
3.2.2 Diversity Analysis
In the PCA results illustrated in Figure 7 (upper row),
the SD overlap with the RD, replicating the overall
structure but is more concentrated in the center, sug-
gesting less diversity. In the t-SNE plots (second
line), synthetic signals are more scattered and less
grouped, indicating they fail to capture the local re-
lationships present in the RD.
3.2.3 Utility Analysis
The Logistic Regression model yielded the best re-
sults. Table 2 presents improvements in four per-
formance metrics and a slight decline in AUC when
trained on combined real and SD (RS) versus training
on RD alone (R). However, these differences were not
statistically significant. Additional classification re-
sults are available in the Appendix.
Table 2: Logistic Regression Scores. Comparison between
the scores of the model trained on the combined data (RS)
and tested on real (R), with the model trained and tested
solely on the RD.
Train Test Train Test
R R RS R
Accuracy 0.89 0.85 0.93 0.88
Precision 0.89 0.73 0.92 0.76
Recall 0.92 0.80 0.94 0.81
F1-Score 0.90 0.75 0.93 0.78
AUC 0.97 0.94 0.99 0.92
4 DISCUSSION
This study aimed to develop a generative model in
order to produce synthetic ioECoG data from ioECoG
signals of patients undergoing epilepsy surgery.
The analysis of the real ioECoG dataset revealed
three distinct clusters, each associated with unique
signal patterns. Cluster 1 could be linked to patho-
logical signals, displaying epileptiform activity char-
acterized by spikes and slow-wave complexes, simi-
lar to those described by (Li et al., 2020). Moreover,
Cluster 1 and Cluster 2, labelled as epileptic and non-
epileptic, showed a strong alignment with the clinical
Intraoperative Electrocorticography Signal Synthesis to Improve the Classification of Epileptiform Tissue
1147
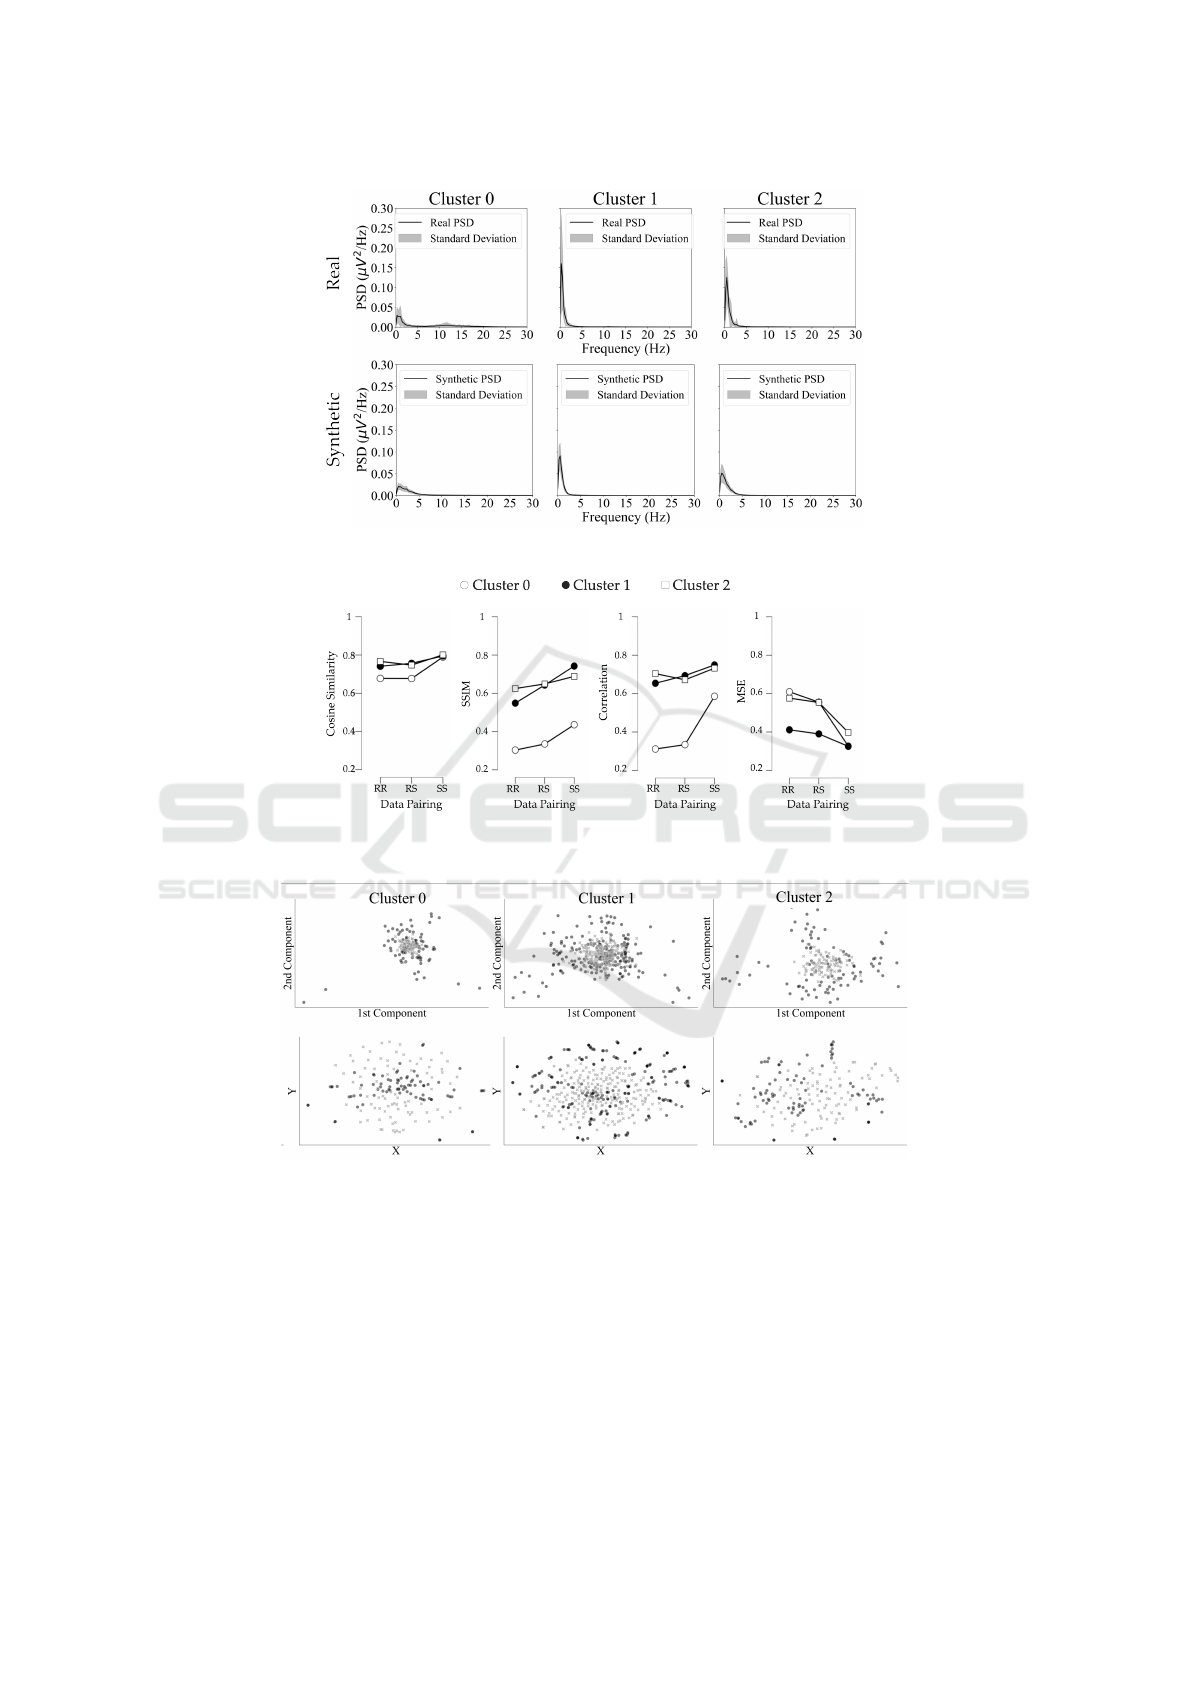
Figure 5: Comparison of the mean PSD and respective STD between real and synthetic clusters.
Figure 6: Similarity metrics in the time-frequency domain between different data pairing: real-real (RR), real-synthetic (RS)
and synthetic-synthetic (SS).
Figure 7: Diversity evaluation. The upper row is correspondent to the PCA evaluation, while the second line is correspondent
to the t-SNE evaluation. The columns correspond to each cluster. The SD is represented by black dots, while the RD is
represented by gray crosses.
categories, matching 61.1 and 83.9% of the clinician’s
classifications, respectively. This alignment was also
supported by the study of (Gajic et al., 2015), who
showcased epileptic signals with more spaced events
and with fewer fluctuations, while non-epileptic sig-
nals showed more noise and greater variability. In
turn, Cluster 0 contained a mix of non-epileptic and
epileptic signals, likely due to contamination from
neighboring channels within the same electrode grid,
as observed in other intracranial EEG studies (Sindhu
et al., 2023). Additionally, this overlap may simply
reflect the random nature of noise, which can occur
with similar frequency in both types of tissue. Its ori-
gin may be attributed to machine artifacts, which can
mimic pathological signals and interfere with accu-
rate classification (Nejedly et al., 2020). Having a
SyntBioGen 2025 - Special Session on Synthetic biosignals generation for clinical applications
1148

noisy cluster could also aid clinical implementation,
as it removes the need to exclude channels affected
by artifacts, simplifying the process and preserving
data integrity. In the frequency domain, all clusters
showed a peak in the delta band, as expected dur-
ing propofol-induced deep sleep (Moini and Piran,
2020), with Cluster 0 also exhibiting an alpha peak
that might be related to propofol use (Purdon et al.,
2015).
Overall, in Figure 3, the synthetic signals closely
match the real ones in amplitude and waveform, in-
dicating that the model effectively captures the global
temporal patterns. Minor STD deviations, similar to
those reported by (Hartmann et al., 2018), suggest
slight differences in variability between real and syn-
thetic signals. In turn, WD scores showed that syn-
thetic signals preserved the similarity trends across
clusters, with Cluster 1 having the highest WD prob-
ably due to its distinct epileptiform patterns, followed
by Clusters 2 and 0, where Cluster 0 displayed the
greatest similarity with lower WD values. Slightly
lower SS values suggested reduced variability in syn-
thetic signals. RS WD scores in this study seem to
outperform benchmarks from the literature, such as
0.078 reported by (Hartmann et al., 2018) and 0.450
by (Xu et al., 2022). Furthermore, the 20-second syn-
thetic time-series offers a more realistic representa-
tion compared to the shorter windows commonly used
in other studies using scalp EEG data —such as 3 sec-
onds (Aznan et al., 2019), 4 seconds (Pascual et al.,
2019), and even as short as 0.05 seconds (Pan et al.,
2023)—allowing for improved fidelity and signal di-
versity.
Figure 5 shows that the synthetic signals closely
match the real ones in power distribution, mirror-
ing their trend particularly in the delta band, despite
the real signals displaying higher variability (STD).
These results align with those reported by (Park et al.,
2024) and (Hartmann et al., 2018), where synthetic
PSDs showed similar prominent peaks to their real
counterparts, with slight power variations. In contrast,
(Carrle et al., 2023) found that synthetic PSDs did not
fully capture the prominent peaks of RD, indicating a
stronger reliability from the generative model in this
study. However, the lower STD in synthetic PSDs
suggests reduced variability compared to the real sig-
nals.
In the evaluation of the time-frequency domain
(Figure 6), the lower similarity values in the RR pair-
ing across all metrics reflect greater variability in the
RD compared to the higher SS scores, indicating that
synthetic signals display higher inter-similarity and
fail to capture the full variability of the RD. This is
most evident in Cluster 0, which performed worst in
all metrics but showed the largest improvement from
RR to SS, particularly in SSIM and Pearson’s Cor-
relation. However, the differences between RR and
SS pairings are relatively small. Although Cluster 0
had the lowest RS scores, they were consistent with
the RR pairing, suggesting that while the SD does not
fully capture RD variability, it still maintains strong
correlations with the real signals. To the best of our
knowledge, this type of analysis was not found in
comparable studies (Wu et al., 2024), which focused
on signal similarity rather than time-frequency repre-
sentations.
The limited variability of the synthetic signals is
confirmed by the diversity evaluation results. While
synthetic signals replicated most real patterns, as
shown by the overlap in the PCA plot, their concentra-
tion toward the center indicates only partial diversity
capture, with the tails of the real distributions being
overlooked. Similarly, the t-SNE plots reflect findings
from (Wu et al., 2024), though our study showed less
overlap, highlighting a lack of diversity in the gener-
ated samples. This issue likely stems from misclas-
sifications during clustering, particularly in Cluster 1,
introducing unwanted variability in the RD. During
training, the Critic consistently labelled these mis-
classified signals as synthetic, causing the generator
to avoid synthesizing them. As a result, the synthetic
signals focused on common patterns and lacked the
broader variability seen in the RD, especially at the
distribution tails.
All classifiers showed improved performance
across Accuracy, Precision, Recall, and F1-score
when using the augmented ioECoG dataset, high-
lighting the utility of the generated signals. The Lo-
gistic Regression Model showcased the best results
when trained on the augmented dataset, but tested
only with the real signals. The 3% increase in accu-
racy aligns with improvements reported in other stud-
ies, such as 2.51% (Du et al., 2024a), 5% (Xu et al.,
2022), and 6% (Wu et al., 2024). However, the de-
crease in AUC may indicate that the SD exhibit dis-
tributional differences compared to RD, confirming
their inability to fully capture the variability and com-
plexity of the RD.
Finally, a comprehensive visual review and vali-
dation of all generated signals remains necessary to
confirm their suitability for clinical applications.
5 CONCLUSIONS AND FUTURE
WORK
This study developed a generative model, DCwGAN-
GP, capable of synthesizing realistic ioECoG signals
Intraoperative Electrocorticography Signal Synthesis to Improve the Classification of Epileptiform Tissue
1149

from epileptic and non-epileptic tissue with the po-
tential to enhance ML models and support epilepsy
surgery treatment. The generated signals replicated
the key characteristics of the RD across time, fre-
quency, and time-frequency domains, contributing to
improved performance in ML classifiers trained to
distinguish epileptic, non-epileptic, and noisy signals.
The 3% performance improvement demonstrated the
utility of the SD in enhancing classifier performance.
While the DCwGAN-GP model demonstrated re-
liable fidelity in capturing temporal patterns within in-
dividual channels, it did not account for inter-channel
temporal dynamics or spatial relationships between
electrodes. Incorporating techniques such as Long
Short-Term Memory (LSTM) networks, Recurrent
Neural Networks (RNNs) or Transformers for tempo-
ral dependencies, along with graph-based models for
spatial relationships, could further enhance the real-
ism and clinical relevance of the generated signals. In
addition, clinical validation of each signal should be
considered to ensure reliability and clinical applica-
bility.
Future work could focus on improving the ground-
truth labelling of signals to enhance accurate dis-
tinction of epileptiform activity, thereby strengthen-
ing the generative process. Machine Learning and
Deep Clustering techniques hold promise for refin-
ing pattern recognition within ioECoG data, poten-
tially reducing misclassifications and achieving more
nuanced synthetic signals that reflect real-world di-
versity. Another critical direction involves explicitly
modeling spatial and temporal dependencies across
signals.
ACKNOWLEDGEMENTS
This work was supported by the European Union’s
Horizon Europe research and innovation programme
under grant agreement No. 101095387: AISym4Med
– Synthetic and Scalable Data Platform for Med-
ical Empowered AI (HORIZON-HLTH-2022-IND-
13), by the European Research Council (ERC) under
grant No. 803880, by EpilepsieNL, the Christelijke
Verening voor de Verpleging van Lijders aan Epilep-
sie, and a VIDI grant number 09150172210057.
REFERENCES
Aznan, N. K. N., Atapour-Abarghouei, A., Bonner, S.,
Connolly, J., Moubayed, N. A., and Breckon, T.
(2019). Simulating brain signals: Creating synthetic
eeg data via neural-based generative models for im-
proved ssvep classification. In International Joint
Conference on Neural Networks (IJCNN). IEEE.
Aznan, N. K. N., Atapour-Abarghouei, A., Bonner, S., Con-
nolly, J. D., and Breckon, T. P. (2020). Leveraging
synthetic subject invariant eeg signals for zero cali-
bration bci.
Barandas, M., Folgado, D., Fernandes, L., Santos, S.,
Abreu, M., Bota, P., Liu, H., Schultz, T., and Gam-
boa, H. (2020). Tsfel: Time series feature extraction
library. SoftwareX, 11:100456.
Carrle, F. P., Hollenbenders, Y., and Reichenbach, A.
(2023). Generation of synthetic eeg data for training
algorithms supporting the diagnosis of major depres-
sive disorder. Frontiers in Neuroscience, 17.
Chaibi, S., Mahjoub, C., Ayadi, W., and Kachouri,
A. (2024). Epileptic eeg patterns recognition
through machine learning techniques and relevant
time–frequency features. Biomedical Engineering /
Biomedizinische Technik, 69:111–123.
Chen, C., Liaw, A., and Breiman, L. (2004). Using ran-
dom forest to learn imbalanced data. Technical report,
Department of Statistics, UC Berkley.
Consales, A., Casciato, S., Asioli, S., Barba, C., Caulo, M.,
Colicchio, G., Cossu, M., de Palma, L., Morano, A.,
Vatti, G., Villani, F., Zamponi, N., Tassi, L., Gennaro,
G. D., and Marras, C. E. (2021). The surgical treat-
ment of epilepsy. Neurological Sciences, 42:2249–
2260.
Cook, Z., Sinha, G., Wang, J., Zhao, C., Belacel, N., Does-
burg, S., Medvedev, G., Ribary, U., Vakorin, V., and
Xi, P. (2024). Enhancing brain age prediction: A gen-
erative ai approach for eeg machine learning models.
In 2024 IEEE International Instrumentation and Mea-
surement Technology Conference (I2MTC), pages 1–
6. IEEE.
Delorme, A. (2023). Eeg is better left alone. Scientific Re-
ports, 13:2372.
Demuru, M., van Blooijs, D., Zweiphenning, W., Hermes,
D., Leijten, F., and Zijlmans, M. (2022). A prac-
tical workflow for organizing clinical intraoperative
and long-term ieeg data in bids. Neuroinformatics,
20:727–736.
Du, X., Ding, X., Xi, M., Lv, Y., Qiu, S., and Liu, Q.
(2024a). A data augmentation method for motor im-
agery eeg signals based on dcgan-gp network. Brain
Sciences, 14:375.
Du, X., Wang, X., Zhu, L., Ding, X., Lv, Y., Qiu, S., and
Liu, Q. (2024b). Electroencephalographic signal data
augmentation based on improved generative adversar-
ial network. Brain Sciences, 14.
Du, Y., Li, G., Wu, M., and Chen, F. (2024c). Unsupervised
multivariate feature-based adaptive clustering analysis
of epileptic eeg signals. Brain Sciences, 14:342.
Duncan, J. S. and Taylor, P. N. (2023). Optimising epilepsy
surgery. The Lancet Neurology, 22:373–374.
Fan, Y., Wang, B., and Zhang, T. (2024). A dual-
discriminator gan for sleep eeg signal synthesis. Jour-
nal Of Bioinformatics and Neuroscience (JBINS).
Fang, L., Li, Y., Shao, M., Yu, A., Felemban, B. F., Aly,
A. A., Rani, S., and Lyu, X. (2024). Enhancing med-
SyntBioGen 2025 - Special Session on Synthetic biosignals generation for clinical applications
1150

ical signal processing and diagnosis with ai-generated
content techniques. IEEE Journal of Biomedical and
Health Informatics.
Fern
´
andez, I. S. and Loddenkemper, T. (2013). Electro-
corticography for seizure foci mapping in epilepsy
surgery. Journal of Clinical Neurophysiology,
30(6):554–570.
Figueira, A. and Vaz, B. (2022). Survey on synthetic data
generation, evaluation methods and gans. Mathemat-
ics, 10:1–41.
Gajic, D., Djurovic, Z., Gligorijevic, J., Gennaro, S. D.,
and Savic-Gajic, I. (2015). Detection of epileptiform
activity in eeg signals based on time-frequency and
non-linear analysis. Frontiers in Computational Neu-
roscience, 9.
Greiner, H. M., Horn, P. S., Tenney, J. R., Arya, R., Jain,
S. V., Holland, K. D., Leach, J. L., Miles, L., Rose,
D. F., Fujiwara, H., and Mangano, F. T. (2016). Prere-
section intraoperative electrocorticography (ecog) ab-
normalities predict seizure-onset zone and outcome in
pediatric epilepsy surgery. Epilepsia, 57(4):582–589.
Habashi, A. G., Azab, A. M., Eldawlatly, S., and Aly, G. M.
(2023). Generative adversarial networks in eeg anal-
ysis: an overview. Journal of NeuroEngineering and
Rehabilitation, 20:40.
Harris, C. R., Millman, K. J., van der Walt, S. J., Gommers,
R., Virtanen, P., Cournapeau, D., Wieser, E., Taylor,
J., Berg, S., Smith, N. J., Kern, R., Picus, M., Hoyer,
S., van Kerkwijk, M. H., Brett, M., Haldane, A., del
R
´
ıo, J. F., Wiebe, M., Peterson, P., G
´
erard-Marchant,
P., Sheppard, K., Reddy, T., Weckesser, W., Abbasi,
H., Gohlke, C., and Oliphant, T. E. (2020). Array pro-
gramming with NumPy. Nature, 585(7825):357–362.
Hartmann, K. G., Schirrmeister, R. T., and Ball, T. (2018).
Eeg-gan: Generative adversarial networks for elec-
troencephalograhic (eeg) brain signals. Electrical En-
gineering and Systems Science.
Hoogteijling, S., Schaft, E. V., Dirks, E. H., Straumann,
S., Demuru, M., van Eijsden, P., Gebbink, T., Otte,
W. M., Huiskamp, G. M., van’t Klooster, M. A., et al.
(2024). Machine learning for (non-) epileptic tissue
detection from the intraoperative electrocorticogram.
Clinical Neurophysiology, 167:14–25.
Jaiswal, S. (2024). Multilayer perceptrons in machine learn-
ing: A comprehensive guide.
Jansen, S. (2020). Machine Learning for Algorithmic Trad-
ing: Predictive models to extract signals from market
and alternative data for systematic trading strategies
with Python. Packt Publishing, 2nd edition.
Kononenko, I. and Kukar, M. (2007). Chapter 12 - cluster
analysis. In Kononenko, I. and Kukar, M., editors,
Machine Learning and Data Mining, pages 321–358.
Woodhead Publishing.
Li, Q., Gao, J., Zhang, Z., Huang, Q., Wu, Y., and Xu, B.
(2020). Distinguishing epileptiform discharges from
normal electroencephalograms using adaptive fractal
and network analysis: A clinical perspective. Fron-
tiers in Physiology, 11:828.
Liang, S., Kuang, S., Wang, D., Yuan, Z., Zhang, H., and
Sun, L. (2023). An auxiliary synthesis framework for
enhancing eeg-based classification with limited data.
IEEE Transactions on Neural Systems and Rehabili-
tation Engineering, 31:2120–2131.
Miller, K. J. (2019). A library of human electrocortico-
graphic data and analyses. Nature Human Behaviour,
3:1225–1235.
Mirza, M. and Osindero, S. (2014). Conditional generative
adversarial nets. ArXiv.
Moini, J. and Piran, P. (2020). Chapter 6 - cerebral cor-
tex. In Moini, J. and Piran, P., editors, Functional and
Clinical Neuroanatomy, pages 177–240. Academic
Press.
Naeem, M. F., Oh, S. J., Uh, Y., Choi, Y., and Yoo, J.
(2020). Reliable fidelity and diversity metrics for gen-
erative models. In III, H. D. and Singh, A., editors,
Proceedings of the 37th International Conference on
Machine Learning, volume 119 of Proceedings of Ma-
chine Learning Research, pages 7176–7185. PMLR.
Nejedly, P., Kremen, V., Sladky, V., Cimbalnik, J., Klimes,
P., Plesinger, F., Mivalt, F., Travnicek, V., Viscor, I.,
Pail, M., Halamek, J., Brinkmann, B. H., Brazdil, M.,
Jurak, P., and Worrell, G. (2020). Multicenter intracra-
nial eeg dataset for classification of graphoelements
and artifactual signals. Scientific Data, 7(1):179.
Nia, A. F., Tang, V., Talou, G. M., and Billinghurst, M.
(2024). Synthesizing affective neurophysiological sig-
nals using generative models: A review paper. Journal
of Neuroscience Methods, 406.
NVIDIA Corporation (2024). Nvidia rtx 6000 ada gener-
ation graphics card. https://www.nvidia.com/en-us/
design-visualization/rtx-6000/.
Pan, Y., Li, N., Zhang, Y., Xu, P., and Yao, D. (2023). Short-
length ssvep data extension by a novel generative ad-
versarial networks based framework. Cognitive Neu-
rodynamics.
Panwar, S., Rad, P., Jung, T.-P., and Huang, Y. (2020). Mod-
eling eeg data distribution with a wasserstein genera-
tive adversarial network to predict rsvp events. IEEE
Transactions on Neural Systems and Rehabilitation
Engineering, 28:1720–1730.
Park, J., Mahey, P., and Adeniyi, O. (2024). Improving eeg
signal classification accuracy using wasserstein gener-
ative adversarial networks.
Pascual, D., Aminifar, A., Atienza, D., Ryvlin, P., and Wat-
tenhofer, R. (2019). Synthetic epileptic brain activities
using generative adversarial networks. arXiv preprint
arXiv:1907.10518.
Pascual, D., Amirshahi, A., Aminifar, A., Atienza, D.,
Ryvlin, P., and Wattenhofer, R. (2021). Epilepsygan:
Synthetic epileptic brain activities with privacy preser-
vation. IEEE Transactions on Biomedical Engineer-
ing, 68:2435–2446.
Paszke, A., Gross, S., Massa, F., Lerer, A., Bradbury, J.,
Chanan, G., Killeen, T., Lin, Z., Gimelshein, N.,
Antiga, L., Desmaison, A., Kopf, A., Yang, E., De-
Vito, Z., Raison, M., Tejani, A., Chilamkurthy, S.,
Steiner, B., Fang, L., Bai, J., and Chintala, S. (2019).
Pytorch: An imperative style, high-performance deep
learning library. In Advances in Neural Information
Intraoperative Electrocorticography Signal Synthesis to Improve the Classification of Epileptiform Tissue
1151

Processing Systems 32, pages 8024–8035. Curran As-
sociates, Inc.
Pedregosa, F., Varoquaux, G., Gramfort, A., Michel, V.,
Thirion, B., Grisel, O., Blondel, M., M
¨
uller, A.,
Nothman, J., Louppe, G., Prettenhofer, P., Weiss, R.,
Dubourg, V., Vanderplas, J., Passos, A., Cournapeau,
D., Brucher, M., Perrot, M., and
´
Edouard Duchesnay
(2018). Scikit-learn: Machine learning in python.
Purdon, P. L., Sampson, A., Pavone, K. J., and Brown, E. N.
(2015). Clinical Electroencephalography for Anesthe-
siologists: Part I: Background and Basic Signatures.
Anesthesiology, 123(4):937–960.
Rasheed, S. S. and Miften, F. S. (2023). Improve of neona-
tal seizure detection based on eeg signal using k-mean
clustering. In 2023 Al-Sadiq International Conference
on Communication and Information Technology (AIC-
CIT), pages 181–184. IEEE.
Saminu, S., Xu, G., Shuai, Z., Kader, I. A. E., Jabire, A. H.,
Ahmed, Y. K., Karaye, I. A., and Ahmad, I. S. (2022).
Application of deep learning and wt-sst in localization
of epileptogenic zone using epileptic eeg signals. Ap-
plied Sciences, 12:4879.
Shin, H. W., Kim, H. J., Jang, Y. K., You, H. S., Huh, H.,
Choi, Y. J., Choi, S. U., and Hong, J. S. (2020). Mon-
itoring of anesthetic depth and eeg band power using
phase lag entropy during propofol anesthesia. BMC
Anesthesiology, 20:49.
Shoka, A. A. E., Dessouky, M. M., El-Sayed, A., and Hem-
dan, E. E.-D. (2023). Eeg seizure detection: concepts,
techniques, challenges, and future trends. Multimedia
Tools and Applications, 82:42021–42051.
Shu, K., Zhao, Y., Wu, L., Liu, A., Qian, R., and Chen, X.
(2023). Data augmentation for seizure prediction with
generative diffusion model.
Sindhu, K. R., Ngo, D., Ombao, H., Olaya, J. E., Shrey,
D. W., and Lopour, B. A. (2023). A novel method
for dynamically altering the surface area of intracra-
nial eeg electrodes. Journal of Neural Engineering,
20(2):026002.
Sun, D., van ’t Klooster, M. A., Ringeling, E. M., Schaft,
E. V., van Rijen, P. C., Leijten, F. S., Demuru, M.,
Robe, P. A., Hoff, R. G., and Zijlmans, M. (2024).
Pausing propofol during neurosurgery to record in-
traoperative electrocorticography is feasible;10 years
of clinical experience. Clinical Neurophysiology,
167:84–91.
Tatum, W. O., editor (2021). Handbook of EEG Interpreta-
tion. Springer Publishing Company.
Tuychiev, B. (2023). A guide to the gradient boost-
ing algorithm. https://www.datacamp.com/tutorial/
guide-to-the-gradient-boosting-algorithm. Accessed:
2024-09-07.
van der Walt, S., Sch
¨
onberger, J. L., Nunez-Iglesias, J.,
Boulogne, F., Warner, J. D., Yager, N., Gouillart, E.,
and Yu, T. (2014). scikit-image: image processing in
python. PeerJ, 2:e453.
van Klink, N., van’t Klooster, M., Zelmann, R., Leijten, F.,
Ferrier, C., Braun, K., van Rijen, P., van Putten, M.,
Huiskamp, G., and Zijlmans, M. (2014). High fre-
quency oscillations in intra-operative electrocorticog-
raphy before and after epilepsy surgery. Clinical Neu-
rophysiology, 125(11):2212–2219.
Virtanen, P., Gommers, R., Oliphant, T. E., Haberland, M.,
Reddy, T., Cournapeau, D., Burovski, E., Peterson, P.,
Weckesser, W., Bright, J., van der Walt, S. J., Brett,
M., Wilson, J., Millman, K. J., Mayorov, N., Nel-
son, A. R. J., Jones, E., Kern, R., Larson, E., Carey,
C. J., Polat,
˙
I., Feng, Y., Moore, E. W., VanderPlas,
J., Laxalde, D., Perktold, J., Cimrman, R., Henriksen,
I., Quintero, E. A., Harris, C. R., Archibald, A. M.,
Ribeiro, A. H., Pedregosa, F., van Mulbregt, P., and
SciPy 1.0 Contributors (2020). SciPy 1.0: Fundamen-
tal Algorithms for Scientific Computing in Python.
Nature Methods, 17:261–272.
Wang, Z., Guo, J., van’t Klooster, M., Hoogteijling, S., Ja-
cobs, J., and Zijlmans, M. (2024). Prognostic value
of complete resection of the high-frequency oscilla-
tion area in intracranial eeg: A systematic review and
meta-analysis. Neurology, 102(9):e209216.
WHO (2019). Epilepsy: a public health imperative. World
Health Organization.
Wu, X., Zhang, D., Li, G., Gao, X., Metcalfe, B.,
and Chen, L. (2024). Data augmentation for in-
vasive brain-computer interfaces based on stereo-
electroencephalography (seeg). Journal of Neural En-
gineering.
Xu, Y., Yang, J., and Sawan, M. (2022). Multichannel syn-
thetic preictal eeg signals to enhance the prediction of
epileptic seizures. IEEE Transactions on Biomedical
Engineering, 69:3516–3525.
Zhong, H., Yu, S., Trinh, H., Lv, Y., Yuan, R., and Wang,
Y. (2023). Fine-tuning transfer learning based on dc-
gan integrated with self-attention and spectral nor-
malization for bearing fault diagnosis. Measurement,
210:112421.
Zhou, H., Wang, X., and Zhu, R. (2022). Feature selection
based on mutual information with correlation coeffi-
cient. Applied Intelligence, 52:5457–5474.
Zijlmans, M., Zweiphenning, W., and van Klink, N.
(2019). Changing concepts in presurgical assess-
ment for epilepsy surgery. Nature Reviews Neurology,
15(10):594–606.
Zweiphenning, W., van ’t Klooster, M. A., van Klink, N.
E. C., Leijten, F. S. S., Ferrier, C. H., Gebbink, T.,
Huiskamp, G., van Zandvoort, M. J. E., van Schoon-
eveld, M. M. J., Bourez, M., Goemans, S., Straumann,
S., van Rijen, P. C., Gosselaar, P. H., van Eijsden,
P., Otte, W. M., van Diessen, E., Braun, K. P. J., Zi-
jlmans, M., Bloemen-Carlier, E. M., Cibulkov
´
a, V.,
de Munnink, R., van der Salm, S., Eijkemans, M. J.,
van Eck, J. M. O., Velders, A., van Asch, C. J., Zwem-
mer, J., van Regteren-van Griethuysen, R., Smeding,
H., van der Berg, L., de Bresser, J., de Kort, G. A.,
and Dankbaar, J.-W. (2022). Intraoperative elec-
trocorticography using high-frequency oscillations or
spikes to tailor epilepsy surgery in the netherlands (the
hfo trial): a randomised, single-blind, adaptive non-
inferiority trial. The Lancet Neurology, 21:982–993.
SyntBioGen 2025 - Special Session on Synthetic biosignals generation for clinical applications
1152

APPENDIX
Table 3: Comparison of classification models trained on combined data (RS) and tested on real data (R) versus models trained
and tested solely on RD.
Models
Metric Random Forest SVM Neural Network Gradient Boosting Balanced RF
Accuracy
tR: 1.0 TR: 0.87 tR: 0.89 TR: 0.85 tR: 1.0 TR: 0.77 tR: 1.0 TR: 0.85 tR: 0.94 TR: 0.84
tRS: 1.0 TR: 0.87 tRS: 0.95 TR: 0.85 tRS: 1.0 TR: 0.83 tRS: 1.0 TR: 0.80 tRS: 0.97 TR: 0.78
Precision
tR: 1.0 TR: 0.63 tR: 0.89 TR: 0.69 tR: 1.0 TR: 0.63 tR: 1.0 TR: 0.63 tR: 0.94 TR: 0.65
tRS: 1.0 TR: 0.63 tRS: 0.95 TR: 0.63 tRS: 1.0 TR: 0.61 tRS: 1.0 TR: 0.72 tRS: 0.96 TR: 0.60
Recall
tR: 1.0 TR: 0.64 tR: 0.92 TR: 0.70 tR: 1.0 TR: 0.66 tR: 1.0 TR: 0.63 tR: 0.96 TR: 0.66
tRS: 1.0 TR: 0.64 tRS: 0.97 TR: 0.63 tRS: 1.0 TR: 0.62 tRS: 1.0 TR: 0.75 tRS: 0.98 TR: 0.60
F1-Score
tR: 1.0 TR: 0.64 tR: 0.90 TR: 0.70 tR: 1.0 TR: 0.64 tR: 1.0 TR: 0.63 tR: 0.95 TR: 0.66
tRS: 1.0 TR: 0.64 tRS: 0.95 TR: 0.63 tRS: 1.0 TR: 0.62 tRS: 1.0 TR: 0.72 tRS: 0.98 TR: 0.60
Abbreviations: tR: train on real data; TR: test on real data; tRS: train on real + synthetic data; RF: Random Forest.
Intraoperative Electrocorticography Signal Synthesis to Improve the Classification of Epileptiform Tissue
1153
