
Low-Cost Photoacoustic System for Biomedical Applications
João Ferreira
1
, Vânia Pinto
1,2 a
, Tiago Matos
1,2 b
, Susana O. Catarino
1,2 c
, Graça Minas
1,2 d
and Paulo Sousa
1,2,* e
1
Center for Micro Electromechanical Systems (CMEMS), Universiy of Minho, Guimarães, 4800-058, Portugal
2
LABBELS — Associate Laboratory in Biotechnology and Bioengineering and Microelectromechanical Systems,
University o 7, Portugal
psousa@dei.uminho.pt
Keywords: Image Reconstruction, Photoacoustics, Scanning System.
Abstract: Recently, the field of photoacoustic (PA) imaging has garnered significant attention due to its ability to
provide high-resolution images and real-time monitoring of biological tissues. However, PA systems have
relied on expensive and complex laser sources and detection mechanisms, limiting their accessibility for
widespread use in both clinical and research settings. So, this work aims to address these limitations by
presenting the development of an alternative low-cost photoacoustic system, with an estimated cost of less
than 700€, based on a Q-switched solid-state Nd:Ce:YAG nanosecond laser and a highly sensitive system for
acoustic detection. PA data acquisition and image reconstruction were implemented and validated with pencil
lead phantoms. The developed system shows a high potential to provide a low-cost tool that can be used in
several biomedical applications.
1 INTRODUCTION
In recent years, photoacoustic (PA) has emerged as a
new sensing technology that has been applied in the
biomedical imaging field to obtain structural and
functional information of cells and tissues non-
invasively, providing highly specific molecular
images. Furthermore, this imaging technology offers
excellent spatial resolution, large imaging depth and
high optical contrast (Beard, 2011; Erfanzadeh &
Zhu, 2019; Zhu et al., 2024). It has been studied for
tumour detection, epidermal melanin measurements,
blood oxygenation monitoring, quantitative blood
flow estimation, among others (Attia et al., 2019;
John et al., 2023). Although its huge potential, the
high cost of traditional PA systems and challenges in
the miniaturization of the imaging components have
limited their accessibility and widespread use in
various fields, particularly in smaller laboratories and
developing regions.
a
https://orcid.org/0000-0003-3395-1251
b
https://orcid.org/0000-0003-3826-6413
c
https://orcid.org/0000-0002-8962-0710
d
https://orcid.org/0000-0003-2460-0556
e
https://orcid.org/0000-0003-2290-808X
*
Corresponding author.
Typically, most of the commercial and research
lab-made PA systems for biomedical applications use
solid-state lasers to irradiate their targets, however
these systems have been difficult to translate to
clinical applications, due to their high cost and bulky
size (Zhu et al., 2020). In recent years, low-cost solid-
state laser, Laser Diodes (LDs) and light emitting
diodes (LEDs) have emerged as alternative
illumination sources, for the development of less
expensive, compact and portable sensing and imaging
systems (Zhong et al., 2018). Even though LEDs and
LDs possess some disadvantages, such as low output
energy, lack of spectral tuning capability, and long
pulse widths, they are portable, affordable, and
energy-efficient light sources (Singh & Xia, 2020).
In addition, the PA systems require ultrasonic
detection methods that include piezoelectric
transducers, micromachined ultrasound transducers
(MUTs) (which can be divided into piezoelectric
micromachined ultrasound transducer (pMUT),
1092
Ferreira, J., Pinto, V., Matos, T., Catarino, S. O., Minas, G. and Sousa, P.
Low-Cost Photoacoustic System for Biomedical Applications.
DOI: 10.5220/0013399500003911
In Proceedings of the 18th International Joint Conference on Biomedical Engineering Systems and Technologies (BIOSTEC 2025) - Volume 1, pages 1092-1099
ISBN: 978-989-758-731-3; ISSN: 2184-4305
Copyright © 2025 by Paper published under CC license (CC BY-NC-ND 4.0)
capacitive micromachined ultrasound transducer
(cMUT)) and optical transducers (Manwar et al.,
2020). However, piezoelectric transducers are the
most used transducers because of their well-
established fabrication technology, reduced cost and
dimensions and scalable sensitivity.
This work addresses this challenge by presenting
the development of a novel and low-cost
photoacoustic system that utilizes an affordable
nanosecond tattoo removal laser as its light source
with a unit price of ∼€500 (compared with $20–30 k
for a regular system for PA testing and measurement)
(Zhu et al., 2020; Zou et al., 2023), significantly
reducing the typical investment required for such
technology. Complementing the laser, a commercial
lead zirconate titanate (PZT) transducer works as the
acoustic receptor, while a low-cost logarithmic
amplifier enhances the signal detection capabilities.
To validate the performance of the developed system,
experiments were conducted using pencil lead
phantoms, enabling the assessment of the
photoacoustic signal through a cost-effective
electronic circuit. In addition, a scanning system and
an image reconstruction system from the PA signals
were developed. This innovative approach not only
demonstrates the feasibility of creating an economical
PA system but also opens new avenues for research
and clinical applications that require high-quality
imaging without prohibitive costs
2 PA SYSTEM’S DESIGN AND
OPERATION
The PA effect is initiated when an pulsed
electromagnetic wave targets the sample surface.
Depending on the wavelength, the light penetrates to
some depth in the target. Photon absorption and
subsequent relaxation induce a rapid temperature rise,
leading to the thermoelastic expansion of the
absorbing target. This sudden pressure rise propagates
as a sound wave, which then can be detected using an
acoustic transducer. By detecting the pressure wave,
one can localize their sources (i.e., where the light was
absorbed) and obtain important functional and
molecular information about the studied sample. More
details about the theory and operational principles of
PA detection are described in our previous work
(Pinheiro et al., 2023; Pinheiro et al., 2024).
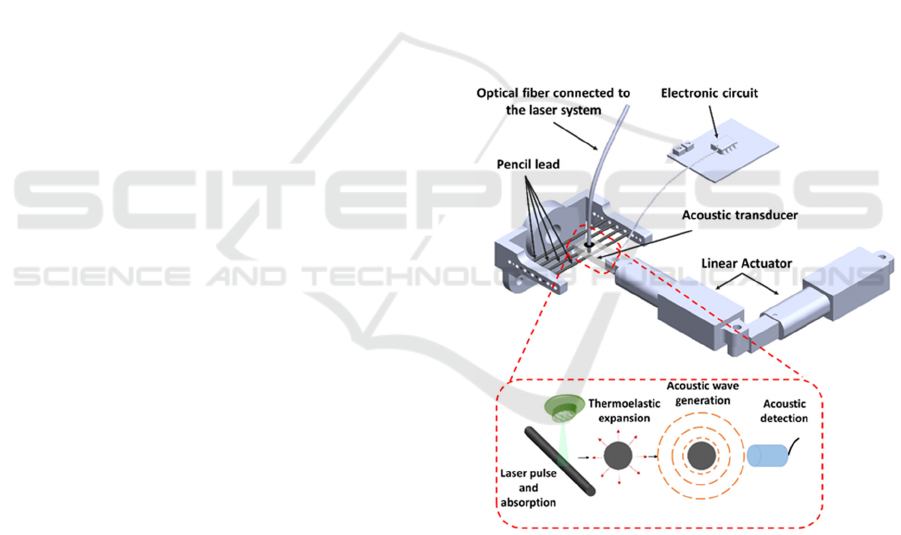
The developed PA system and the main operation
principle are presented in Figure 1. An Q-switched
solid-state Nd:Ce:YAG nanosecond laser (Ulat,
B08G8S5YHF, China), commonly used for tattoo
removal, was used as light source. This equipment
outputs 532 nm laser pulses with a pulse width of 8 ns
and 40 mJ energy at a repetition rate of 10 Hz. An
optical fiber was used to guide the light from the laser
to the sample. A packaging assembly specifically
engineered to support and align all the components,
namely the excitation light and the acoustic transducer
(PRYY+0398, PiMicos) was fabricated by 3D
printing. For the scanning measurement system, two
linear actuators (6V Push Rod, 30mm-128N, LA-T8-
6-7-3085-128) connected in a 90-degree configuration
were used to move in a controlled way the excitation
light and the acoustic transducer together. The
generated PA signals were detected by the acoustic
transducer and amplified by the electronic circuit
(AD8307 from Analog Devices). A STM
microcontroller was used to control, store and acquire
the PA signals which are sent to a PC where a phyton
program was implemented to reconstruct the image. In
the following sections, the main components of the
developed PA system are described with more detail.
Figure 1: Schematic representation of the main components
of the PA detection system.
2.1 Acoustic Transducer
The detection module of the PA system uses a PZT
piezoelectric transducer with a 5 mm diameter and
250 μm thickness (PRYY+0398, PiMicos). The
transducer electrical characterization was performed
by measuring the S-parameters from 10 kHz to 20
MHz (without an impedance matching circuit), to
determine the return loss (RL), which indicates the
Low-Cost Photoacoustic System for Biomedical Applications
1093
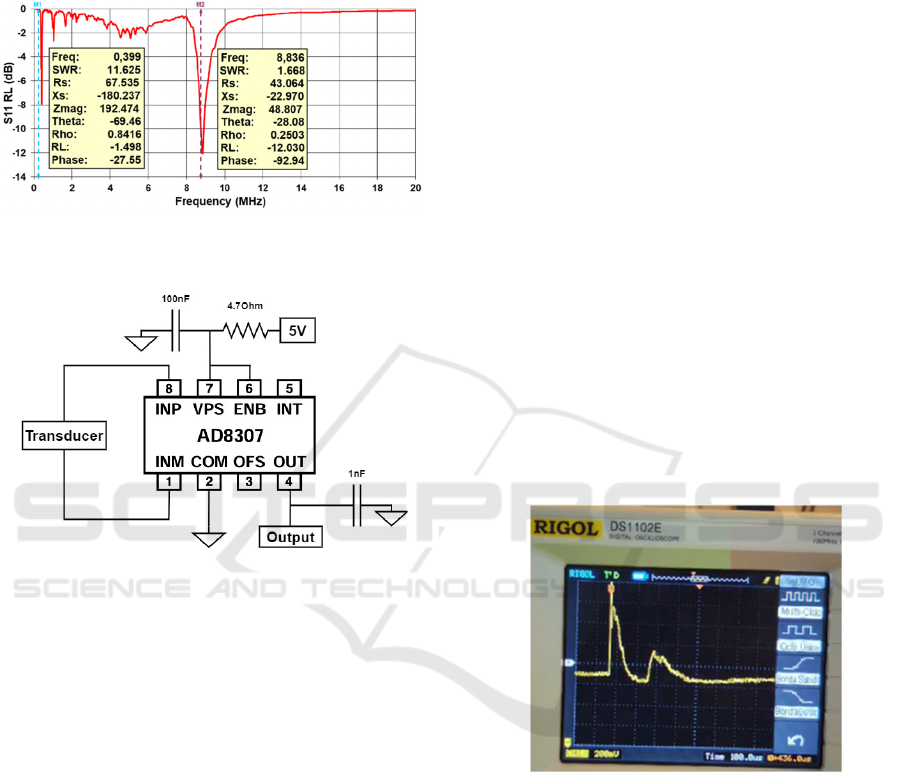
reflected electrical power. The transducer shows RL
peaks at 400 kHz and 8.8 MHz, corresponding to the
radial and thickness resonance frequencies,
respectively (Figure 2).
Figure 2: Return loss variation according to frequency for
the transducer from 10 kHz to 20 MHz.
Figure 3: Electrical diagram of the circuit implemented in
the amplifier.
2.2 AD8307 Amplifier
Typically, the PA signal induced by the nanosecond
pulse laser has very low intensity, requiring an
amplification circuit. For this purpose, the AD8307
integrated circuit was chosen. It is a complete 500
MHz monolithic demodulating logarithmic amplifier
based on the progressive compression (successive
detection) technique, providing a dynamic range of
92 dB to ±3 dB law conformance and 88 dB to a tight
±1 dB error bound at all frequencies up to 100 MHz.
This logarithmic amplifier is widely used in radio
frequency applications thanks to its vast list of
advantages. The AD8307 operates in a wide
frequency range, from DC up to 500 MHz, making it
suitable for both low and high-frequency
applications, and presents a wide dynamic range (-75
dBm to +15 dBm). It outputs a log-scale voltage
directly proportional to the signal power, eliminating
the need for extra circuits like rectifiers, filters, or log
converters. Compared to traditional coupling circuits
using standard operational amplifiers, the AD8307
provides an analogue output proportional to the input
energy and frequency without needing multiple
stages of amplification, attenuation, and additional
components to handle radiofrequency (RF) signals
and measure power over a wide range. In addition, it
requires minimal adjacent electronic components,
making it easy to integrate in pre-existent circuits.
The electrical diagram of the implemented circuit
is presented in Figure 3. A low-pass filter (12.7 kHz
cutoff frequency) was added to the amplifier output
to reduce high-frequency noise.
2.3 Signal Acquisition
The PA signal acquired by the amplification circuit
was initially displayed in an oscilloscope. After
validation, a signal acquisition system was
implemented using an algorithm to process the data.
For this purpose, an STM32H503RB development
board was used. This board was chosen due to its high
clock frequency, 250 MHz, which enables a very high
rate of data acquisition, thus providing a more
detailed data acquisition. This is essential for the
developed PA system since the duration of the
obtained signal is approximately 200 μs, as it can be
seen in the Figure 4.
Figure 4: Photoacoustic signal recorded by an oscilloscope.
After connecting the board to the amplification
circuit so that its output is connected to the boards’
analog to digital converter (ADC), and ensuring a
common ground between the two, the signal can be
acquired. It should be noted that the ADC has a
maximum resolution of 12 bits, meaning the highest
value it can return is 2
12
= 4095. Furthermore, given
that the maximum supported voltage by the ADC is
3.3 V, using a simple proportion, any value
transmitted by the ADC can be converted into a
voltage value using the following equation:
Voltage = (ADC value × 3.3) / 4095 (1)
EM4Health 2025 - Special Session on Electromagnetic waves for healthcare
1094
Regarding the implementation of the data
acquisition, firstly an array was created with its size
corresponding to the number of samples to be
acquired. After this, the board’s ADC is initialized
and waits to receive a value greater than 2000 to start
the acquisition. This condition was implemented to
ensure that only signals of interest are acquired;
without it, any interference, could trigger the
beginning of the process. The electromagnetic noise
caused by the laser firing is used as a trigger signal to
synchronize the STM with the photoacoustic system.
Once this condition is met, the acquisition begins, and
the array is filled. Once full, its values are transmitted
via the serial port and the array is restarted with its
values set to 0, thus allowing to restart the process,
according to the following commands:
#define array_size 2000
Void read_adc_array(){
…
HAL_ADC_Start(&hadc1);
while(val[0]<2000){
…
}
for(int i=0; i<array_size; i++){
val[i] =
(int16_t)HAL_ADC_GetValue(&hadc1);
}
HAL_ADC_Stop(&hadc1);
for (int i=0; i<array_size;i++){
…
HAL_UART_Transmit(&huart3,
uint8_t*)tx, strlen(tx), 200);
val[i]=0;
}
}
Since the data is being transmitted via serial port,
the next step is saving it to the computer. In a first
stage, the PUTTY software (v0.82) was used to
receive and store the received values, enabling the
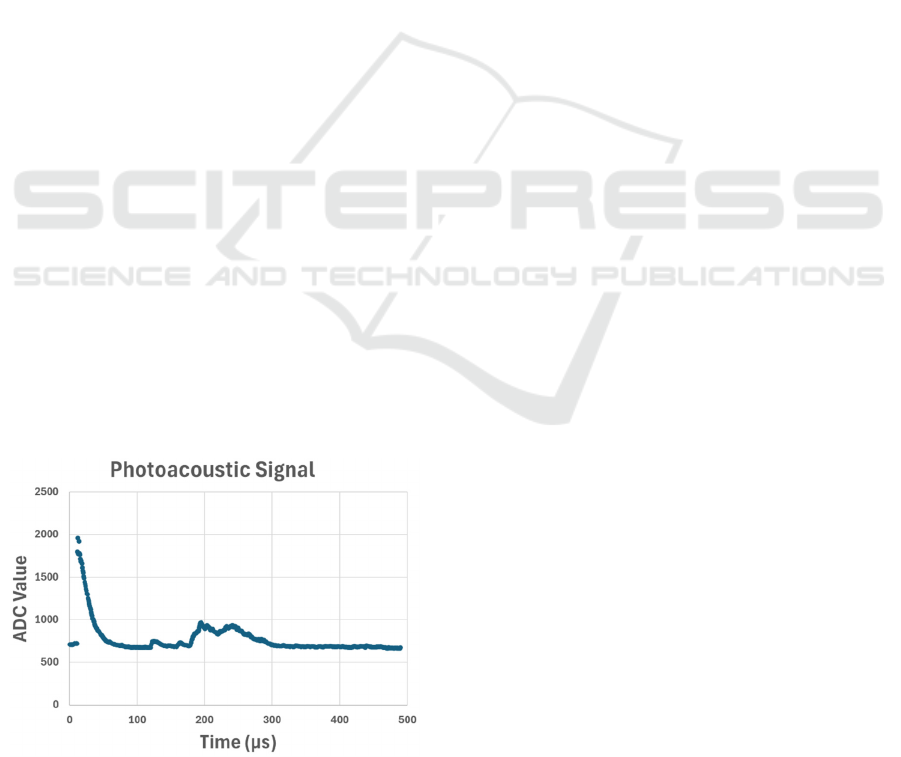
creation of the Figure 5 plot.
Figure 5: ADC values (a.u.), related to the generated
photoacoustic signal, acquired by the microcontroller over
time (µs).
2.4 Motor Control
Having confirmed the viability of the data acquisition
using the microcontroller, it was also chosen for
another critical task: to enable the imaging of a pre-
selected region of interest (ROI). To meet this
requirement, two motors were employed, each
responsible for moving the scanning system across an
(X,Y) plane. The selected motors are linear actuators
with a maximum boom of 3 cm, operating at a voltage
of 3.3 V. This allows for the coverage of a 9 cm
2
total
area, enough to analyse the entire ROI. Moreover,
their power can be directly supplied by the
microcontroller, as well as its control algorithm, thus
simplifying the project by not having to rely on an
external motor driver.
To control the actuators, it was first necessary to
determine their velocity, to calculate how long they
need to be activated to extend a given distance.
Through multiple tests, it was found that the actuators
take approximately 14.2 seconds to reach their
maximum length. Thus, it was calculated that to move
1 mm, the active time required is 473.3 ms.
Finally, each motor is connected to two General
Purpose Input/Output (GPIO) pins capable of
providing voltage values between 0-3.3 V. By
toggling these pins, the direction of the movement can
be changed, as well as stopping their motion:
Void move_x_axis(){
uint32_t startTime= HAL_GetTick();
uint32_t elapsedTime = 0;
while (elapsedTime < 473){
HAL_GPIO_WritePin(GPIOC,
GPIO_PIN10, GPIO_PIN_RESET);
HAL_GPIO_WritePin(GPIOC,
GPIO_PIN_12, GPIO_PIN_SET);
elapsedTime = HAL_GetTick() –
startTime;
}
}
The last step is to ensure that the motors are
moving in a pattern that allows them to cover a
predetermined area. For this, a loop was implemented
to control their movement in a grid-like motion:
Void grid_movement(){
for(int i=0;i<10;i++){
for(int j=0;j<10;j++){
move_y();
read_adc_array();
}
home_y();
move_x();
}
home_x();
home_y();
}
Low-Cost Photoacoustic System for Biomedical Applications
1095

2.5 User Interface
A command-line user interface has been developed to
facilitate an efficient and intuitive interaction with the
system. By default, the system is configured to
analyse the maximum area with a resolution of
500 μm per step. However, the interface provides
several configurable options to better align the
system's operation with specific application
requirements.
The available features include: a user guide to
explain how the system works, Step Size Adjustment
that enables modification of the resolution of the step
size and analysis area configuration that allows
customization of the area to be analysed, optimizing
the process for various applications (Figure 6).
Due to the resource limitations of the STM32
platform, all interactions are conducted through the
command-line interface, as implementing a graphical
user interface (GUI) would be impractical.
Parameters defined by the user via this interface are
automatically transferred to the accompanying
Python script running on a connected computer. This
ensures that the generated graphical output adheres to
the specified parameters.
Figure 6: Example of the User Interface.
2.6 Data Analysis
Having successfully acquired the required data using
the microcontroller and established a method for
controlling the system's position, the final step
involves implementing an algorithm to analyse the
data and present it in a clear and user-friendly
interface. To achieve that, a Python script was
developed to read the serial port of the computer, save
the received data locally on the machine and do the
necessary processing. Firstly, some parameters
needed to be set, namely the port being used, its baud
rate and the amount of data points being received. The
next step is to initialize the connection and read the
data:
try:
ser = serial.Serial(COM_PORT, BAUD_RATE)
print(f"Connected to {COM_PORT} at
{BAUD_RATE} baud.")
except serial.SerialException as e:
print(f"Error connecting to
{COM_PORT}: {e}")
exit()
After a successful connection, the data is stored in
an array which, when filled with the total points, is
saved in a .txt file.
while len(data) < TOTAL_POINTS:
line = ser.readline().decode('utf-8',
errors='ignore').strip()
file.write(line + "\n") # Save the line
to the file
Now that all the data has been received, some
conditioning needs to be done so that it reflects real-
world conditions. For now, the array is storing all the
values in the order they were transmitted but, since
every measurement consists of 2000 data points, the
main array needs to be subdivided into smaller ones
with 2000 entries each. After this subdivision has
taken place, the next step is to focus on the entries
which contain the photoacoustic signal. As seen on
Figure 5, the signal starts roughly 150 μs after the
electromagnetic discharge produced by the laser and
has a duration of 150-200 μs. To only interpret the
data points stored in those positions, the maximum
value of the array needs to be found:
def find_max_per_chunk(data,
chunk_size):
max_values = []
for i in range(0, len(data),
chunk_size):
chunk = data[i:i +
chunk_size]
max_values.append(max(chunk))
return max_values
Knowing in which position the electromagnetic spike
occurs, the next step is to trim the initial array that
contains 2000 entries into smaller ones that only
contain the values present from 150 μs to 300 μs.
Since we know that each entry occurs at intervals of
0.7 μs, we know that is going to be roughly taking
place around sample number 200-400.
EM4Health 2025 - Special Session on Electromagnetic waves for healthcare
1096
def extract_values_after_max(data,
chunk_size, offset_start, offset_end):
extracted_values = []
for i in range(0, len(data),
chunk_size):
chunk = data[i:i +
chunk_size]
max_idx = chunk.index(max(chunk
start_idx = max_idx +
offset_start
end_idx = max_idx + offset_end
if start_idx < len(chunk):
extracted_values.append(chu
nk[start_idx:min(end_idx, len(chunk))])
return extracted_values
offset_start = 200
offset_end = 400
values_after_max =
extract_values_after_max(data,
chunk_size, offset_start, offset_end)
The last step is to find the maximum value inside
these new chunks of data, which will tell us if there is
any PA response and represent it in a cartesian graph
that will allow the data visualization. The values are
presented in a grayscale where the minimum value is
represented by the color black and the maximum by
the color white.
3 EXPERIMENTAL SETUP FOR
THE PA SYSTEM TEST
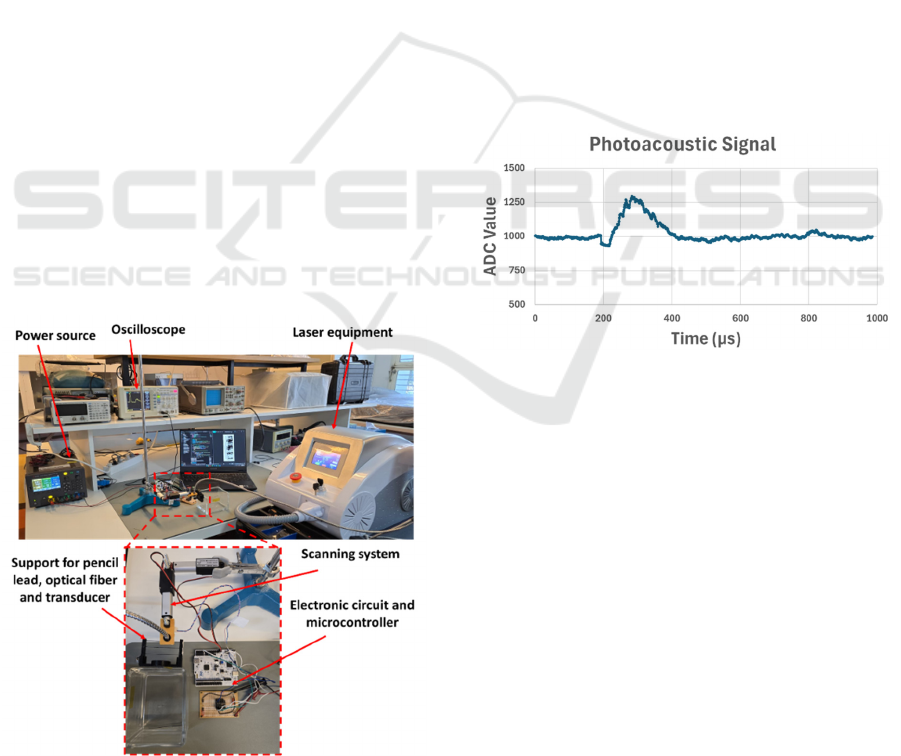
Figure 7: Setup for the experimental tests.
The experimental tests were conducted with the setup
shown in Figure 7, which comprises the power source
used to supply the amplifier circuit and the
microcontroller; the amplification circuit and the
STM32 H503RB; the support for sample, optical
fiber and transducer and the laser equipment,
responsible for the light excitation.
To validate the PA system, several pencil lead
phantoms were employed. A matrix of pencil lead
(Graphite HB 0.7 mm), arranged in 4 rows with a
spacing of about 5 mm, was fabricated using 3D
printed plastic holders. Using this solution allows us
to keep the low cost of the tests and ensure
reproducibility. In addition, the high content of
carbon in the pencil lead allows obtaining strong
photoacoustic signals (Zou et al., 2023).
4 RESULTS AND DISCUSSION
A first test with a single pencil lead was performed to
observe the maximum peak output and evaluate the
PA signal (Figure 8).
Figure 8: ADC values (a.u.), related to the generated
photoacoustic signal, after processing, as a function of time
(µs).
As can be seen, a constant signal was received by
the ADC with an approximate value of 1000, which
equates to 0.805 V (-57.8 dB). When the PA response
is triggered, a spike can be seen, reaching the value of
1300, which represents 1.05 V (-48 dB), an increase
of 0.245 V over the constant value generated by the
circuit. After the previous validation, a test with all
the modules was performed. A scanning area of 200
mm
2
was defined for the test, corresponding to an X
distance of 5 mm and an Y distance of 40 mm,
allowing measuring the PA response of four pencil
lead lines. One acquisition was made at each
coordinate, which was then processed to PA image
reconstruction. The schematic representation of the
main steps for data acquisition, processing and
reconstruction are presented in Figure 9.
Low-Cost Photoacoustic System for Biomedical Applications
1097
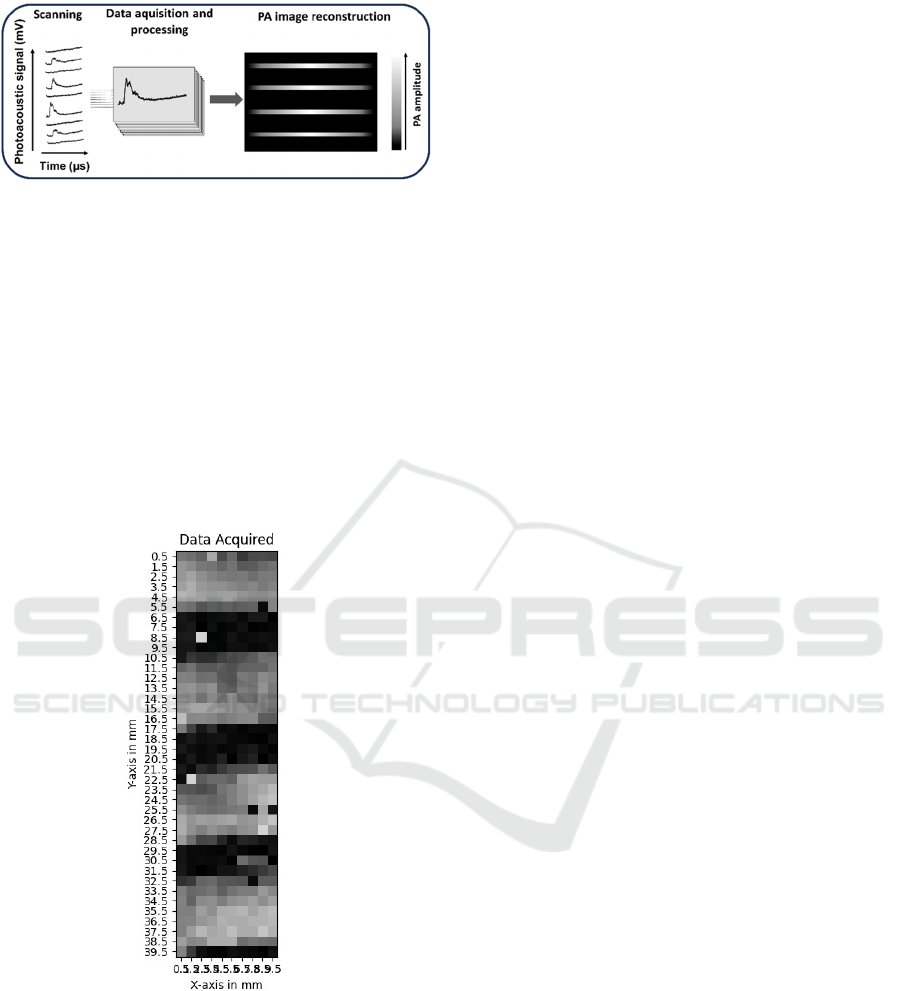
Figure 9: Schematic representation of the main steps of PA
image reconstruction.
The reconstructed final image, in Figure 10,
shows the capability of the developed system to map
the spatial distribution of all four targets (pencil lead),
where the color shifts from black to white. Although
it is possible to identify four distinct regions,
coinciding with the position of the graphite, the lateral
resolution presents some limitations in accurately
discriminating the separation between them. This
limitation can be improved by reducing the laser focal
point to decrease the irradiation area and increase the
potential of the developed system.
Figure 10: 2D Image reconstructed from the PA signals of
the four pencil leads.
5 BIOMEDICAL APPLICATIONS
OF PHOTOACOUSTIC
SYSTEMS
The developed PA imaging system can be used in
several biomedical applications, namely in
microfluidic lab-on-a-chip devices to monitor
haemoglobin quantities (Pinheiro et al., 2024), or in
organ-on-a-chip devices to provide, for example, a
mapping of the spatial distribution of drugs (such as
the antitumor drug doxorubicin) within cells or
tissues, in a continuous way. The real-time
monitoring of the cell’s response to new compounds
allows has potential to accelerate the clinical
translation of new vaccines and drugs. In addition, it
can have a significant impact on the understanding of
the efficiency of new drugs, which potential to lower
the amount of drugs needed for the treatment of
diseases, decreasing their side effects and ensuring
better population ageing conditions.
6 CONCLUSIONS
This paper presents a detailed characterization of the
development and validation of a low-cost
photoacoustic system, with high potential for future
application in biomedical devices.
Using pencil lead phantoms, the developed
system was able to detect the PA signals and
reconstruct the corresponding image with good
accuracy.
Future improvements are needed to increase the
lateral resolution of the system, namely with the use
of optical lenses to reduce the area of the incident
light.
ACKNOWLEDGEMENTS
This work has been supported by the project
DrugSENS (2022.02165.PTDC) (https://doi.org/10.
54499/2022.02165.PTDC), through national funds
(OE), within the scope of the Scientific Research and
Technological Development Projects (IC&DT)
program in all scientific domains (PTDC), through
the Foundation for Science and Technology, I.P.
(FCT, I.P). The authors also acknowledge the partial
financial support within the R&D Unit Project Scope:
UIDB/04436/2020. Susana Catarino, Paulo Sousa
and Vânia Pinto thank FCT for their contracts funding
provided through 2020.00215.CEECIND
(DOI: https://doi.org/10.54499/2020.00215.CEECIN
D/CP1600/CT0009), 2021.01086.CEECIND
(https://doi.org/10.54499/2021.01086.CEECIND/CP
1664/CT0008) and 2021.01087.CEECIND
(https://doi.org/10.54499/2021.01087.CEECIND/CP
1664/CT0020), respectively.
EM4Health 2025 - Special Session on Electromagnetic waves for healthcare
1098

REFERENCES
Attia, A. B. E., Balasundaram, G., Moothanchery, M.,
Dinish, U. S., Bi, R., Ntziachristos, V., & Olivo, M.
(2019). A review of clinical photoacoustic imaging:
Current and future trends. Photoacoustics, 16, 100144.
Beard, P. (2011). Biomedical photoacoustic
imaging. Interface focus, 1(4), 602-631.
Erfanzadeh, M., & Zhu, Q. (2019). Photoacoustic imaging
with low-cost sources; a review. Photoacoustics, 14, 1.
John, S., Hester, S., Basij, M., Paul, A., Xavierselvan, M.,
Mehrmohammadi, M., & Mallidi, S. (2023). Niche
preclinical and clinical applications of photoacoustic
imaging with endogenous contrast. Photoacoustics,
100533.
Singh, M. K. A., & Xia, W. (2020). Portable and affordable
light source-based photoacoustic tomography. Sensors
20(21), 6173.
Manwar, R., Kratkiewicz, K., & Avanaki, K. (2020).
Overview of ultrasound detection technologies for
photoacoustic imaging. Micromachines, 11(7), 692.
Pinheiro, B. R, Dinis, H. D., Catarino, S. O., Pinto, V. C.,
Sousa, P. J., & Minas, G. (2023, June). Experimental
Characterization of a Piezoelectric Transducer for
Integration into a Photoacoustic System. In 2023 IEEE
7th Portuguese Meeting on Bioengineering
(ENBENG) (pp. 84-87). IEEE.
Pinheiro, B., Pinto, V., Dinis, H., Belsley, M., Catarino, S.,
Minas, G., & Sousa, P. (2024). Development of a
Photoacoustic Acquisition System and their Proof-of-
Concept for Hemoglobin Detection. Heliyon.
Zhong, H., Duan, T., Lan, H., Zhou, M., & Gao, F. (2018).
Review of low-cost photoacoustic sensing and imaging
based on laser diode and light-emitting
diode. Sensors, 18(7), 2264.
Zhu, X., Menozzi, L., Cho, S. W., & Yao, J. (2024). High
speed innovations in photoacoustic microscopy. npj
Imaging, 2(1), 46.
Zhu, Y., Feng, T., Cheng, Q., Wang, X., Du, S., Sato, N., ...
& Kuniyil Ajith Singh, M. (2020). Towards clinical
translation of LED-based photoacoustic imaging: a
review. Sensors, 20(9), 2484.
Zou, E., Fang, C., & Song, D. (2023). A Low-Cost
Handheld Photoacoustic (PA) Probe for Rapid and
Non-Destructive Detection of Watermelon
Ripeness. IEEE Sensors Journal.
Low-Cost Photoacoustic System for Biomedical Applications
1099
