
Towards High-Fidelity ECG Generation:
Evaluation via Quality Metrics and Human Feedback
Maria Russo
1 a
, Joana Rebelo
1 b
, Nuno Bento
1 c
and Hugo Gamboa
1,2 d
1
Fraunhofer Portugal AICOS, Rua Alfredo Allen 455/461, 4200-135 Porto, Portugal
2
Laborat
´
orio de Instrumentac¸
˜
ao, Engenharia Biom
´
edica e F
´
ısica da Radiac¸
˜
ao (LIBPhys-UNL), Departamento de F
´
ısica,
Faculdade de Ci
ˆ
encias e Tecnologia da Universidade Nova de Lisboa, Monte da Caparica, 2829-516 Caparica, Portugal
Keywords:
ECG Synthesis, Deep Generative Models, Synthetic Data Evaluation, Human Feedback.
Abstract:
Access to medical data, such as electrocardiograms (ECGs), is often restricted due to privacy concerns and
data scarcity, posing challenges for research and development. Synthetic data offers a promising solution
to these limitations. However, ensuring that synthetic medical data is both realistic and clinically relevant
requires evaluation methods that go beyond general quality metrics. This study aims to overcome such chal-
lenges by advancing high-fidelity ECG data generation and evaluation, presenting an approach for generating
realistic ECG signals using a diffusion model and introducing a novel evaluation metric based on a deep learn-
ing evaluator model. The state-of-the-art Structured State Space Diffusion (SSSD-ECG) model was refined
through hyperparameter optimization, and the fidelity of the generated signals was assessed using quantitative
metrics and expert feedback. Complementary evaluations of diversity and utility ensured a comprehensive
assessment. The evaluator model was developed to classify individual synthetic ECG signals into four quality
classes and was trained on a custom-developed quality dataset designed for the generation of 12-lead ECG
signals. Results demonstrated the success in generating high-fidelity ECG data, validated by evaluation met-
rics and expert feedback. Correlation studies confirmed an alignment between the evaluator model and fidelity
metrics, highlighting its potential as a valid tool for quality assessment.
1 INTRODUCTION
Electrocardiograms (ECGs) are a cornerstone of car-
diovascular diagnostics, offering vital insights into the
electrical activity of the heart and playing a crucial
role in detecting a broad spectrum of cardiac condi-
tions (Di Costanzo et al., 2024). The accuracy and
reliability of these diagnoses depend heavily on ac-
cess to high-quality ECG data. However, the acquisi-
tion of real recordings is often constrained by privacy
concerns and data scarcity (Monachino et al., 2023).
To address these limitations, deep generative mod-
els have emerged as a promising solution, capable of
replicating data with similar structural patterns and
statistical characteristics. However, synthetic medical
data must be highly realistic, encompassing not only
statistical fidelity but also clinical interpretability and
practical utility (Murtaza et al., 2023).
Evaluating the quality of synthetic data is, there-
fore, a critical step. Current evaluation metrics for
a
https://orcid.org/0009-0001-9482-4566
b
https://orcid.org/0000-0003-0385-053X
c
https://orcid.org/0000-0001-7279-1890
d
https://orcid.org/0000-0002-4022-7424
time series data often focus on statistical comparisons
between synthetic and real datasets, potentially over-
looking complex signal features essential for accurate
medical interpretation. Clinicians may also struggle
to contextualize statistical criteria within a clinical
context, highlighting the need for more sophisticated
evaluation methods. These methods should ideally as-
sess data quality at the sample level rather than collec-
tively (Murtaza et al., 2023).
Alongside quantitative assessments, researchers
have emphasized the importance of qualitative eval-
uation by medical experts to identify discrepancies in
synthetic samples (Murtaza et al., 2023). As the most
reliable source of “ground truth”, clinical profession-
als provide invaluable insights into the realism of syn-
thetic ECG data (Stein et al., 2024).
In response to the previous needs, this study aims
to evaluate and enhance the generation of synthetic
ECG data using deep generative models, with a fo-
cus on achieving high realism. The approach includes
refining a state-of-the-art generative model using met-
rics that assess fidelity, diversity and utility. Addition-
ally, a novel sample-level evaluation metric is intro-
duced, emphasizing generation quality over artifacts
1154
Russo, M., Rebelo, J., Bento, N. and Gamboa, H.
Towards High-Fidelity ECG Generation: Evaluation via Quality Metrics and Human Feedback.
DOI: 10.5220/0013400500003911
Paper published under CC license (CC BY-NC-ND 4.0)
In Proceedings of the 18th International Joint Conference on Biomedical Engineering Systems and Technologies (BIOSTEC 2025) - Volume 1, pages 1154-1165
ISBN: 978-989-758-731-3; ISSN: 2184-4305
Proceedings Copyright © 2025 by SCITEPRESS – Science and Technology Publications, Lda.

and noise. Finally, the fidelity of the generated data
is validated using the newly developed metric and ex-
pert human feedback.
2 RELATED WORK
Over the years, various methods have been devel-
oped to generate synthetic ECG signals, with recent
deep learning (DL) advancements significantly sur-
passing traditional approaches and driving progress in
the biomedical field. Wulan et al. (2020) introduced a
Deep Convolutional Generative Adversarial Network
to generate realistic ECG signals, including various
heartbeat types. However, challenges like the require-
ment for R-peak-centered segments and limited scal-
ability to longer signals persisted. Dissanayake et al.
(2022) extended adversarial models to include inde-
pendent peak annotations and longer synthetic signals
with multiple R-peaks, addressing these limitations.
Similarly, Belo et al. (2017) utilized a Deep Neural
Network (DNN) with Gated Recurrent Units to syn-
thesize biosignals, including ECG, capturing subject-
specific traits and morphological details. Nishikimi et
al. (2023) further explored DNNs, leveraging a con-
ditional Variational Autoencoder to synthesize ECGs
efficiently using cardiac parameters.
More recently, diffusion models have introduced
remarkable approaches for time series modeling,
demonstrating outcomes that surpass their competi-
tors. Alcaraz and Strodthoff (2023) proposed the
Structured State Space Diffusion ECG (SSSD-ECG)
framework, which combines a conditional diffusion
model with structured state space sequences to syn-
thesize short 12-lead ECG signals. Their approach
excels in quantitative, qualitative, and human evalua-
tions. Inspired by SSSD-ECG, Zama and Schwenker
(2023) developed the Diffusion State Space Aug-
mented Transformer model, which also generates
conditional 12-lead ECG data, replacing S4 layers
with State Space Augmented Transformer layers. Ad-
ditionally, Neifar et al. (2023) developed a versa-
tile framework based on Diffusion Denoising Prob-
abilistic Models for ECG signal generation, imputa-
tion, and forecasting. Their approach uses efficient
conditioning encoding for seamless task transitions,
achieving promising results.
As generative models advance, it becomes in-
creasingly important to establish robust methods for
evaluating the quality of synthetic samples. Vari-
ous metrics have been proposed, but the choice de-
pends on the specific problem and domain. Stenger
et al. (2024) suggested categorizing these met-
rics into distribution-level, which assess data col-
lectively, and sample-level, which evaluate individ-
ual samples. Common distribution-level metrics in-
clude Average Euclidean Distance, Jensen-Shannon
Distance, and Maximum Mean Discrepancy. Sajjadi
et al. (2018) proposed a novel definition of preci-
sion and recall for distributions, based on the esti-
mated supports of real and synthetic data, separately
assessing quality (precision) and diversity (recall).
Kynk
¨
a
¨
anniemi et al. (2019) addressed limitations in
the previous metrics by introducing improved preci-
sion and improved recall, which better estimate real
and synthetic data distributions using non-parametric
methods, pairwise Euclidean distances, and k-nearest
neighbors in a high-dimensional feature space. More
recently, Naeem et al. (2020) highlighted the unre-
liability of newer precision and recall metrics, intro-
ducing density and coverage metrics as alternative ap-
proaches designed to be less vulnerable to outliers and
more computationally efficient.
For sample-level metrics, Dynamic Time Warp-
ing is commonly used for time series, as it captures
flexible similarities under time distortions. How-
ever, it can be sensitive to noise and outliers. Alaa
et al. (2022) proposed α-Precision and β-Recall,
which builds on the metrics proposed by Sajjadi et al.
through a refined soft-boundary classification. How-
ever, the authors of the SSSD-ECG framework have
raised concerns about these metrics, citing issues with
instability during the training of one-class embed-
dings, which significantly affected the results.
Turning the attention to ECG quality assessment,
both for real and synthetic signals, machine learn-
ing (ML) and DL techniques provide a more granular
approach to evaluating signal quality. Several stud-
ies have employed these techniques to assess various
quality aspects of ECG signals. For example, C. Liu
et al. (2018) and Athif and Daluwatte (2017), trained
ML classifiers to evaluate background noise, beat
consistency (detecting unexpected events), amplitude
range, and the identification of signals with missing
leads. Non-feature-based approaches, explored by G.
Liu et al. (2021) and Zhang et al. (2018), also ad-
dress these issues. These studies, which rely on the
PhysioNet/Computing in Cardiology Challenge 2011
dataset, indicate a shared focus on artifact and noise
detection, limiting their applicability in assessing the
quality of synthetic ECG signals. The evaluation met-
ric proposed in this study sets itself apart by specifi-
cally targeting the realism of individual ECG samples,
concentrating on the quality of the generated signals
rather than merely identifying noise and artifacts.
Towards High-Fidelity ECG Generation: Evaluation via Quality Metrics and Human Feedback
1155

3 METHODS
As illustrated in Figure 1, the methodology of this
study was structured around several key stages, in-
cluding data preprocessing, generative model im-
plementation, quality dataset construction, evaluator
model development, and a comprehensive evaluation.
ECG signals were initially preprocessed for train-
ing and evaluation purposes. The SSSD-ECG was
employed to produce highly realistic synthetic ECG
signals, which were subjected to both quantitative and
qualitative assessments. To train the proposed evalua-
tion metric, referred to as Evaluator Model, a custom
quality dataset was created. This model was specifi-
cally designed to classify synthetic ECG signals into
four distinct quality levels.
3.1 ECG Dataset
The dataset used in this study was sourced from the
“Will Two Do? Varying Dimensions in Electrocar-
diography: The PhysioNet/Computing in Cardiology
Challenge 2021” (Reyna et al., 2021), specifically
the Physikalisch-Technische Bundesanstalt (PTB)
source, for training and evaluating generative models.
The PTB-XL dataset was selected for its exten-
sive size and diversity, featuring 21,837 annotated 12-
lead ECG recordings, each 10 seconds long, collected
from 18,885 patients. Its gender-balanced composi-
tion, wide age range, and comprehensive pathology
coverage make it suitable for training robust models.
Each record was annotated by one or two cardiolo-
gists, who assigned multiple ECG statements based
on the SCP-ECG standard, covering form, rhythm,
and diagnostic categories. This research focused on
the diagnostic labels, which are organized hierarchi-
cally into five broad superclasses: Conduction Dis-
turbance (CD), Myocardial Infarction (MI), Hypertro-
phy (HYP), Normal (NORM), ST/T Change (STTC)
(Wagner et al., 2020).
While the PTB-XL dataset offers many advan-
tages, its multi-labeled signals presented a challenge
for this study, which focused exclusively on the five
diagnostic superclasses. To address this, only single-
label signals were selected, reducing the dataset size.
3.2 Data Preprocessing
The ECG signals from the PTB-XL dataset were pre-
processed to optimize data organization and prepare
labels for model training. First, signals were resam-
pled from 500Hz to 100Hz per lead, significantly re-
ducing data size while preserving essential features.
A moving average filter with a kernel size of 101 was
then applied to remove baseline wander by smooth-
ing the signals and subtracting the baseline. Each
ECG channel was standardized using z-score normal-
ization, centering the data around a mean of zero and
scaling it to a standard deviation of one. This ensured
uniform amplitude across all signals.
To reduce label complexity, signals with multiple
diagnostic class labels were excluded, resulting in a
dataset where each sample was assigned to a single
diagnostic superclass. The PTB-XL diagnostic la-
bels, originally based on SNOMED-CT codes, were
mapped to the five broad diagnostic superclasses and
then one-hot encoded to structure the model inputs.
Focusing on these five superclasses addressed practi-
cal constraints, as evaluating all 71 annotations avail-
able in the PTB-XL dataset would have been imprac-
tical for clinical experts.
3.3 Quality Dataset
To develop an evaluation metric capable of assessing
the quality of synthetic ECG data on a sample-by-
sample basis required a dataset meeting two criteria:
(1) a large number of 12-lead ECG records to sup-
port the training of the DL model and (2) clear de-
tailed descriptions of quality levels to ensure the met-
ric focuses on generation quality rather than artifacts
or noise.
Two databases were initially considered: the Phy-
sioNet/Computing in Cardiology Challenge 2011 and
the Brno University of Technology ECG Quality
Database (BUT QDB). Unfortunately, neither dataset
fully met these criteria, as each lacked one of the two
essential requirements. So there was a need to con-
struct a custom quality dataset from scratch.
The custom dataset was inspired by the classifica-
tion system of the BUT QDB and organized into four
distinct classes based on ECG characteristic waves.
Examples of each class are illustrated in Figure 2 and
described as follows:
Figure 1: Overview of the methodology.
SyntBioGen 2025 - Special Session on Synthetic biosignals generation for clinical applications
1156

• Class 1. Signals that do not resemble ECGs.
• Class 2. Signals similar to ECGs, but only show
discernible R peaks, with other waves obscured
by noise.
• Class 3. Signals that resemble ECGs with visible
periodic R waves and most other waves observ-
able, but containing conceptual errors that result
in highly improbable ECG patterns.
• Class 4. Real ECG signals.
For Class 1, signals were created using a mix of
basic wave functions, such as sine, triangular, rect-
angular, and sawtooth waves, each with varying lev-
els of noise. Class 2 samples were generated using a
GAN model trained with a reduced number of epochs.
Class 3 was produced with a specific configuration of
the SSSD-ECG model to ensure higher fidelity, de-
tailed in Section 3.4. Class 4 consisted of real signals
from the PTB-XL database. Every class has approxi-
mately 10,000 samples, except for Class 3 which has
176 samples, due to the manual selection of the sam-
ples that met the required characteristics.
3.4 Structured State Space Diffusion
ECG
The SSSD-ECG model, developed by Alcaraz and
Strodthoff (2023), represents a state-of-the-art frame-
work for ECG generation, leveraging conditional dif-
fusion models and structured state space dynamics. In
their original paper, the model excelled across various
evaluation contexts, including qualitative, quantita-
tive, and expert assessments. This success was the pri-
mary reason for its selection in this study. The SSSD-
ECG was applied with two specific objectives: (1)
produce signals for Class 3 in the quality dataset and
(2) generate highly realistic ECG samples for subse-
quent evaluation by clinical experts.
To accomplish the desired results for both ob-
jectives, several hyperparameters were adjusted and
tested across different configurations. Table 1 pro-
vides an overview of the hyperparameters explored
during the experiments, along with their respective
tested values. To isolate the impact of each vari-
able, only one hyperparameter was modified at a time.
Synthetic ECG samples were then generated for each
configuration and evaluated using the improved preci-
sion, improved recall, density, and coverage metrics.
Table 1: SSSD-ECG hyperparameters tested during opti-
mization and their respective values.
Hyperparameter Values
Diffusion Steps T 300, 1000
Residual Layers 24, 48
Label Embedding Dimension 256
Batch Size 4
Diffusion Step Embedding Dim. In 256
S4 State Dimension 128
S4 Dropout 0.2
S4 Layer Normalization 0 (disable)
S4 Bidirectional 0 (disable)
One of the most effective configurations was
determined by combining the hyperparameters that
yielded the best results based on the quantitative eval-
uation metrics. The key hyperparameters identified
were the number of diffusion time steps, the num-
ber of residual layers, and the dimension of the la-
bel embedding. While these three parameters signifi-
Figure 2: Representative examples for each class in the Quality Dataset.
Towards High-Fidelity ECG Generation: Evaluation via Quality Metrics and Human Feedback
1157

cantly enhanced the generation capacity of the model,
further optimization was achieved by increasing the
number of diffusion time steps. This refined config-
uration, referred to as best hyperparameter combina-
tion, is detailed in Table 2.
In order to accelerate the clinical evaluation pro-
cess, the samples provided to the experts were gen-
erated using the model that demonstrated the highest
performance at the time, which was configured with
the original hyperparameter settings. Subsequent ex-
periments focused on further refining the model, ulti-
mately leading to the identification of the best hyper-
parameter combination.
For generating Class 3 signals, the configuration
with 24 residual layers was specifically chosen based
on visual inspection of the generated signals. This
setup was selected as it best met the criteria for accu-
rately populating this class.
Table 2: SSSD-ECG best hyperparameter configuration.
Hyperparameter Value
Diffusion Steps T 1000
Residual Layers 48
Residual Channels 256
Skip Channels 256
Diffusion Embedding Dim. 1 128
Diffusion Embedding Dim. 2 512
Diffusion Embedding Dim. 3 512
S4 State Dimension 64
S4 Dropout 0
S4 Layer Normalization 1
S4 Bidirectional 1
Label Embedding Dimension 256
3.5 Evaluator Model
The proposed evaluator model represents a novel
evaluation metric designed to assess the quality of
synthetic ECG data at the sample level. Unlike con-
ventional metrics, which often require manual feature
extraction and statistical comparisons across datasets,
this model classifies each signal individually into one
of the four classes from the quality dataset.
The model was developed using ensemble DL
techniques and consists of five neural networks, each
initialized with a random seed from the range [42–46]
to ensure diversity. While all networks share the
same architecture, they are independently initialized.
Each network comprises five one-dimensional convo-
lutional layers, followed by Leaky ReLU activation
functions with a negative slope of 0.2 and dropout
layers with a rate of 0.3. The convolutional layers
use a kernel size of 4, a stride of 2, and padding of 1,
except for the final convolutional layer, which uses a
stride of 1 and no padding. A flatten operation is then
applied to convert the output into a one-dimensional
vector for classification. During training, signals are
passed through the networks, and the output is com-
pared to the target label using cross-entropy loss. The
Adam optimizer is then used to adjust the weights and
biases, minimizing this loss.
The training data used to develop this model was
sourced from the custom quality dataset described
earlier, where it was observed that Class 3 contained
fewer signals than other classes. To address this im-
balance, class weights were calculated and applied
during the training process. This adjustment ensured
that the underrepresented classes were given propor-
tionally higher weights, allowing the model to learn
better from the fewer signals available and reducing
bias toward the more frequent classes.
Since ensemble learning enhances prediction per-
formance by combining multiple models, it was es-
sential to define an effective strategy for aggregating
predictions. Therefore, soft voting was implemented,
averaging the class label probabilities across all mod-
els. The class with the highest average probability is
then selected as the final prediction, effectively con-
sidering the confidence levels of all model predictions
(Mahajan et al., 2023).
This approach adds a privacy layer of data protec-
tion by reducing the need for access to sensitive real
data during evaluation. Traditional metrics typically
require access to both real and synthetic datasets,
which poses privacy risks, especially when the real
data contains sensitive information. In contrast, this
method relies solely on the model’s weights and the
generated synthetic data for evaluation. Although the
model is trained using both real and synthetic data to
capture the underlying patterns effectively, it does not
expose the raw features or contents of the real dataset
during the evaluation phase.
Additionally, while prior works such as G. Liu et
al. (2021) and Zhang et al. (2018), have used DL
techniques to assess ECG quality, their focus was pri-
marily on noise and artifact detection, which limits
their applicability to synthetic signals. In contrast,
the evaluator model was specifically designed with
diverse waveform characteristics and targets the real-
ism of the generated ECG samples, providing a more
comprehensive assessment of signal quality beyond
noise and artifacts.
SyntBioGen 2025 - Special Session on Synthetic biosignals generation for clinical applications
1158

3.6 Evaluation
Assessing the quality of time series generation is a
multidimensional task, covering various aspects such
as fidelity, diversity, and utility (Stenger et al., 2024).
The main goal of this work was to produce realistic
synthetic ECG samples using the SSSD-ECG model.
Therefore, the focus was primarily on fidelity, by
evaluating how closely the generated samples resem-
ble real ECG signals. In addition, the diversity of
the synthetic dataset was also evaluated to ensure that
the samples represent the full variability of the real
data. Moreover, the utility of the synthetic data was
assessed through several classification tasks.
To complement the quantitative metrics, the gen-
erated signals were also subjected to qualitative evalu-
ation by clinical experts through a questionnaire, pro-
viding expert feedback on the realism of the data.
Finally, classification metrics, including accuracy,
F1-score, and the confusion matrix, were used to as-
sess the performance of the evaluator model. The cor-
relation between the evaluation metrics for synthetic
data and the evaluator was analyzed to determine if
the model aligns with the state-of-the-art metrics. Ad-
ditionally, the relationship between the human evalu-
ation and the evaluator was also studied.
3.6.1 Fidelity and Diversity
The metrics used to assess the fidelity of the gener-
ated data were improved precision and density, while
improved recall and coverage metrics were used to
evaluate diversity. Density and coverage were pro-
posed by Naeem et al. (2020), whereas improved
precision and improved recall were introduced by
Kynk¨a¨anniemi et al. (2019). For simplicity,
throughout this work, improved precision and im-
proved recall will be referred to as precision and re-
call, respectively. The implementation was adapted to
use 5 nearest neighbors (k=5) and 200 samples from
each diagnostic class for both real and synthetic data,
ensuring a balanced dataset.
During the experiments conducted to optimize
the performance of the SSSD-ECG model, each ex-
periment produced corresponding fidelity and diver-
sity results for the synthetic data generated. The
real dataset used for comparison remained consistent
across all experiments.
To compute the metrics, features from multiple
domains, such as statistical, spectral, and temporal,
were extracted using the Time Series Feature Extrac-
tion Library (TSFEL) version 0.1.7, a Python package
optimized for automatic feature extraction from time
series data (Barandas et al., 2020).
3.6.2 Utility
The utility of the synthetic dataset was evaluated
through a classification task using the Train on Real,
Test on Synthetic (TRTS) and Train on Synthetic, Test
on Real (TSTR) metrics proposed by (Esteban et al.,
2017), as well as the additional Train on Synthetic,
Test on Synthetic (TSTS) metric, introduced in the
work of (Fekri et al., 2019).
The supervised classification task was carried out
using a Random Forest classifier, and features were
extracted from both the real and synthetic datasets us-
ing the TSFEL library (Barandas et al., 2020). For
baseline comparisons, the classifier was trained and
tested on real data, with the dataset divided into train-
ing and test sets. A test size of 30% was consistently
used across all classification tasks.
From these evaluations, three performance mea-
sures were derived and analyzed:
• TSTR. This metric assesses the capacity of syn-
thetic data to replace real data by evaluating how
well a model trained on generated samples per-
forms when tested on real ones.
• TRTS. This metric measures the realism of syn-
thetic samples by training the classifier on real
data and evaluating its performance on synthetic
data.
• TSTS. This metric evaluates the internal consis-
tency of the synthetic dataset by measuring how
well a model trained on synthetic samples gener-
alizes to unseen synthetic data.
3.6.3 Human Evaluation
The human evaluation specifically targeted the real-
ism of the synthetic dataset, as realism is a prop-
erty for which humans can provide an unequivocal
“ground truth” (Stein et al., 2024). To validate the
realism of synthetic ECG samples generated by the
SSSD-ECG model, a structured questionnaire was de-
veloped using Microsoft Forms. The questionnaire
featured 20 images of ECG tracings – 10 synthetic
signals from the generative model and 10 real signals
from the PTB-XL database. The study involved eval-
uations by three clinical experts: a cardiologist with
over 10 years of experience, an internist with less than
5 years of experience, and a final-year medical stu-
dent.
Each tracing was paired with a set of questions,
beginning with an inquiry about the nature of the sig-
nal. The respondents were asked to indicate whether
they believed the tracing to be an ECG or not. If
uncertain, they could select the ‘Not sure’ option,
which allowed them to proceed to the next image.
Towards High-Fidelity ECG Generation: Evaluation via Quality Metrics and Human Feedback
1159

For tracings identified as ECG, participants were then
asked to classify the tracing into one of several di-
agnostic categories: Normal, Myocardial Infarction,
ST/T change, Hypertrophy, or Conduction Distur-
bance. These categories correspond to the five super-
classes used to classify the PTB-XL data in terms of
disease diagnosis.
If a tracing was not recognized as an ECG, the
clinical experts were asked to evaluate its quality by
selecting one of the following options, which cor-
respond to the quality levels defined in the quality
dataset:
• Noise (Class 1). the tracing does not resemble an
ECG, and the R waves are not reliably observable.
• Clearly not an ECG (Class 2). periodic R waves
are visible in some leads, but other ECG waves
are not clearly identifiable.
• Almost an ECG (Class 3). periodic R waves are
visible, and most of the waves can be observed,
but there are conceptual errors resulting in highly
unlikely ECG patterns.
The signals selected for the questionnaire were
chosen to represent the diversity within the dataset.
To achieve this, a method employing a nearest neigh-
bors model was used. This approach measured the
dissimilarity between samples using Euclidean dis-
tance in high-dimensional feature space, with the goal
of iteratively selecting the most unique signals. A to-
tal of 20 signals were selected, with two signals from
each of the five diagnostic superclasses for both real
and synthetic signals, ensuring balanced representa-
tion. This selection promoted diversity across the
dataset while limiting the total number of signals to
20 to avoid overburdening human evaluators during
the questionnaire. Each selected sample was reviewed
to ensure it accurately reflected the diverse character-
istics of the dataset.
4 RESULTS AND DISCUSSION
Considering the main goal of this work was to achieve
high fidelity, the synthetic signals were evaluated us-
ing metrics specifically focused on this aspect, while
diversity and utility were assessed as complementary
measures. Next, the realism of the generated dataset,
evaluated by medical experts, was analyzed. Finally,
the performance of the proposed evaluation metric
was assessed, with a focus on its alignment with qual-
ity metrics and human evaluators.
4.1 Fidelity and Diversity
In initial experiments, the original hyperparameters
from the SSSD-ECG paper were used to gener-
ate synthetic ECG signals, which were subsequently
provided to clinical experts for qualitative assess-
ment. While awaiting feedback, additional experi-
ments were conducted to enhance the realism of the
synthetic signals, resulting in the identification of a
best set of hyperparameters, detailed in Section 3.4.
Fidelity and diversity were quantitatively assessed
using precision, recall, density, and coverage met-
rics, comparing the two hyperparameter configura-
tions across the five diagnostic classes. The results
are detailed in Table 3.
The average precision of the synthetic ECG sig-
nals increased substantially from 0.57 with the origi-
nal hyperparameters to 0.94 with the best configura-
tion. In addition, the density metric improved across
all diagnostic classes, with several exhibiting values
greater than 1. Consequently, the overall average den-
sity increased significantly from 0.80 to 3.85. These
values indicate that the model is generating more syn-
thetic samples in proximity to real data points.
While these improvements in fidelity are signif-
icant, examining the diversity of the generated sig-
nals is essential for a holistic comprehension of the
performance of the model. Although recall improved
with the best set of hyperparameters, it remained low.
In contrast, the coverage metric showed notable im-
provements across all diagnostic categories. These
results suggest that, although some synthetic samples
may lie outside the real data space (reflected by low
recall), the model is still capable of generating a di-
verse set of samples that cover the majority of the data
space.
After analyzing both the fidelity and diversity re-
sults, it is evident that the best hyperparameter con-
figuration has successfully achieved the goal of gen-
erating synthetic ECG signals that exhibit statistical
characteristics similar to those of real ones. As con-
firmed by high precision and density values. How-
ever, the lower recall and higher coverage scores in-
dicate that while the model generates a broad array of
signals (high coverage), many real points are still not
represented in the synthetic dataset (low recall). This
limitation highlights the need for future work to en-
hance the diversity of the synthetic signals to better
capture the full range of characteristics present in real
data.
SyntBioGen 2025 - Special Session on Synthetic biosignals generation for clinical applications
1160

Table 3: Comparison of precision, recall, density, and coverage values across the diagnostic classes for two hyperparameter
configurations: the original and the best-performing.
Diagnostic Class
Original Hyperparameters Best Hyperparameters
Precision Density Recall Coverage Precision Density Recall Coverage
CD 0.65 0.99 0.00 0.25 0.97 4.15 0.01 0.83
HYP 0.03 0.01 0.01 0.03 0.95 3.13 0.02 0.95
MI 0.95 1.41 0.00 0.32 0.89 2.73 0.03 0.79
NORM 0.28 0.17 0.00 0.06 0.90 3.99 0.04 0.91
STTC 0.95 1.43 0.00 0.27 0.98 5.25 0.06 0.99
Mean 0.57 0.80 0.00 0.19 0.94 3.85 0.03 0.89
4.2 Utility
Synthetic datasets are often designed for specific ML
applications, and their usefulness can be assessed by
evaluating how effectively they support these applica-
tions. In this study, the utility of the synthetic data was
evaluated by performing several classification tasks
with a Random Forest classifier, as detailed in Sec-
tion 3.6.2 and summarized in Table 4.
Table 4: Macro average F1-score for classification on real
and synthetic datasets.
Test on Real Test on Synthetic
Train on Real 56.58% 57.03%
Train on Synthetic 40.84% 78.00%
The classifier trained on real data has nearly iden-
tical performance when tested on both real (56.58%)
and synthetic data (57.03%). These results indicate
that the synthetic dataset seems to preserve the char-
acteristics of the real one, confirming the realism of
the generated samples.
The model trained on synthetic data performed
significantly better on synthetic data (78.00%) com-
pared to real data (40.84%). This suggests that while
data conditioning produces consistent results, it may
lack generalization when applied to real-world sce-
narios. This limitation may be due to the lower values
of the diversity metrics. Nevertheless, the synthetic
data still displays some quality, despite of not being
able to fully replace real data in practical applications.
Examining the entire scope, the high similarity be-
tween the performance on real and synthetic data sug-
gests the synthetic dataset replicates many patterns
from the real dataset. This is a positive indication of
its quality and aligns with the main goal of this disser-
tation. However, its utility is more limited for training
models intended for real-world applications.
4.3 Human Expert Evaluation
To complement the quantitative metrics, three clini-
cal experts assessed the realism of the synthetic sig-
nals through a questionnaire detailed in Section 3.6.3.
The primary task was to classify each ECG tracing as
either real or synthetic, with follow-up questions tai-
lored to their responses.
Individual evaluations were first analyzed, cate-
gorizing the outcomes into four groups: real signals
correctly identified, real signals misclassified as syn-
thetic, synthetic signals misidentified as real, and syn-
thetic signals correctly classified, as illustrated in Fig-
ure 3. The responses were then collectively analyzed
using majority voting. Notably, experts could select
‘Not sure’ when uncertain about the nature of the sig-
nal. Although only one expert chose this option, for
statistical analysis, ‘Not sure’ was treated as a posi-
tive classification, indicating that the signal had suffi-
ciently realistic characteristics to cause indecision and
was therefore considered real.
Examining individual cases, medical expert A
classified all 20 signals as real, without considering
any as synthetic. Clinician B correctly identified 8
real signals but also classified 8 synthetic signals as
real. The final evaluator classified 5 real ECG trac-
ings as real but labeled the other 5 as synthetic, and 4
synthetic ECGs were classified as real. These results
highlight the realistic characteristics and patterns of
the synthetic signals, as most were perceived as real.
Taking a holistic view, the majority of the three
clinicians identified 8 out of 10 synthetic signals as
real, while 2 out of 10 real signals were misclassified
as synthetic. This underscores the high degree of re-
alism in the synthetic data, aligning with previously
evaluated metrics of precision and density. Moreover,
the difficulty clinicians faced in distinguishing real
from synthetic signals highlights the challenge posed
by the realistic nature of the generated data.
For the analysis of the second set of follow-up
questions, only the feedback from two medical ex-
Towards High-Fidelity ECG Generation: Evaluation via Quality Metrics and Human Feedback
1161
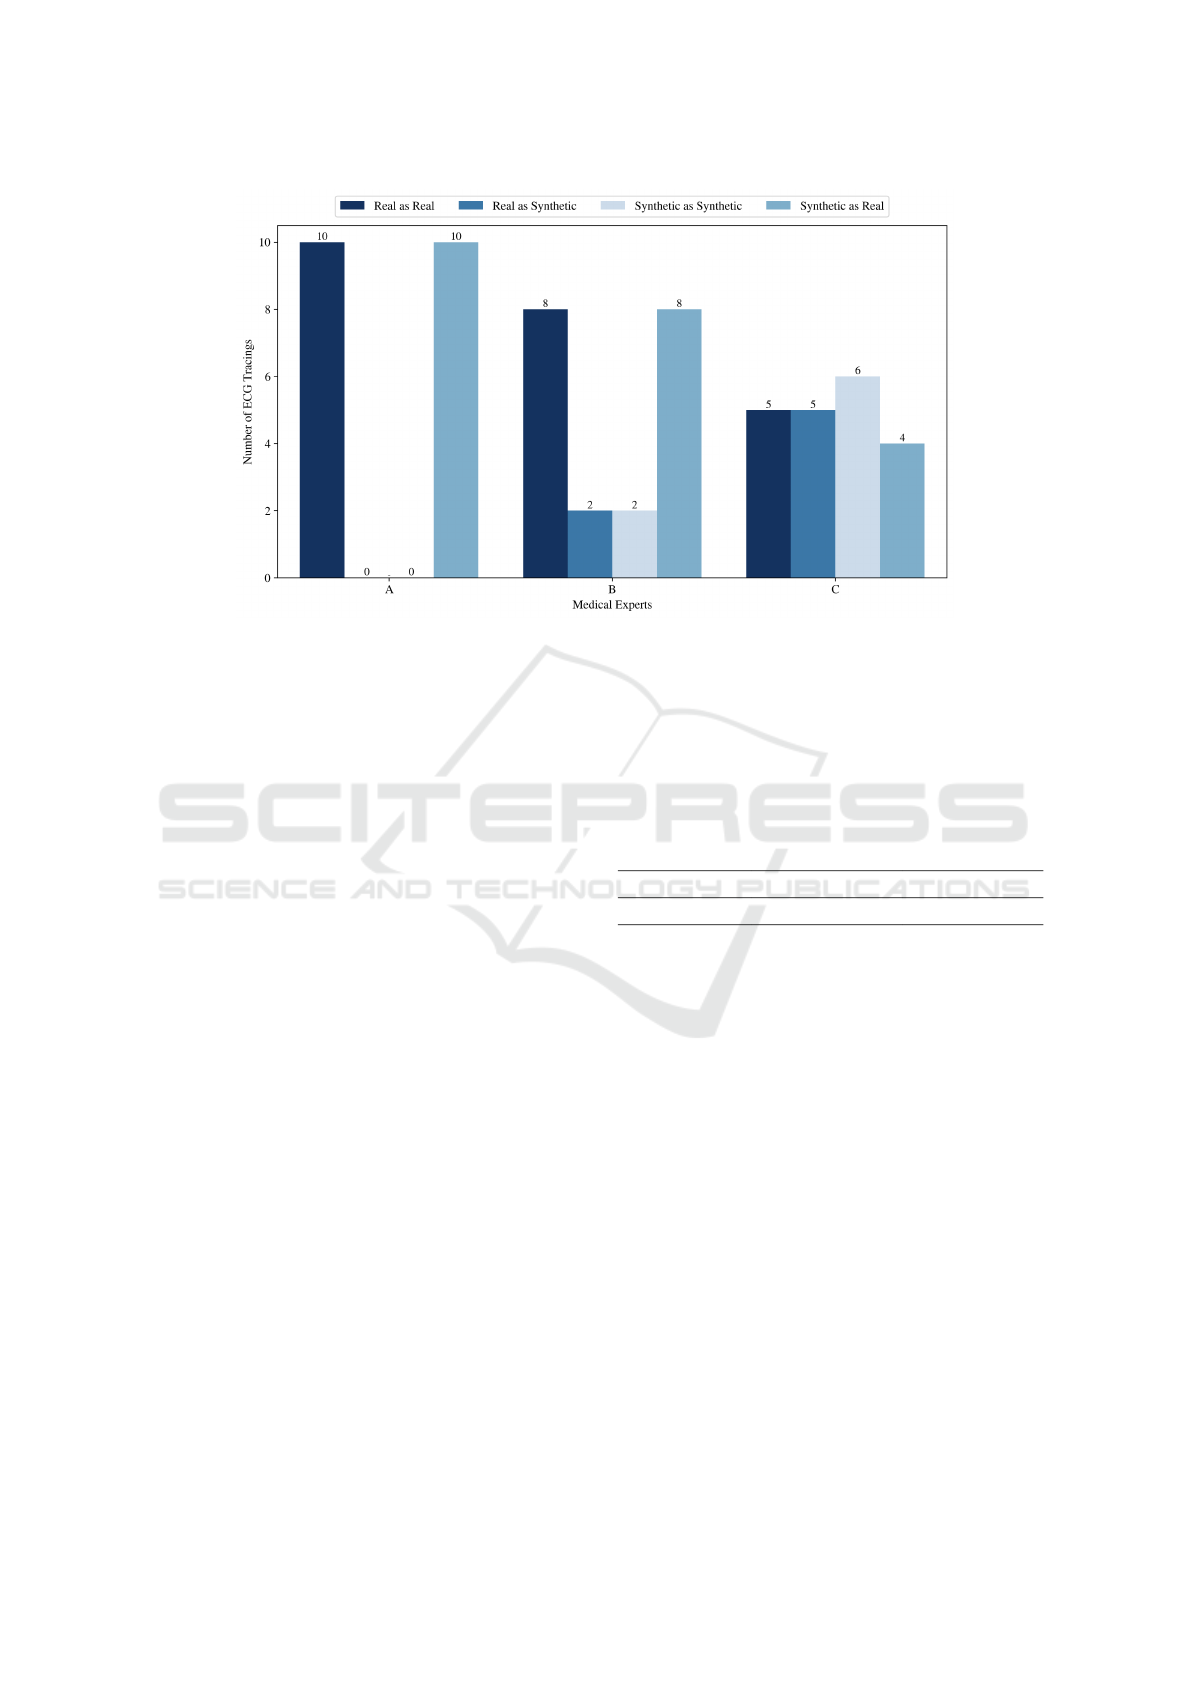
Figure 3: Classification of real and synthetic ECG signals by clinical experts.
perts was considered, as there was no information
from one clinician. As mentioned, 8 out of 10 syn-
thetic signals were mistaken for real ones, while the
remaining two were correctly classified as synthetic.
According to the evaluators, these two synthetic sam-
ples fell into the ‘Noise’ quality level (Class 1), char-
acterized by the absence of observable R waves. This
finding indicates that although most synthetic signals
successfully reproduce the characteristics of real sig-
nals, those with lower realism are readily recognized
as synthetic. Furthermore, the analysis of the syn-
thetic signals classified as real revealed a lack of con-
sensus among the clinicians regarding the assigned di-
agnostic categories. This inconsistency suggests that
the conditional aspect of the generative model may
not be functioning as intended.
In conclusion, human evaluation provides prelim-
inary evidence supporting the effectiveness of the
SSSD-ECG model in generating realistic ECG sig-
nals. Although the evaluation involved only three
clinicians, the results suggest that the synthetic data
demonstrates sufficient quality to merit further explo-
ration.
4.4 Evaluator Model Assessment
The evaluator model performance in distinguishing
synthetic ECG signals across four quality classes was
assessed, achieving a mean accuracy of 99.99% and
an average F1-score of 99.70%.
Another approach to assess the performance of
the evaluator model involved exploring its relation-
ship with key evaluation metrics such as precision,
density, recall, and coverage, through the Pearson cor-
relation method. The correlation values presented in
Table 5, show that the evaluator model exhibits strong
correlations with precision (0.88) and density (0.72),
metrics that emphasize fidelity. This alignment under-
scores the evaluator capacity as a sample-level fidelity
assessment tool.
Table 5: Correlation values between evaluator model and
evaluation metrics precision and density.
Precision (p-value) Density (p-value)
Evaluator model 0.88 (p < 0.001) 0.72 (p < 0.01)
Another interesting perspective emerged from an-
alyzing the relationship between the evaluator model
and the medical experts, since both classified samples
individually. This alignment made it logical to evalu-
ate the fidelity of synthetic ECG signals by comparing
the performance of the evaluator model to that of the
experts on the same classification task.
The results, illustrated in Figure 4, reveal that the
evaluator model correctly identified 7 real signals and
classified 7 synthetic signals as real. Demonstrating a
notable degree of similarity with the medical experts,
who also misclassified 8 synthetic signals as real. In
addition, both the evaluator model and the experts ex-
hibited some difficulty in distinguishing certain real
signals as real. The alignment in performance be-
tween the evaluator model and the human evaluators
supports the conclusion that synthetic data closely re-
sembles genuine ECG tracings, reinforcing their fi-
delity.
SyntBioGen 2025 - Special Session on Synthetic biosignals generation for clinical applications
1162

Figure 4: Confusion matrix for the classification of signals
by the evaluator model.
In summary, the strong correlation with estab-
lished evaluation metrics and the similar performance
with clinical experts reinforce the potential of the
evaluator model as a robust tool for assessing the
quality of synthetic ECG signals at a sample level.
5 CONCLUSION
In healthcare, synthetic data has shown potential to
improve patient care by supporting clinical research
and advancing the development and training of ML
models for diagnostic support systems. However,
medical data must be of high quality and have clin-
ical relevance, as it can significantly impact patient
outcomes. As a result, evaluating the quality of gener-
ated data becomes a crucial yet ambiguous step, since
there is no standard procedure for assessing the qual-
ity of synthetic datasets.
Considering the challenges outlined above, this
work introduces an approach for generating and eval-
uating highly realistic ECG signals. The SSSD-ECG
model successfully produced synthetic samples that
closely resemble real ECG samples, with validation
from quantitative metrics and expert feedback. How-
ever, while the synthetic data demonstrated high fi-
delity, its utility in real-world applications for training
models was more limited, likely due to issues with di-
versity. Despite these limitations, the research priori-
tized realism, and several criteria support the conclu-
sion that the synthetic ECG data is sufficiently realis-
tic, demonstrating its potential for further exploration.
This study also introduced a novel evaluator
model capable of assessing synthetic ECG signals
at the sample level, offering a different perspective
than traditional distribution-based metrics. The align-
ment of this model’s results with expert evaluations
and state-of-the-art methods underscores its effective-
ness. These findings not only validate the quality of
the synthetic data but also demonstrate the evaluator
model capacity as a potential tool for fidelity assess-
ment. The evaluator model was trained using a quality
dataset also developed in this research.
Although the results are promising, there are cer-
tain limitations and opportunities for future research
to address. The SSSD-ECG model, while effective in
generating realistic ECG signals, still faces challenges
with the diversity of the generated samples. This lim-
itation is reflected in the low recall values, which sug-
gest that the model struggles to fully replicate the va-
riety of real ECG data. Moreover, the small number of
clinical evaluators involved in the validation process
limits the robustness of the results, therefore future
work should include a larger pool of experts. Another
area for improvement is the evaluator model. Ex-
panding its capabilities to assess whether diagnostic
labels of real signals are correctly assigned would en-
hance the evaluation of the conditional component of
the model. Furthermore, exploring other sample-level
metrics for synthetic data evaluation could provide a
more nuanced understanding of data quality.
In conclusion, this work addresses challenges in
generating and evaluating synthetic ECG data. While
there are areas for improvement, high-quality medical
data remains essential for research and development
of models for real-world applications. By advancing
towards high-fidelity ECG data generation and evalu-
ation, this research paves the way for future innova-
tions in the field.
ACKNOWLEDGEMENTS
This work was funded by AISym4Med project num-
ber 101095387, supported by the European Health
and Digital Executive Agency (HADEA) under the
authority delegated by the European Commission.
REFERENCES
Alaa, A., Van Breugel, B., Saveliev, E. S., and van der
Schaar, M. (2022). How faithful is your synthetic
data? sample-level metrics for evaluating and audit-
ing generative models. In International Conference
on Machine Learning, pages 290–306. PMLR.
Alcaraz, J. M. L. and Strodthoff, N. (2023). Diffusion-based
conditional ecg generation with structured state space
models. Computers in Biology and Medicine, page
107115.
Athif, M. and Daluwatte, C. (2017). Combination of rule
based classification and decision trees to identify low
quality ecg. In 2017 IEEE International Conference
on Industrial and Information Systems (ICIIS), pages
1–4. IEEE.
Barandas, M., Folgado, D., Fernandes, L., Santos, S.,
Abreu, M., Bota, P., Liu, H., Schultz, T., and Gam-
Towards High-Fidelity ECG Generation: Evaluation via Quality Metrics and Human Feedback
1163

boa, H. (2020). Tsfel: Time series feature extraction
library. SoftwareX, 11:100456.
Belo, D., Rodrigues, J., Vaz, J. R., Pezarat-Correia, P., and
Gamboa, H. (2017). Biosignals learning and synthesis
using deep neural networks. Biomedical engineering
online, 16:1–17.
Di Costanzo, A., Spaccarotella, C. A. M., Esposito, G., and
Indolfi, C. (2024). An artificial intelligence analysis
of electrocardiograms for the clinical diagnosis of car-
diovascular diseases: a narrative review. Journal of
Clinical Medicine, 13(4):1033.
Dissanayake, T., Fernando, T., Denman, S., Sridharan, S.,
and Fookes, C. (2022). Generalized generative deep
learning models for biosignal synthesis and modality
transfer. IEEE Journal of Biomedical and Health In-
formatics, 27(2):968–979.
Esteban, C., Hyland, S. L., and R
¨
atsch, G. (2017). Real-
valued (medical) time series generation with recurrent
conditional gans. arXiv preprint arXiv:1706.02633.
Fekri, M. N., Ghosh, A. M., and Grolinger, K. (2019).
Generating energy data for machine learning with re-
current generative adversarial networks. Energies,
13(1):130.
Kynk
¨
a
¨
anniemi, T., Karras, T., Laine, S., Lehtinen, J., and
Aila, T. (2019). Improved precision and recall metric
for assessing generative models. Advances in neural
information processing systems, 32.
Liu, C., Zhang, X., Zhao, L., Liu, F., Chen, X., Yao,
Y., and Li, J. (2018). Signal quality assessment and
lightweight qrs detection for wearable ecg smartvest
system. IEEE Internet of Things Journal, 6(2):1363–
1374.
Liu, G., Han, X., Tian, L., Zhou, W., and Liu, H.
(2021). Ecg quality assessment based on hand-
crafted statistics and deep-learned s-transform spec-
trogram features. Computer Methods and Programs
in Biomedicine, 208:106269.
Mahajan, P., Uddin, S., Hajati, F., and Moni, M. A. (2023).
Ensemble learning for disease prediction: A review.
In Healthcare, volume 11, page 1808. MDPI.
Monachino, G., Zanchi, B., Fiorillo, L., Conte, G., Auric-
chio, A., Tzovara, A., and Faraci, F. D. (2023). Deep
generative models: The winning key for large and eas-
ily accessible ecg datasets? Computers in biology and
medicine, page 107655.
Murtaza, H., Ahmed, M., Khan, N. F., Murtaza, G., Zafar,
S., and Bano, A. (2023). Synthetic data generation:
State of the art in health care domain. Computer Sci-
ence Review, 48:100546.
Naeem, M. F., Oh, S. J., Uh, Y., Choi, Y., and Yoo, J.
(2020). Reliable fidelity and diversity metrics for gen-
erative models. In International Conference on Ma-
chine Learning, pages 7176–7185. PMLR.
Neifar, N., Ben-Hamadou, A., Mdhaffar, A., and Jmaiel,
M. (2023). Diffecg: A versatile probabilistic diffu-
sion model for ecg signals synthesis. arXiv preprint
arXiv:2306.01875.
Nishikimi, R., Nakano, M., Kashino, K., and Tsukada, S.
(2023). Variational autoencoder–based neural electro-
cardiogram synthesis trained by fem-based heart sim-
ulator. Cardiovascular Digital Health Journal.
Reyna, M. A., Sadr, N., Alday, E. A. P., Gu, A., Shah,
A. J., Robichaux, C., Rad, A. B., Elola, A., Seyedi,
S., Ansari, S., et al. (2021). Will two do? vary-
ing dimensions in electrocardiography: the phys-
ionet/computing in cardiology challenge 2021. In
2021 Computing in Cardiology (CinC), volume 48,
pages 1–4. IEEE.
Sajjadi, M. S., Bachem, O., Lucic, M., Bousquet, O., and
Gelly, S. (2018). Assessing generative models via pre-
cision and recall. Advances in neural information pro-
cessing systems, 31.
Stein, G., Cresswell, J., Hosseinzadeh, R., Sui, Y., Ross, B.,
Villecroze, V., Liu, Z., Caterini, A. L., Taylor, E., and
Loaiza-Ganem, G. (2024). Exposing flaws of gener-
ative model evaluation metrics and their unfair treat-
ment of diffusion models. Advances in Neural Infor-
mation Processing Systems, 36.
Stenger, M., Leppich, R., Foster, I., Kounev, S., and Bauer,
A. (2024). Evaluation is key: a survey on evalua-
tion measures for synthetic time series. Journal of Big
Data, 11(1):66.
Wagner, P., Strodthoff, N., Bousseljot, R.-D., Kreiseler, D.,
Lunze, F. I., Samek, W., and Schaeffter, T. (2020).
Ptb-xl, a large publicly available electrocardiography
dataset. Scientific data, 7(1):1–15.
Wulan, N., Wang, W., Sun, P., Wang, K., Xia, Y., and
Zhang, H. (2020). Generating electrocardiogram sig-
nals by deep learning. Neurocomputing, 404:122–136.
Zama, M. H. and Schwenker, F. (2023). Ecg synthesis via
diffusion-based state space augmented transformer.
Sensors, 23(19):8328.
Zhang, J., Wang, L., Zhang, W., and Yao, J. (2018). A sig-
nal quality assessment method for electrocardiogra-
phy acquired by mobile device. In 2018 IEEE Interna-
tional Conference on Bioinformatics and Biomedicine
(BIBM), pages 1–3. IEEE.
APPENDIX
This appendix provides supplementary visualizations
of two examples of Normal 12-lead ECG tracings in-
cluded in the human evaluation questionnaire. Fig-
ure 5 shows a real ECG sourced from the PTB-XL
database, while Figure 6 depicts a synthetic ECG gen-
erated by the SSSD-ECG model.
SyntBioGen 2025 - Special Session on Synthetic biosignals generation for clinical applications
1164
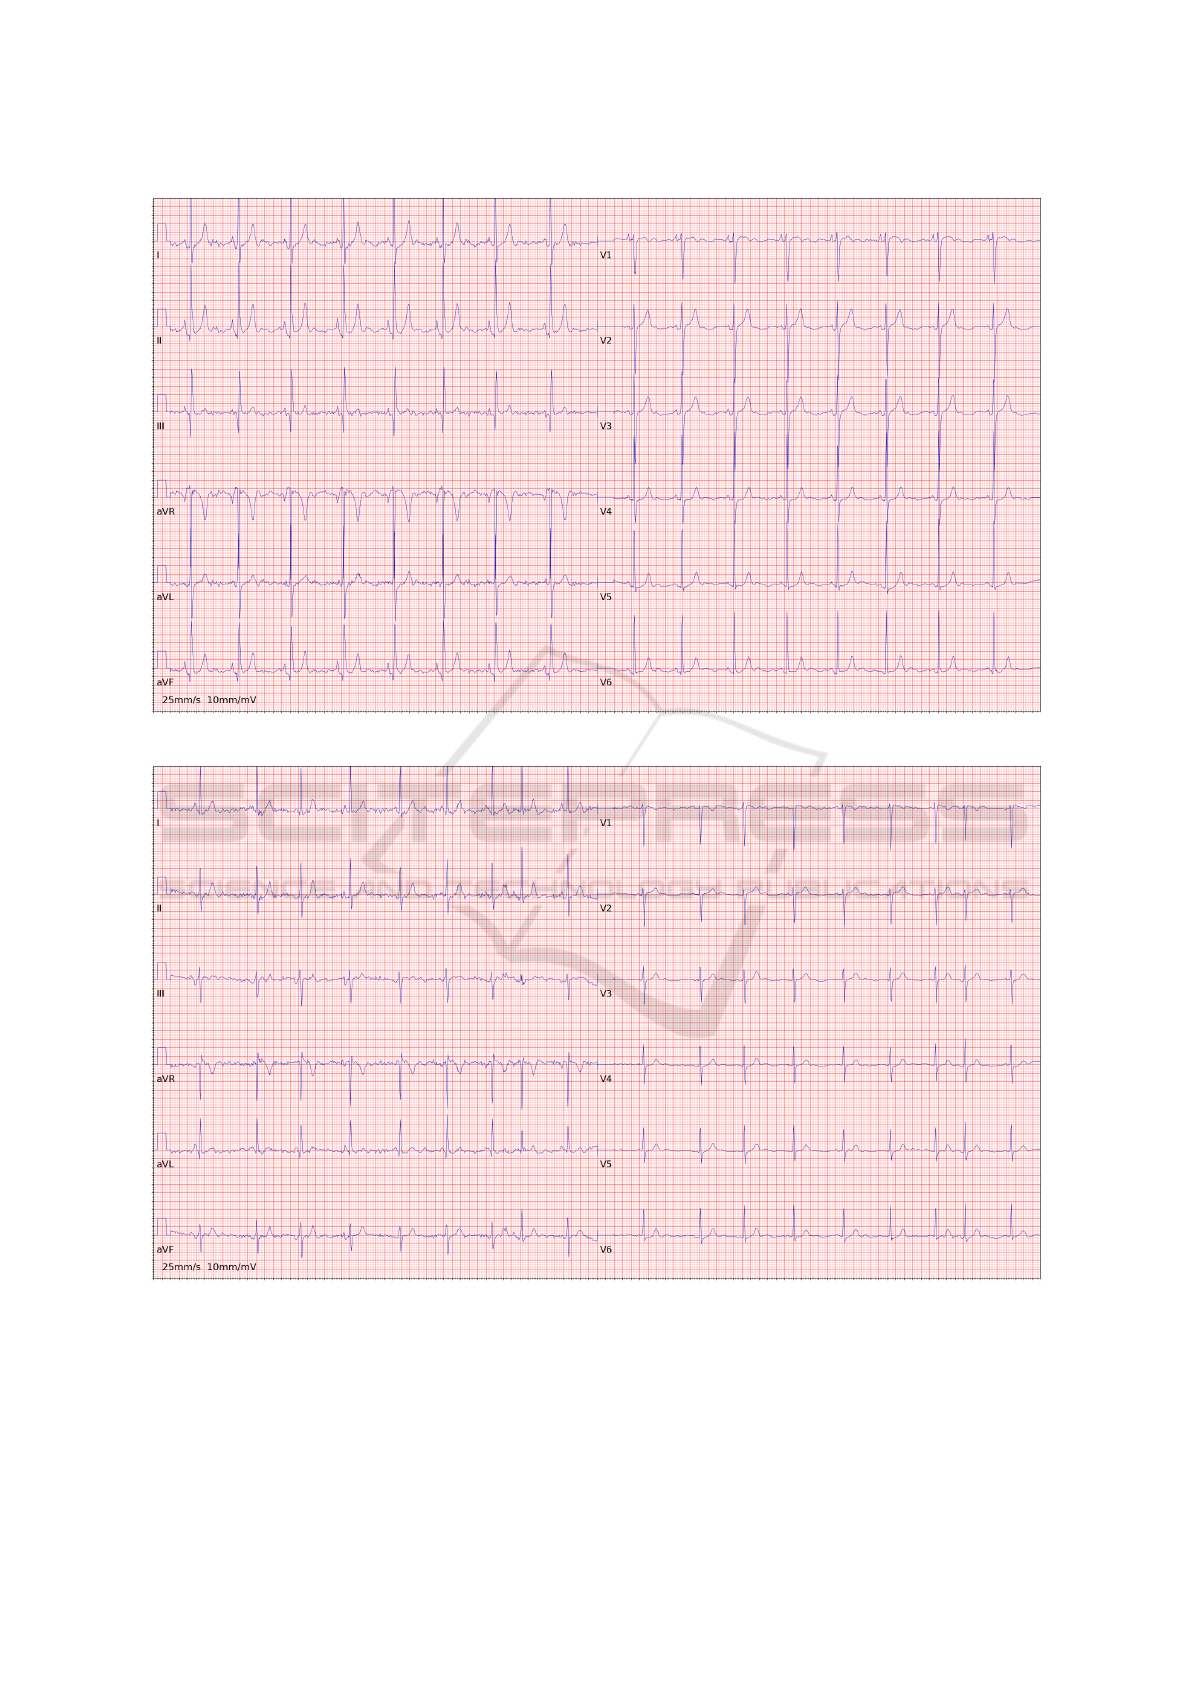
Figure 5: Real ECG sourced from the PTB-XL database.
Figure 6: Synthetic ECG generated by the SSSD-ECG.
Towards High-Fidelity ECG Generation: Evaluation via Quality Metrics and Human Feedback
1165
