
Exploring the EarMetrics Concept: The Bony Ear Canal as a
Non-Pigmented Site for Photoplethysmography
David Western
1 a
, John Eveness
1
, Beshoy Agayby
2 b
, Xicai (Alex) Yue
1 c
, Timothy Cox
1 d
,
Alistair Foster
2
and Nick Gompertz
2 e
1
Institute of BioSensing Technology, UWE Bristol, Bristol, U.K.
2
Earswitch Ltd, U.K.
{David.Western, John.Eveness, Alex.Yue, Timothy.Cox}@uwe.ac.uk, {beshoy, alistair, nick}@earswitch.co.uk
Keywords:
Photoplethysmography, Pulse Oximetry, Ear Canal, Skin Tone, Earables.
Abstract:
Photoplethysmography (PPG) is a well-established form of physiological sensing, but persistent challenges
include skin-tone-dependent variations in performance and trade-offs between performance and acceptance
factors in site selection. We propose that the inner, bony portion of the ear canal may offer several advantages
over established sites, including reduced sensitivity to skin tone. We support this position through a combi-
nation of anatomical analysis, colorimetry, and the first examples of PPG data collected from the bony ear
canal, including pulse oximetry calculations during voluntary breathholds. Colorimetry revealed no statisti-
cally significant differences in lightness, chroma, or hue of the bony canal between subjects with lighter versus
darker external skin tones. The commonly used ratio-of-ratios (R) method for pulse oximetry was sensitive to
de-oxygenation from breathholds, showing statistically significant correlation with breathhold duration. Our
results show that the bony ear canal is not pigmented, and that PPG signals can be obtained from this site, even
in the presence of idiosyncracies such as earwax and myringosclerosis.
1 INTRODUCTION
Photoplethysmography (PPG) is a well-established
form of physiological sensing. It is widely used for
measurements including heart rate, pulse oximetry,
and - increasingly - blood pressure, due to advan-
tages such as its low cost, ease of miniaturisation,
and richness of information content. However, per-
sistent challenges include skin-tone-dependent vari-
ations in performance (Nowara et al., 2020; Martin
et al., 2024), movement artefact (Ismail et al., 2021),
and the trade-offs between performance and accep-
tance factors in site selection (Seifi et al., 2018; Long-
more et al., 2019).
Numerous prior works have demonstrated the po-
tential of the ear canal as a site for PPG sensing, but
in virtually all cases the focus has been on the outer,
cartilagenous portion of the canal. In this paper, we
propose that the inner, bony portion of the ear canal
a
https://orcid.org/0000-0002-4303-7423
b
https://orcid.org/0000-0002-6205-5846
c
https://orcid.org/0000-0003-1419-825X
d
https://orcid.org/0000-0002-9200-9525
e
https://orcid.org/0000-0002-6896-0441
may offer several advantages over the cartilagenous
portion, including reduced sensitivity to skin tone. We
provide evidence to support these assertions through
a combination of anatomical analysis, colorimetry,
and the first examples of PPG data collected from the
bony ear canal, including pulse oximetry calculations
during voluntary breatholds.
2 LITERATURE REVIEW
2.1 Photoplethysmography (PPG)
2.1.1 Basic Principles
PPG is a non-invasive optical technique that measures
blood volume changes in the microvascular bed of
tissue. It is based on the principle that light absorp-
tion by blood is different from that of surrounding tis-
sue, and that the absorption varies with the volume
of blood in the illuminated area. When light is shone
on the skin, some of it is absorbed by the underly-
ing tissue, and some portion of the unabsorbed light
can be detected by a photodetector. PPG devices are
Western, D., Eveness, J., Agayby, B., Yue, X. A., Cox, T., Foster, A. and Gompertz, N.
Exploring the EarMetrics Concept: The Bony Ear Canal as a Non-Pigmented Site for Photoplethysmography.
DOI: 10.5220/0013401600003911
Paper published under CC license (CC BY-NC-ND 4.0)
In Proceedings of the 18th International Joint Conference on Biomedical Engineering Systems and Technologies (BIOSTEC 2025) - Volume 2: HEALTHINF, pages 1045-1052
ISBN: 978-989-758-731-3; ISSN: 2184-4305
Proceedings Copyright © 2025 by SCITEPRESS – Science and Technology Publications, Lda.
1045
typically categorised as ‘transmission’ or ‘reflection’
devices, depending on whether the light source and
photodetector are on opposite sides of the tissue or on
the same side. Most PPG devices make use of light
sources and one or more photodetectors in direct con-
tact with the skin. However, it is also possible to cap-
ture PPG signals remotely, often using ambient light
sources, cameras, and advanced algorithms to focus
the measurement on a suitable region-of-interest, as
recently reviewed by Pirzada et al. (2024).
Arguably the most common application of PPG is
heart-rate monitoring, where the pulsatile component
of the signal is used to detect the heart rate. PPG sig-
nals can also be used to estimate other physiological
parameters, such as blood pressure, respiratory rate,
and oxygen saturation.
2.1.2 Pulse Oximetry
Pulse oximetry is a specific application of PPG that
measures the oxygen saturation of arterial blood. It
is based on the principle that oxygenated and deoxy-
genated blood have different absorption spectra as a
function of wavelength, and that the ratio of these two
components can be used to calculate the oxygen satu-
ration of the blood. Pulse oximetry is widely used in
clinical settings, and is also increasingly being used in
consumer devices for continuous health monitoring.
The most common method for calculating oxy-
gen saturation from PPG signals is the ratio-of-ratios
method, using PPG signals captured at two different
wavelengths of light, typically red (e.g. 640 nm) and
infrared (e.g. 940 nm) (Nitzan et al., 2020). These
two signals are each decomposed into a pulsatile ‘AC’
component and a non-pulsatile ‘DC’ component. The
AC/DC ratio is then calculated for each wavelength,
and the ratio of these two ratios is used as a proxy for
oxygen saturation, which can be determined from a
device-specific calibration curve.
In recent years there has been increasing evidence
of racial bias in pulse oximetry, with darker-skinned
individuals being more likely to be victims of ‘oc-
cult hypoxaemia’, in which blood oxygenation is low
enough to warrant clinical attention but the oxime-
ter indicates a reading within healthy bounds (Sjoding
et al., 2020; Nowara et al., 2020; Martin et al., 2024).
2.1.3 In-Ear PPG
Various studies from as early as 2007 (Vogel et al.,
2007) have demonstrated the potential of the ear canal
as a site for PPG sensing. As reviewed by Azudin
et al. (2023), potential advantages include ease of in-
tegration with earbud devices, robustness to periph-
eral blood perfusion changes (e.g. in hypothermia),
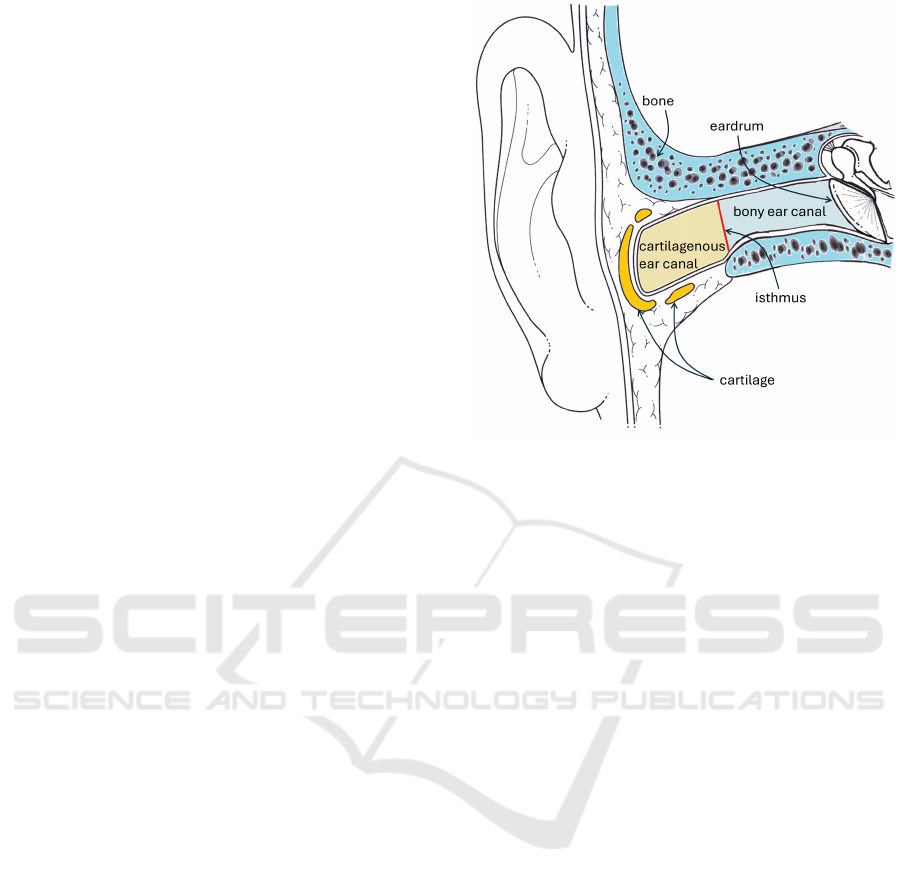
Figure 1: A cross-sectional drawing of the ear canal. The
outer third can be seen to be surrounded by cartilagenous
tissue, while the inner two thirds is surrounded by bone.
Adapted from Descouens (2009).
reduced exposure to changing environmental vari-
ables (e.g. ambient light and temperature), and re-
duced motion artefact.
Prior in-ear devices typically focus on the external
ear (e.g. concha or tragus) or the cartilagenous outer
third of the ear canal (Azudin et al., 2023). However,
we propose that a stand-off sensor targeting the inner,
bony portion of the ear canal, rather than the outer car-
tilagenous portion, can offer distinctive advantages.
2.2 Anatomy of the Ear Canal
The ear canal (external auditory meatus) is divided
into two portions: the outer, cartilagenous portion,
and the inner, bony portion. The bony-cartilagenous
junction is at the isthmus, the narrowest part of the
canal, positioned approximately one third of the dis-
tance from the outer opening to the eardrum (Stinson
and Lawton, 1989). The cartilagenous portion is the
outer third of the canal, and produces hairs and ceru-
men (earwax), which the bony portion does not. Fur-
thermore, it is tacit knowledge among many physi-
cians that the bony ear canal is not pigmented, while
the cartilagenous portion is. However, we are not
aware of any published work that confirms this, prior
to the evidence provided in this paper.
The skin lining the bony ear canal is much thin-
ner that that of the cartilagenous portion: approxi-
mately 0.1 mm vs. 1.0-1.5 mm respectively (Perry
and Shelley, 1955). This thinner medium may of-
WHC 2025 - Special Session on Wearable HealthCare
1046
fer improved inter-individual repeatability by reduc-
ing wavelength-dependent variations in path length.
Simulations by Ash et al. (2017) demonstrate that the
relative intensity of light penetrating to a depth of
1mm increases by an order of magnitude as wave-
length increases across the visible and near-infrared
spectrum. Thus the effective path length from light
source to sensor is dependent on both wavelength
and the relative configuration of source, sensor, and
anatomy. Device-specific calibration curves are typi-
cally used to account for this, but cannot compensate
for inter-subject anatomical variations (Yossef Hay
et al., 2018; Moc¸o et al., 2016). In the thinner skin
of the bony ear canal, although much of the light
may penetrate into the underlying bone, the absorp-
tion coefficient of bone is relatively consistent across
the visible and near-infrared spectrum (Genina et al.,
2008). Hence we propose that greater consistency of
path lengths between wavelengths may result in re-
duced inter-individual variations in calibration curves
for a device targeting the bony ear canal compared
with fleshier sites.
3 EXPERIMENTAL METHOD
In this section we describe experiments conducted to
provide proof-of-concept for bony ear canal as a vi-
able site for pulse oximetry.
3.1 Cohort
We set out to recruit a cohort of healthy adult vol-
unteers with a range of skin tones, as measured by
the Fitzpatrick scale. This scale is a widely used
classification system for human skin colour, based on
the skin’s appearance and response to sun exposure.
Although it has recognised limitations (Monk, 2023;
Tian, 2024), suitable alternatives were not well estab-
lished at the start of our study, and it allows our work
to be easily compared with prior art, in which it is
used widely. Prospective participants were excluded
if they had any known history of circulatory disorder
such as Raynaud’s Syndrome, thrombosis, hyperten-
sion, or heart disease.
Thirty-three subjects were recruited from the gen-
eral population after pre-screening based on self-
assessment of skin-tone against the Fitzpatrick scale
to ensure broad representation. Of these, two subjects
were excluded due to excessive earwax in both ears,
to conservatively avoid the risk of study instruments
compacting the wax against the eardrum.
As shown in Fig. 3, the cohort was well-
distributed across the Fitzpatrick scale. Although
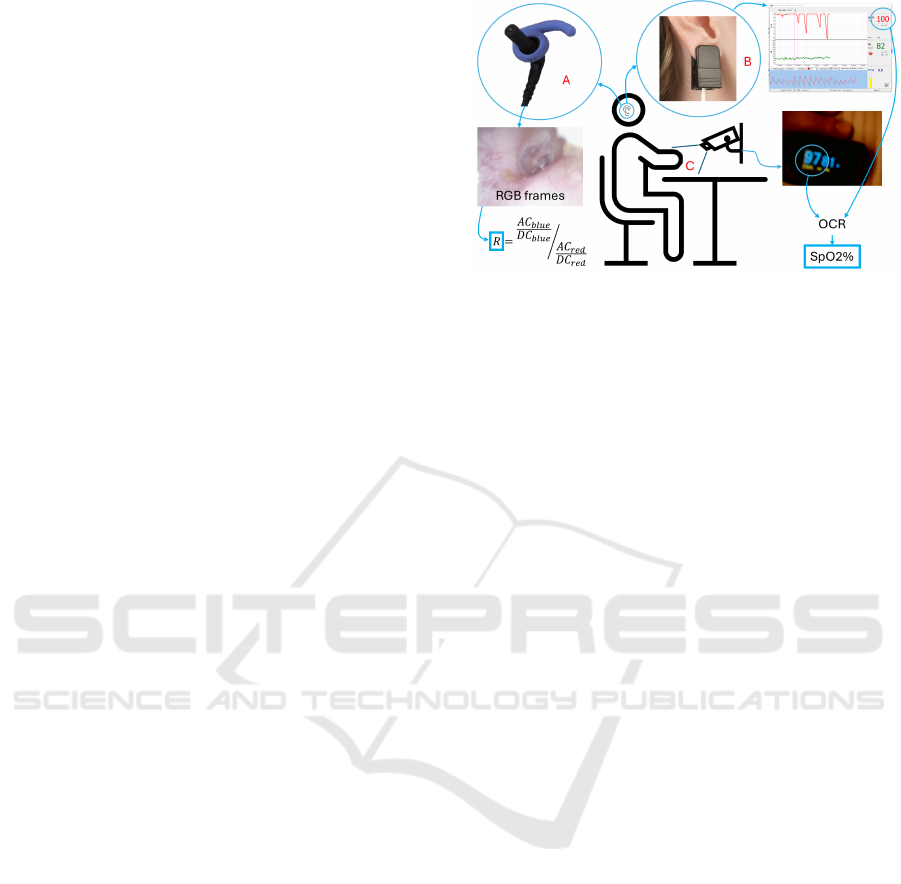
Figure 2: The configuration of equipment used in this study.
A = Prototype EarMetrics
®
device, which was positioned in-
side the ear canal, capturing RGB images at 30 frames-per-
second (fps). B = Earlobe pulse oximeter, transmitting data
via bluetooth to the experiment manufacturer’s Oximeter
Manager software, from which screenshots were captured
at 1 fps. C = Finger pulse oximeter, monitored by a camera
mounted above the hand at 1 fps. For B and C, optical char-
acter recognition (OCR) software was used to extract SpO2
values.
none of our participants self-identified as Fitzpatrick
type VI (the darkest category), we were able to re-
cruit participants from all other types, including ten
from type V.
3.2 Equipment
The configuration of equipment used in this study is
shown in Fig. 2.
3.2.1 EarMetrics
®
The in-ear sensor used in this study is a prototype
EarMetrics
®
device, developed by Earswitch Ltd. The
concept of non-contact, stand-off or remote spec-
troscopy (including PPG) from the inner ear canal
has been termed EarMetrics
®
and has patent granted
(UK) (Gompertz, 2023) and pending internationally
by EarSwitch Ltd. The EarMetrics concept devel-
oped from the EarSwitch concept, in which detection
of ear-drum movement mediated by voluntary control
of middle ear muscles is used as an assistive switch
for individuals with motor neurodisabilities, includ-
ing motor neurone disease (MND/ALS) (Hoyle et al.,
2024). The EarMetrics experimental device studied
consisted of CMOS camera module with 4 white light
LEDs mounted within a cylindrical metal barrel. The
CMOS camera module was mounted in a 3D printed
barrel component, within an adjustable ear worn de-
vice allowing alteration of angle and depth of the
camera module within the wearers ear-canal. Soft
elastomer outer earbud components were provided to
Exploring the EarMetrics Concept: The Bony Ear Canal as a Non-Pigmented Site for Photoplethysmography
1047

fit the individual in small/medium/large and left/right
configurations.
The EarMetrics camera module was wired to a
MIPI-to-USB conversion PCB. This was plugged via
USB cable to the research laptop for data acquisition.
The data from the CMOS camera was collected on the
research laptop synchronously with the data recording
from the reference devices.
3.2.2 Reference Devices
For comparison with the EarMetrics device, we used
two reference devices approved for medical use. Data
from both devices was captured using the same exper-
iment PC using custom software in order to synchro-
nise the data streams.
• Finger: a Creative PC-60B1 finger oximeter was
worn on the index finger of the right hand. Read-
ings were captured using a camera connected via
USB to the experiment computer and mounted
over the hand, facing the on-device display. Cap-
tured frames were timestamped by our custom
software, and the SpO2 and pulse rate values were
extracted from the display using optical character
recognition (OCR).
• Earlobe: a Creative SP-20 pulse oximeter was
worn on either the left or right earlobe (chosen
to avoid interference with the EarMetrics device
and any jewellery). Readings were transmitted
wirelessly to the experiment computer via Blue-
tooth and displayed using the manufacturer’s soft-
ware, such that screenshots could be captured and
timestamped by our custom software. Readings
were extracted by application of optical character
recognition to relevant sections of these screen-
shots.
This approach enabled efficient, approximately
synchronised data capture from multiple conventional
devices. The accuracy of synchronisation is depen-
dent on the lag in each device between signal acquisi-
tion and display/transmission. Informal experiments
with deliberately induced motion artefacts (tapping
the sensors) indicated that these delays were consis-
tently less than 3 seconds, hence only time differences
greater than this may be considered non-negligible.
3.3 Protocol
Each participant sat in a chair as the devices were ap-
plied. They were then allowed five minutes of set-
tling time, making slow movements of their head and
hands to ensure comfort and stability of the devices.
Next, they performed four breathholds, each lasting
as long as they could manage without excessive dis-
comfort. The first and third were performed after in-
haling (i.e. with lungs full) and the second and fourth
after exhaling (i.e. with lungs empty). In each case,
the researcher provided a 10-second countdown after
which the the participant began the breathhold at the
next appropriate point in their breathing cycle. The
researcher used a button in the custom software in-
terface to approximately timestamp the start and end
of each breathhold based on visual observation. A
minimum of 60 seconds was allowed between breath-
holds to allow the participant to recover; a previous
study with finger and in-ear oximetry during breath-
holds (Davies et al., 2020) provides evidence that this
is sufficient for SpO2 levels to return to baseline, and
this was corroborated in our own data.
3.4 Analysis
3.4.1 Colorimetry
To test the conjecture that the bony ear canal is not
substantially pigmented, we extracted a frame from
the end of the settling period (before breathholds) for
each participant. An arbitrary pixel was manually se-
lected from the canal wall, near the tympanic mem-
brane (to conservatively avoid the cartilagenous outer
canal), avoiding visually apparent blood vessels. The
brightness values of the three colour channels (RGB)
were extracted and converted to the CIELAB-based
‘LCh’ colour space for more perceptually uniform
interpretation (Weatherall and Coombs, 1992; Tian,
2024). In this space, L* represents lightness, C* rep-
resents chroma (saturation), and h* represents hue.
3.4.2 Oximetry
Custom software was used to extract mean RGB
brightness values (three colour channels) across all
pixels of each frame from the EarMetrics
®
device.
The specific parameters of this algorithm were de-
termined heuristically to optimise visually perceived
signal quality and robustness to artefacts. Each of
the three resulting time series was split into AC (pul-
satile) and DC (baseline) components by applying
a 10th-order zero-phase Butterworth highpass filter
with a cut-off frequency of 0.25 Hz, then subtracting
this highpass-filtered signal from the original to ob-
tain the DC signal. The high-pass filtered signal was
low-pass filtered at 8 Hz to remove high-frequency
noise. Peaks were detected in this signal to identify
individual heartbeats. To exclude sections corrupted
by artefact, beats of abnormal length were excluded
using the following heuristically determined thresh-
olds: < 50% or > 150% of median beat interval, or
WHC 2025 - Special Session on Wearable HealthCare
1048
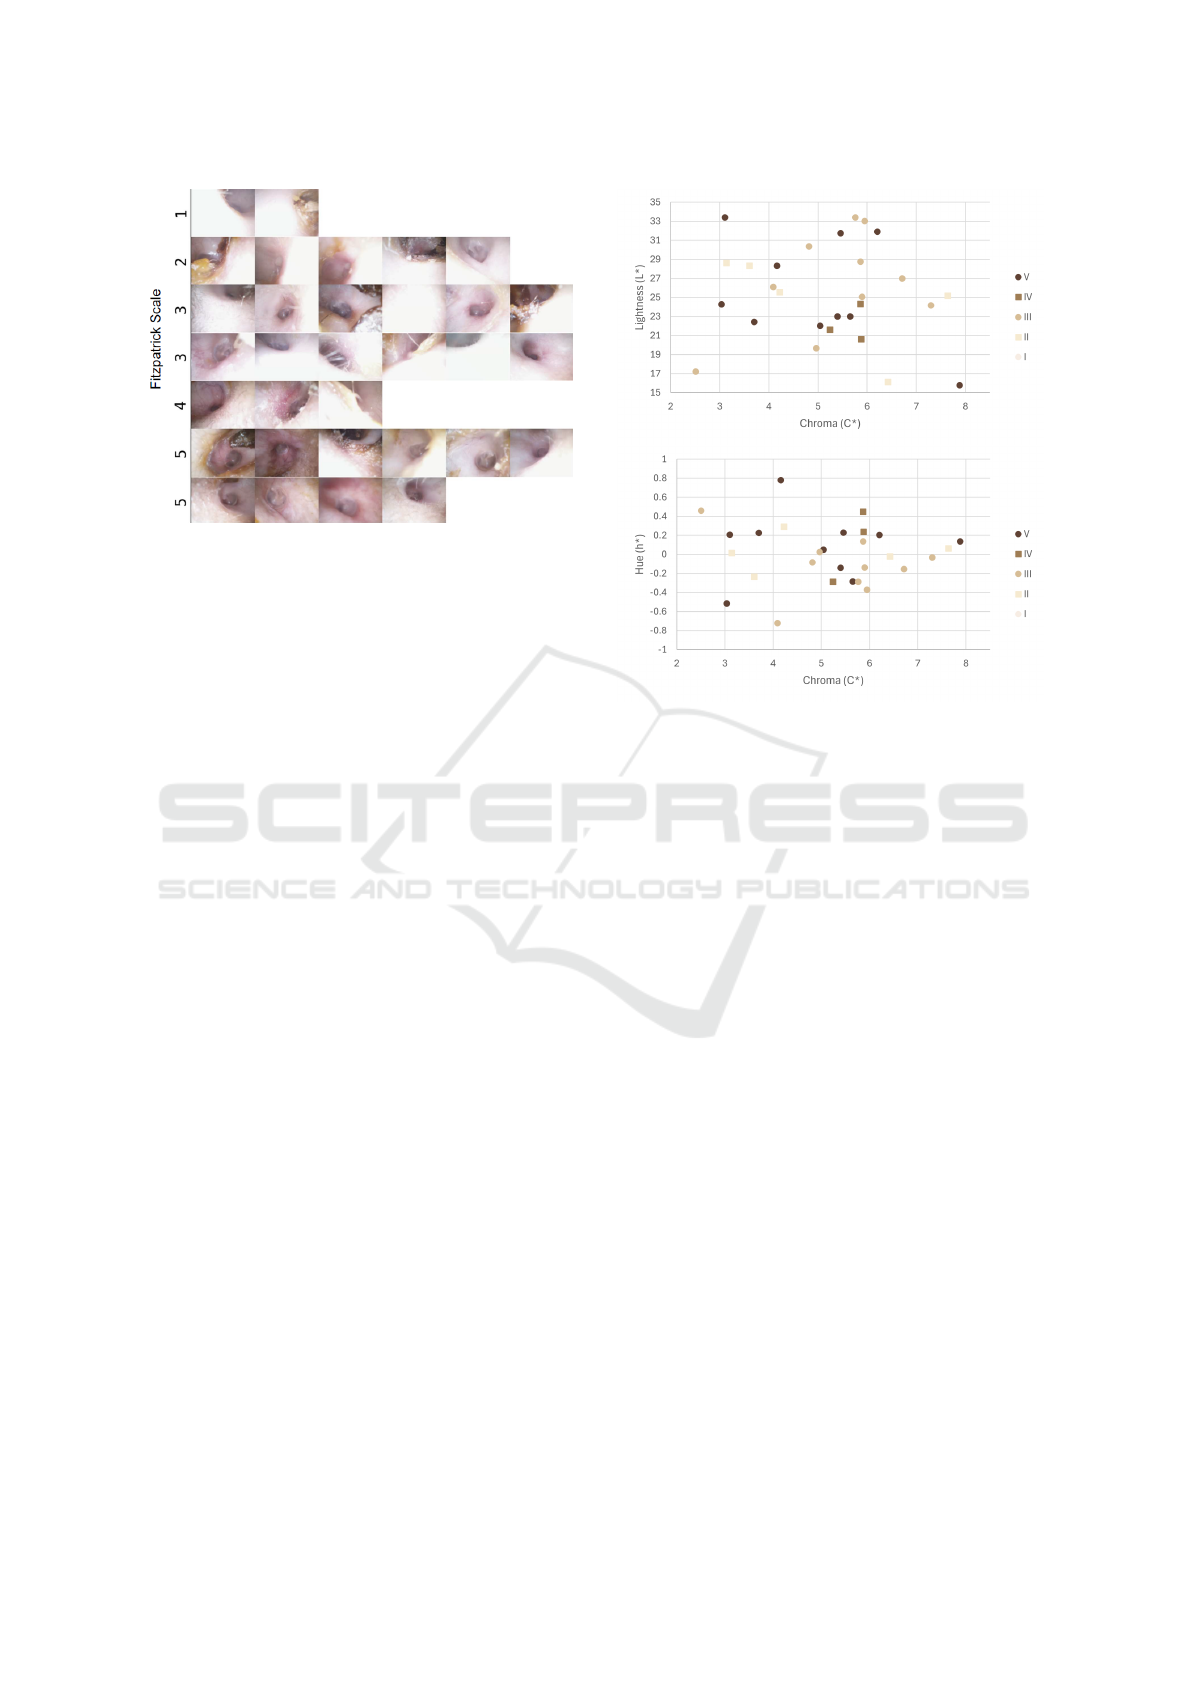
Figure 3: Images captured using the EarMetrics
®
device
showing the ear canal of participants. The precise field
of view and light distribution vary between participants.
Hence, the cartilagenous outer ear canal may be visible in
outer portions of some images, evidenced by the presence
of hair and/or cerumen. The tympanic membrane is seen as
a dark central region in most images. The canal wall sur-
rounding this is considered to be the bony ear canal.
< 80% or > 120% of the previous interval. The AC
signal was then calculated as the peak-to-peak ampli-
tude of the high-pass filtered signal within each valid
beat. The ‘ratio-of-ratios’ R was then calculated as
the ratio of the AC/DC values between the blue and
red channels, providing an uncalibrated proxy mea-
sure of SpO2. No R values were calculated for abnor-
mal beats, identified as described above.
For each breathhold, the resting value of R (for the
EarMetrics
®
device) or SpO2 (for the reference de-
vices) was calculated as the median in the window
from 15 to 5 seconds before the start of the breath-
hold. The depleted value was calculated as the min-
imum in the window from 20 seconds before to 30
seconds after the end of the breathhold. The effect
of the breathhold was calculated as the difference be-
tween the depleted and resting values.
4 RESULTS
4.1 Pigmentation of the Bony Ear Canal
As shown in Fig. 4, the LCh values sampled from the
bony ear canal portions of the sample images in Fig. 3
show no clear separation by external skin tone. For
statistical analysis, Fitzpatrick scales I-III and IV-V
were combined to form two groups. Two-tailed het-
eroscedastic T-tests were performed to compare the
L*, C*, and h* values between these groups, reveal-
ing no statistically significant differences (p > 0.1).
Figure 4: Colorimetry values sampled from the bony ear
canal (images presented in Fig. 3) show no clear separa-
tion by external skin tone (Fitzpatrick scale, colour coded
as shown in the legend). The 3-dimensional LCh colour
space is represented across two 2-dimensional scatter plots.
4.2 Example Breathhold Data
As shown in Fig. 5, the R metric from the
EarMetrics
®
device is sensitive to changes in oxygen
saturation during breathholds. Although the dura-
tion of breathhold and the extent of de-oxygenation
vary substantially between participants, there is a
statistically significant correlation between the two
(R
2
= 0.06, p = 0.015). Fig. 6 shows an example
of the data collected from a single participant during
a breathhold. The R value from EarMetrics
®
device
shows a clear response to the breathhold, and appear
to descend earlier and begin to recover earlier than the
SpO2 values from the reference devices.
5 DISCUSSION
From the presented results, we draw the following key
insights:
• The bony ear canal is not pigmented (Fig. 3,
Fig. 4). It may therefore offer a more equitable
target site for PPG sensing. Limited other non-
pigmented external sites exist, such as the nail
beds or the lips, but these are less conveniently
accessible, especially for continuous monitoring.
Exploring the EarMetrics Concept: The Bony Ear Canal as a Non-Pigmented Site for Photoplethysmography
1049
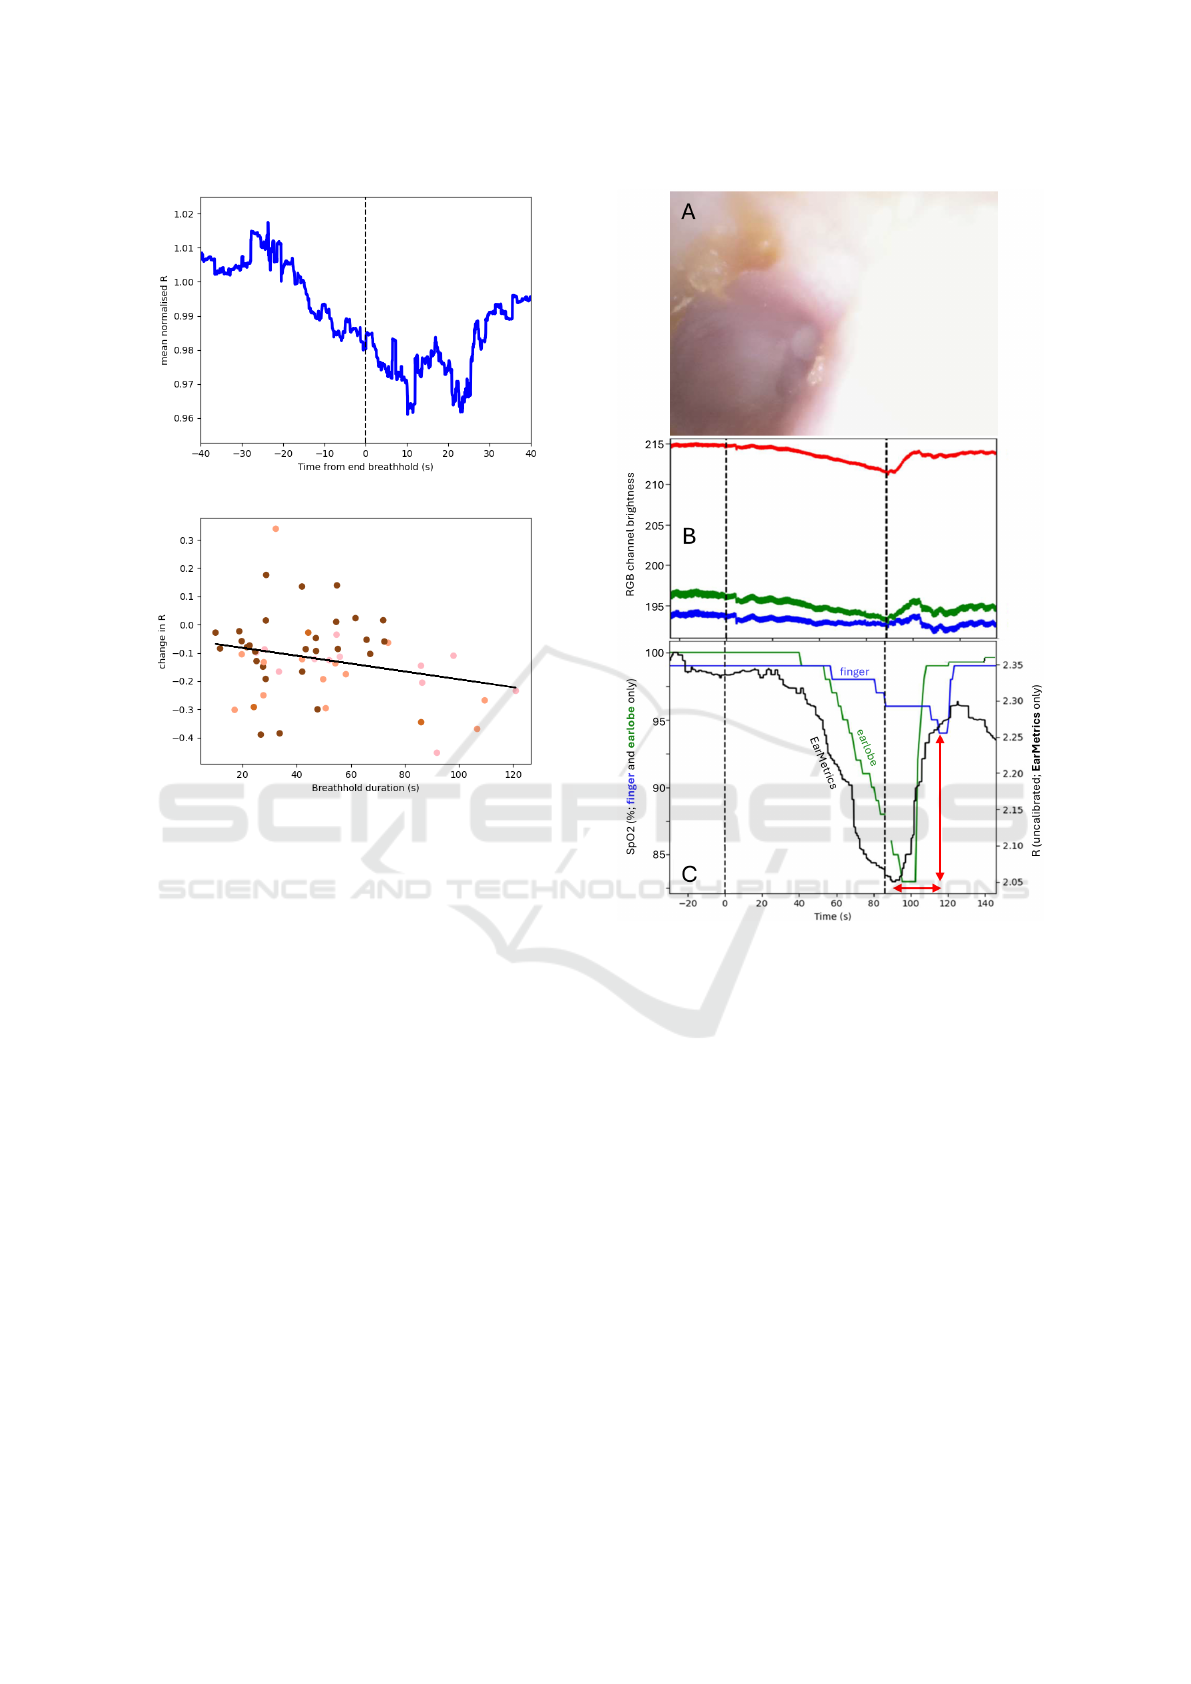
Figure 5: Upper panel: The normalised R value from the
EarMetrics
®
device across all breathholds from all subjects,
synchronised to the end of the breathhold. Lower panel:
The change in R (depleted - baseline) was significantly cor-
related with the breathhold duration (R
2
= 0.07, p = 0.029).
Data points are coloured according to the subject’s Fitz-
patrick skin type.
• Pulse oximetry at this site is sensitive to de-
oxygenation from breathholds (Fig. 5), and may
offer insights distinctive from the more commonly
targeted outer portion of the ear canal, owing to
the difference in vascularization and skin thick-
ness (Section 2.2). The delayed and muted re-
sponse of the finger device relative to the ear-
lobe is consisent with observations in prior studies
(Lindholm et al., 2007), and is attributable to the
greater distance between the finger and the heart.
The earlier response of the EarMetrics
®
device
(Fig. 6) is possibly indicative of a more central
blood supply, as described in Section 2.2, or pro-
tection from effects of vascular autonomic func-
tion or peripheral vasoconstriction. Hence it is
possible that pulse oximetry from the bony ear
canal may provide advantages in the speed of re-
sponse to changes in central blood oxygenation,
e.g. during apnoeic episodes.
Figure 6: Example data from a single participant dur-
ing a breathhold. Panel A shows a single frame captured
from the EarMetrics
®
device; in which several idiosyncra-
cies are apparent: presence of earwax, myringosclerosis
(white patches on the eardrum), and wide variation in light
distribution. Panel B shows the average channel brightness
in each of the three colour channels (red, green, blue) across
all frames. Dashed vertical lines indicate the start and end of
the breathhold. Pulse waveform (i.e. AC) amplitude is dis-
cernible from the thickness of the lines. Variations in both
AC and DC components are apparent during the breath-
hold. Respiratory frequency oscillations are visible even
during the breathhold, reflecting ongoing autonomic fluctu-
ations modulating cardiovascular properties as observed in
prior studies (Western, 2012; Hanson et al., 2012). Panel
C shows the variations in SpO2 readings from the refer-
ence devices (left vertical axis) and the R metric (uncali-
brated SpO2 proxy) from the EarMetrics device (right ver-
tical axis). As highlighted by the red arrows, EarMetrics
readings appears to descend earlier and begin to recover ear-
lier than the SpO2 values from the reference devices, and
the finger sensor is relatively insensitive to the transient de-
oxygenation.
• PPG signals can be obtained from the bony ear
canal, even in the presence of idiosyncracies such
WHC 2025 - Special Session on Wearable HealthCare
1050

as earwax and myringosclerosis (Fig. 6). Al-
though a small number of participants were ex-
cluded from our study due to earwax, in deploy-
ment the device may be usable with only occa-
sional or one-off removal of earwax.
The above insights warrant further development
and evaluation of the EarMetrics
®
concept. How-
ever, several limitations of the current study should
be noted:
• The use of breathholds yields only transient
changes in oxygen saturation and presents sub-
stantial inter-subject variability, for example in the
duration of voluntary breathholds. As can be seen
in Fig. 5, our dataset lacked examples of partici-
pants with darker skin tones (Fitzpatrick type IV-
V) achieving long breathholds (> 70 seconds) and
the associated substantial de-oxygenation. Fur-
thermore, the physical response (e.g. gasping) to
resumption of breathing presents challenging con-
ditions for the extraction of clean PPG signals dur-
ing the brief peak in de-oxygenation. More rig-
orous experiments could be achieved by using a
controlled hypoxia chamber, using a rebreathing
apparatus to induce more consistent and substan-
tial de-oxygenation, or working with participants
with chronic deoxygenation confirmed by gold-
standard methods.
• The reference devices used have notable limita-
tions in accuracy (Olive et al., 2016). They are
both likely to perform differently for different skin
tones. Furthermore, although the finger site is
typically less pigmented than the earlobe, its dis-
tal location makes it less responsive to transient
changes in central blood oxygenation (Lindholm
et al., 2007). The gold standard for SpO2 mea-
surement is arterial blood gas analysis, which is
invasive and impractical for repeated measure-
ments except where dictated by clinical necessity.
• The colorimetric measurements were taken from
the EarMetrics
®
device itself, rather than from a
dedicated colorimeter, which might offer more
optimal lighting and calibrated sensing, but may
not be suitable for targetting the bony ear canal.
A single pixel was sampled from each image, but
in further work a larger sample could be taken to
account for variations in anatomy and lighting.
• Our study made use of the Fitzpatrick scale as a
proxy for skin tone, which has recognised limita-
tions in its suitability for capturing the full breadth
of human skin tones. Future work should con-
sider more sophisticated methods for character-
ising skin tone, such as the recently developed
Monk Skin Tone Scale (Monk, 2023).
• Despite proactive recruitment, our cohort did not
include any participants self-identifying as Fitz-
patrick type VI, the darkest category. Nonethe-
less, the second darkest category, type V, included
more participants than any other.
• PPG signals were extracted from the full frames
captured by the EarMetrics device. Performance
could be improved through more sophisticated
signal processing or computer vision techniques
to focus on the most informative regions of the
image and focus more exclusively on the bony ear
canal.
6 CONCLUSIONS
This paper provides evidence to support anecdotal
accounts that skin in the human bony ear canal is
not pigmented; colorimetric analysis showed no sta-
tistically significant differences in lightness, chroma,
or hue of the bony ear canal between subjects with
lighter versus darker external skin tones. It should
therefore be considered as a target site for optical
sensing modalities, such as photoplethysmography
(PPG), that are sensitive to the variable influence of
pigmentation. We further support this position with
evidence that clear PPG signals can be obtained from
this target site, even in the presence of idiosyncracies
such as earwax and myringosclerosis. Pulse oximetry
at this site is sensitive to de-oxygenation from breath-
holds, as indicated by the statistically significant cor-
relation with breathhold duration. This site may offer
insights distinctive from the more commonly targeted
outer portion of the ear canal, owing to the difference
in vascularization.
Further work should be conducted to evaluate the
potential of the bony ear canal as a racially equitable,
sensitive, reliable, and convenient target site for pulse
oximetry and other physiological sensing. This work
should include validation against gold-standard arte-
rial blood gas analysis and evaluation of user accep-
tance for both long-term usage and acute monitoring
applications.
ACKNOWLEDGEMENTS
This work was supported by Innovate UK grant num-
ber 10027966, and is co-authored by members of Ear-
switch Ltd, a company that is commercialising the
EarMetrics
®
concept.
Exploring the EarMetrics Concept: The Bony Ear Canal as a Non-Pigmented Site for Photoplethysmography
1051

REFERENCES
Ash, C., Dubec, M., Donne, K., and Bashford, T. (2017).
Effect of wavelength and beam width on penetration
in light-tissue interaction using computational meth-
ods. Lasers in Medical Science, 32(8):1909–1918.
Azudin, K., Gan, K. B., Jaafar, R., and Ja’afar, M. H.
(2023). The Principles of Hearable Photoplethys-
mography Analysis and Applications in Physiological
Monitoring–A Review. Sensors, 23(14):6484.
Davies, H. J., Williams, I., Peters, N. S., and Mandic, D. P.
(2020). In-Ear SpO2: A Tool for Wearable, Unob-
trusive Monitoring of Core Blood Oxygen Saturation.
Sensors, 20(17):4879.
Descouens, D. (2009). Oreille-Audition.jpg.
Genina, E. A., Bashkatov, A. N., and Tuchin, V. V. (2008).
Optical Clearing of Cranial Bone. Advances in Opti-
cal Technologies, 2008(1):267867.
Gompertz, N. (2023). An apparatus and method for captur-
ing biometric data from a human or other animal.
Hanson, B., Western, D., Gilbey, M. P., Bostock, J., Boyett,
M. R., Zhang, H., Coronel, R., and Taggart, P. (2012).
Cyclical Modulation of Human Ventricular Repolar-
ization by Respiration. Frontiers in Cardiac Electro-
physiology, 3:379.
Hoyle, A. C., Stevenson, R., Leonhardt, M., Gillett, T.,
Martinez-Hernandez, U., Gompertz, N., Clarke, C.,
Cazzola, D., and Metcalfe, B. W. (2024). Exploring
the ’EarSwitch’ concept: A novel ear based control
method for assistive technology. Journal of Neuro-
Engineering and Rehabilitation, 21(1):210.
Ismail, S., Akram, U., and Siddiqi, I. (2021). Heart rate
tracking in photoplethysmography signals affected by
motion artifacts: A review. EURASIP Journal on Ad-
vances in Signal Processing, 2021(1):5.
Lindholm, P., Blogg, S. L., and Gennser, M. (2007). Pulse
oximetry to detect hypoxemia during apnea: Compar-
ison of finger and ear probes. Aviation, Space, and
Environmental Medicine, 78(8):770–773.
Longmore, S. K., Lui, G. Y., Naik, G., Breen, P. P.,
Jalaludin, B., and Gargiulo, G. D. (2019). A Compar-
ison of Reflective Photoplethysmography for Detec-
tion of Heart Rate, Blood Oxygen Saturation, and Res-
piration Rate at Various Anatomical Locations. Sen-
sors, 19(8):1874.
Martin, D., Johns, C., Sorrell, L., Healy, E., Phull, M., Olu-
sanya, S., Peters, M., and Fabes, J. (2024). Effect of
skin tone on the accuracy of the estimation of arterial
oxygen saturation by pulse oximetry: A systematic re-
view. British Journal of Anaesthesia, 132(5):945–956.
Moc¸o, A. V., Stuijk, S., and de Haan, G. (2016). Skin
inhomogeneity as a source of error in remote PPG-
imaging. Biomedical Optics Express, 7(11):4718–
4733.
Monk, E. (2023). The Monk Skin Tone Scale.
Nitzan, M., Nitzan, I., and Arieli, Y. (2020). The Vari-
ous Oximetric Techniques Used for the Evaluation of
Blood Oxygenation. Sensors, 20(17):4844.
Nowara, E. M., McDuff, D., and Veeraraghavan, A. (2020).
A Meta-Analysis of the Impact of Skin Tone and Gen-
der on Non-Contact Photoplethysmography Measure-
ments. In Proceedings of the IEEE/CVF Conference
on Computer Vision and Pattern Recognition Work-
shops, pages 284–285.
Olive, S., Twentyman, O., and Ramsay, C. (2016). Com-
parison of fingertip and earlobe pulse oximetry with
arterial blood gas results. European Respiratory Jour-
nal, 48(suppl 60).
Perry, E. T. and Shelley, W. B. (1955). The histology of the
human ear canal with special reference to the cerumi-
nous gland. The Journal of Investigative Dermatol-
ogy, 25(6):439–451.
Pirzada, P., Wilde, A., and Harris-Birtill, D. (2024). Remote
Photoplethysmography for Heart Rate and Blood
Oxygenation Measurement: A Review. IEEE Sensors
Journal, 24(15):23436–23453.
Seifi, S., Khatony, A., Moradi, G., Abdi, A., and Najafi, F.
(2018). Accuracy of pulse oximetry in detection of
oxygen saturation in patients admitted to the intensive
care unit of heart surgery: Comparison of finger, toe,
forehead and earlobe probes. BMC Nursing, 17(1):15.
Sjoding, M. W., Dickson, R. P., Iwashyna, T. J., Gay, S. E.,
and Valley, T. S. (2020). Racial Bias in Pulse Oxime-
try Measurement. New England Journal of Medicine,
383(25):2477–2478.
Stinson, M. R. and Lawton, B. W. (1989). Specification of
the geometry of the human ear canal for the prediction
of sound-pressure level distribution. The Journal of
the Acoustical Society of America, 85(6):2492–2503.
Tian, S. (2024). Shades of Skin: Limitations
of the Fitzpatrick Scale with CIELAB.
https://nhsjs.com/2024/shades-of-skin-limitations-of-
the-fitzpatrick-scale-with-cielab/.
Vogel, S., Hulsbusch, M., Starke, D., and Leonhardt, S.
(2007). In-Ear Heart Rate Monitoring Using a Micro-
Optic Reflective Sensor. In 2007 29th Annual In-
ternational Conference of the IEEE Engineering in
Medicine and Biology Society, pages 1375–1378.
Weatherall, I. L. and Coombs, B. D. (1992). Skin Color
Measurements in Terms of CIELAB Color Space Val-
ues. Journal of Investigative Dermatology, 99(4):468–
473.
Western, D. G. (2012). Bioelectric Signal Analysis to Ex-
pose Nervous Control of the Human Heart. Doctoral,
University College London.
Yossef Hay, O., Cohen, M., Nitzan, I., Kasirer, Y.,
Shahroor-karni, S., Yitzhaky, Y., Engelberg, S., and
Nitzan, M. (2018). Pulse Oximetry with Two Infrared
Wavelengths without Calibration in Extracted Arterial
Blood. Sensors (Basel, Switzerland), 18(10):3457.
WHC 2025 - Special Session on Wearable HealthCare
1052
