
Understanding Car Usage Patterns for V2G Integration: Insights
from Dutch Travel Diaries
Simon Leu
1a
, Gonçalo Homem de Almeida Correia
2b
, Hans van Lint
2c
and Axel Leonhardt
1d
1
Institute of Transport and Spatial Planning, University of the Bundeswehr Munich,
Werner-Heisenberg-Weg 39, 85577 Neubiberg, Germany
2
Department of Transport and Planning, TU Delft, Stevinweg 1, 2628 CN Delft, The Netherlands
Keywords: Vehicle-to-Grid (V2G), Mobility Data Analysis, Car Usage Behavior, Clustering Analysis.
Abstract: Integrating renewable energy sources, such as solar and wind, challenges grid stability due to their intermittent
nature. Vehicle-to-grid (V2G) technology provides a promising solution by utilizing electric vehicles (EVs)
as decentralized energy storage systems, enabling the storage of surplus energy during low demand and its
release during peak demand. The effectiveness of V2G depends critically on car usage patterns. Data from
the Netherlands Mobility Panel (MPN) of 2022, comprising travel diaries from 2,505 households, was
analyzed to explore this. A methodology was developed to create car usage profiles based on parking durations
and locations, distinguishing weekday and weekend patterns. The analysis shows that vehicles are
predominantly parked at home, with weekday profiles reflecting work-related parking and weekend profiles
highlighting increased leisure activity. Households with shared cars showed higher driving activity and shorter
parking durations than households with a 1:1 car-to-license ratio or surplus vehicles. Six distinct car usage
clusters were identified for weekdays and four for weekends.
1 INTRODUCTION
The transition to renewable energy sources such as
solar, wind, and hydro is accelerating worldwide. In
2023, renewable energy accounted for 48% of
electricity generation in the Netherlands, equivalent
to more than 55 billion kWh (Statistics Netherlands
(CBS), 2024). While this progress brings significant
environmental benefits, it also poses new challenges
for the energy grid. The intermittent nature of solar
and wind energy production means that supply often
peaks when demand in residential areas is low, such
as in the afternoon when the sun unfolds its full power
or during periods of high wind, which are also
typically in the afternoon, while the highest energy
demand in these areas commonly occurs in the
mornings and evenings when people are at home to
take a shower or charge their cars, for example.
This mismatch between supply and demand is
increasingly pushing the energy grid to its limits, as
a
https://orcid.org/0009-0000-3173-0995
b
https://orcid.org/0000-0002-9785-3135
c
https://orcid.org/0000-0003-1493-6750
d
https://orcid.org/0009-0000-1382-3231
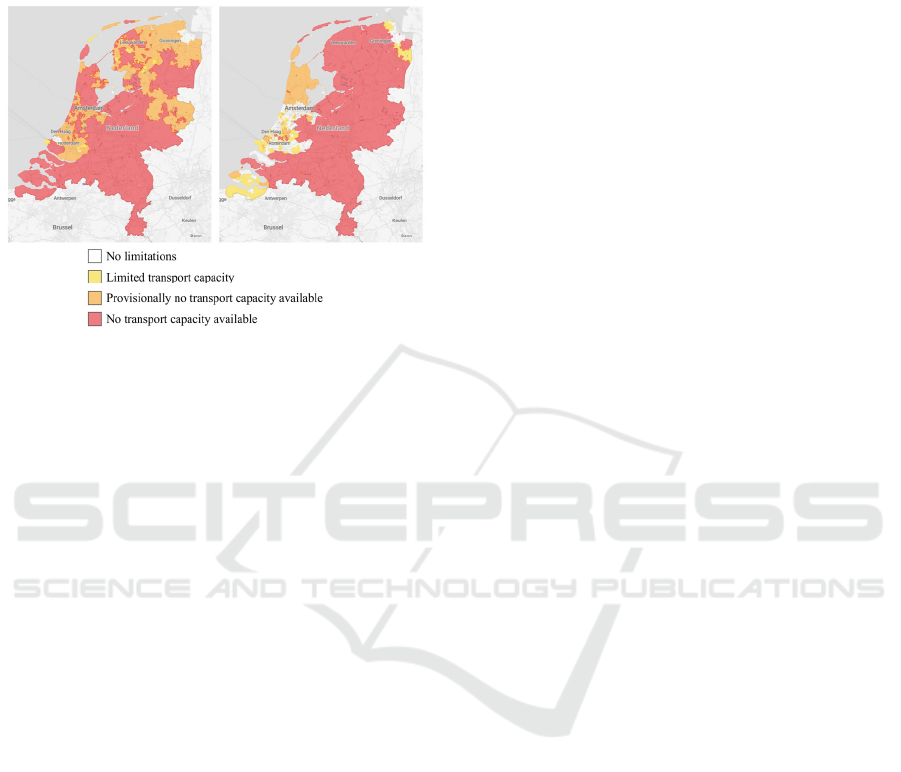
shown by the grid congestion in Figure 1
(Capaciteitskaart 2024), which occurs when
electricity cannot be transported through the grid at
that time. Without adequate energy storage solutions,
excess renewable energy is wasted during periods of
low demand, while fossil fuel-based generation may
still be required to meet peak demand in the evenings.
An ideal solution is to store excess renewable
energy at times of low demand and release it at peak
times. Vehicle-to-grid (V2G) technology offers a
promising approach to achieving this goal by
leveraging electric vehicle (EV) batteries as
distributed energy storage systems.
Although V2G is technically mature and ready for
deployment, its adoption remains limited. Key
barriers include a lack of standardization, limited
availability of V2G-compatible vehicles,
infrastructure challenges, battery degradation
concerns, and insufficient regulatory and policy
support. Besides infrastructural, technical, and
Leu, S., Correia, G. H. A., van Lint, H. and Leonhardt, A.
Understanding Car Usage Patterns for V2G Integration: Insights from Dutch Travel Diaries.
DOI: 10.5220/0013412500003941
In Proceedings of the 11th International Conference on Vehicle Technology and Intelligent Transport Systems (VEHITS 2025), pages 189-198
ISBN: 978-989-758-745-0; ISSN: 2184-495X
Copyright © 2025 by Paper published under CC license (CC BY-NC-ND 4.0)
189
regulatory boundary conditions, the actual
availability of EVs to serve as storage devices is key
to the successful deployment of V2G. Therefore,
gaining insights into car usage patterns is critical for
assessing the practical potential of V2G.
Figure 1: Grid congestion for consumption (left) and feed-
in (right) in the Netherlands on December 9, 2024
(Capaciteitskaart 2024).
This paper examines car usage patterns using real-
world mobility data from the Netherlands Mobility
Panel (Mobiliteitspanel Nederland, MPN). The MPN
includes travel diaries from individuals residing in the
Netherlands and offers comprehensive household-
level information such as details about household
members, vehicle characteristics (e.g., engine type),
and trips made.
The structure of the paper is as follows: Chapter 2
reviews relevant literature, highlighting key studies
and gaps in the context of V2G applications.
Chapter 3 presents an overview of the dataset and
details the data preparation process, including
filtering criteria and the estimation of trip departure
times. In Chapter 4, car usage profiles are developed
based on individual mobility patterns, and clustering
analysis is conducted to identify relevant usage
patterns for weekdays and weekends. The clustering
analysis results are shown and discussed in
Chapter 5, followed by a conclusion outlining the
findings' implications and directions for future
research.
2 STATE OF THE ART AND
LITERATURE REVIEW
V2G technology has been extensively studied, with
early research primarily focusing on its technical
feasibility and potential benefits, such as peak-load
shaving and reductions in total generation costs
(Zheng et al., 2019). Kempton and Tomić (2005)
demonstrated the viability of using EV batteries for
grid stabilization and renewable energy integration.
Their research highlights that automobiles are
typically used only about 4% of the time, suggesting
that V2G systems could utilize the parking time of
electric vehicles to store and supply energy. This
foundational work laid the groundwork for further
studies exploring V2G's applications, including
frequency regulation, peak shaving, and renewable
energy integration.
Building on these technical foundations,
subsequent research addresses gaps in understanding
user behavior and mobility patterns for V2G
implementation. Noel et al. (2019) highlighted a lack
of research into user behavior in the context of V2G
and stressed the importance of incorporating mobility
patterns into V2G planning. Their findings revealed
that a typical vehicle is used for driving only 4-5% of
the day.
Several studies have delved into the relationship
between mobility patterns and parking durations,
showing the temporal availability of EVs for grid
services. For instance, Fu et al. (2021) used travel
surveys from the German Mobility Panel (MOP) to
identify the V2G potential of passenger cars. They
applied a two-level clustering method to analyze
driving and parking patterns, focusing on parking
locations and durations. The study identified ten
different weekday driving patterns, highlighting a
significant potential for V2G participation. Similarly,
Demirci et al. (2023) noted that many studies fail to
consider how driving and charging behavior patterns
influence V2G integration. Their research proposed a
framework for processing EV driving and charging
behaviors to improve charging management
operations, incorporating recent advancements and
real driving data. By evaluating attributes such as
charging location, charging duration, charging levels,
and charging times, the study aims to create a realistic
and consistent dataset reflecting new electro-mobility
trends.
Crozier et al. (2018) clustered data from the UK
National Travel Survey to identify five typical
conventional vehicle usage profiles. They found that
70% of vehicles fall into the lowest usage group,
while 30% account for 65% of total fleet mileage.
These findings emphasize the importance of
identifying underutilized vehicles as potential
candidates for V2G integration. Sovacool et al.
(2017) highlighted a significant gap in research on
customer acceptance and driving behavior in the
context of vehicle-grid integration.
VEHITS 2025 - 11th International Conference on Vehicle Technology and Intelligent Transport Systems
190

Using real-world mobility data, such as the
German travel survey analyzed by Fu et al. (2021),
has significantly advanced our understanding of
users' driving behavior. Building upon these methods,
this study leverages data from the MPN, which
provides comprehensive information on household
travel patterns. To the best of our knowledge, this is
the first study to process and analyze real-world
mobility data from the MPN to gain comprehensive
insights into the general car usage profiles of the
Dutch population. By focusing specifically on home
and workplace parking durations, this research offers
a nuanced understanding of the temporal availability
of vehicles for possible V2G applications. These car
usage profiles form the foundation for assessing V2G
potential in the Netherlands.
3 DATA: OVERVIEW AND
PREPARATION
This chapter details the most recent MPN dataset of
2022 and its preparation for analysis. A
comprehensive filtering process was applied to
ensure data reliability. Trip departure times were
estimated to improve the temporal accuracy of car
usage profiles, as the raw data provided only
aggregated time intervals.
3.1 Netherlands Mobility Panel
The MPN (Hoogendoorn-Lanser et al., 2015) gives
insights into the travel behavior of fixed groups of
individuals and households since 2013 of the Dutch
population. Participants in the panel maintain a travel
diary over three consecutive days (including
weekdays and sometimes weekends) to record their
mobility patterns. However, the MPN dataset only
allows a general distinction between day types
(weekday or weekend), as it does not specify the
exact day of the week. These anonymous travel
diaries capture detailed information such as travel
times, modes of transport, the type of start and end
location, and the purpose of each trip. Additionally,
the diaries are supplemented with personal data (e.g.,
job or driver's license) and household details (e.g.,
number of people or cars).
Based on the travel diaries, parking times of cars
at home, work, and other locations can be identified
through a series of processing steps. The analysis
begins with data preprocessing, which includes
filtering out implausible entries and irrelevant
households. Although the original MPN dataset was
designed to be nationally representative, the sample's
representativeness after filtering was not explicitly
assessed. However, as filtering was based on diverse
criteria, significant biases in spatial distribution are
not expected.
3.2 Data Filtering
To ensure the reliability and consistency of the
dataset, a filtering process was applied. The filtered
dataset includes only complete households with at
least one licensed driver and one car. A complete
household is one, as Hoogendoorn-Lanser et al.
(2014) defined it as when all members aged 12 and
older fully complete the three-day online travel diary.
Incomplete households were not included in the
analysis, as missing data could compromise the
accurate reconstruction of vehicle usage behavior.
This step is crucial because individuals with car usage
without a completed travel diary would result in
incomplete or misleading data for household car
usage. Table 1 outlines the sequential filtering steps
and the corresponding number of households retained
at each stage. The initial dataset consisted of 3,108
households. First, households without at least one
member completing the full three-day online travel
diary were excluded, reducing the sample to 2,505.
Next, households without at least one licensed driver
were removed, leaving 2,227 households. A further
refinement excluded those without at least one car,
leaving 2,059 households. Finally, only complete
households that met all three previous criteria were
included in the final dataset of 1,661 households,
which formed the basis for detailed analysis.
Table 1: Filtering process to identify relevant households.
Travel diary
≥ 1
Driver’ s license
≥ 1
Car
≥ 1
Complete
households
Number of
households
3,108
x 2,505
xx 2,227
xxx 2,059
xxxx 1,661
Table 2 provides an overview of the relevant
information extracted about the individuals and cars
in these households.
Understanding Car Usage Patterns for V2G Integration: Insights from Dutch Travel Diaries
191

Table 2: Details of relevant households.
N
umber of persons 3,246
N
umber of persons with driver’s licenses 2,628
N
umber of cars 2,118
N
umber of households with fewe
r
cars
than persons with driver’s licenses
546
In 546 households, there are fewer cars than
individuals with driver’s licenses, indicating that car
sharing is necessary among household members. This
aspect is particularly relevant for the methodology
used to generate car usage profiles, as it directly
impacts vehicle availability and utilization patterns.
A "record," as referred to in
Table 3, can be either
a trip segment or a survey day without any recorded
trips by the members of the household. A trip must
consist of at least one trip segment. If the mode of
transport is changed during a trip or there is a brief
interruption, but the destination remains the same, a
new trip segment is created. The dataset contains
22,487 trip segments and 1,696 records representing
days without trips.
Table 3: Overview of records in the dataset.
N
umber of records in travel data 24,183
N
umber of records in travel data with
transport mode ca
r
8,828
The trip segments in the dataset lack detailed
information such as duration, segment destinations,
or mileage. Instead, the dataset only provided
aggregate information for the entire trip (e.g., total
duration, final destination, and total mileage). This
limitation did not pose issues for trips where all
segments shared the same transportation mode.
However, it became problematic for trips involving
multiple modes, particularly those where the car was
used as the driver for at least one segment. Without
detailed segment-level data, it is impossible to
reconstruct car usage or meaningfully analyze such
trips comprehensively. To address this issue, all
households where members recorded trips with
multiple transportation modes and at least one trip
segment involving a car as the driver were excluded
from the relevant dataset. This adjustment impacted
72 households, resulting in a refined dataset of 1,589
relevant households with 2,027 cars. Among these
households, 985 have an equal number of cars and
individuals with driver’s licenses, indicating a one-to-
one correspondence between vehicle ownership and
potential users. In contrast, 522 households have
fewer cars than individuals with driver’s licenses,
which suggests that car sharing is necessary among
household members. Additionally, 82 households
have more cars than individuals with driver’s
licenses, indicating surplus vehicle availability.
Some inconsistencies were identified in the data
set. In the travel diary, specific entries show
individuals with two consecutive trips, both labeled
with the objective "going home," where the first trip
was not part of a round trip. Such a trip chain is
logically impossible, as an individual already at home
cannot take another trip with the objective of "going
home" without leaving first. This inconsistency was
observed in 18 instances, which were carefully
analyzed. It was determined that, in most cases,
respondents appeared to forget to mark a subsequent
trip as part of a round trip. For example, a respondent
might return "to home" by car and then take a walk,
also marked as "to home." In such cases, the walking
trip was corrected and classified as a round trip.
All respondents completed the travel diary in at
least three days, though three recorded trips occurred
before the first official day of the survey. To maintain
consistency and comparability across the dataset,
only the data from the officially recorded days for
each respondent were included in the analysis.
3.3 Estimating Trip Departure Times
One of the most critical steps in the preprocessing of
the data was the estimation of the departure times of
the trips in the travel diaries. In the original dataset,
departure times are summarized in predefined time
classes, as shown in Table 4.
Table 4: Allocation of departure time classes to time ranges.
Departure Time Class Time Ranges
1 00:00 to 04:00
2 04:00 to 07:00
3 07:00 to 08:00
4 08:00 to 09:00
5 09:00 to 12:00
6 12:00 to 13:00
7 13:00 to 14:00
8 14:00 to 16:00
9 16:00 to 17:00
10 17:00 to 18:00
11 18:00 to 19:00
12 19:00 to 20:00
13 20:00 to 23:59
However, departure times with a higher resolution
are essential for the creation of vehicle usage profiles
for later investigation of V2G potential. In this study,
a time resolution of five minutes was chosen to
improve accuracy. The process of estimating trip
VEHITS 2025 - 11th International Conference on Vehicle Technology and Intelligent Transport Systems
192
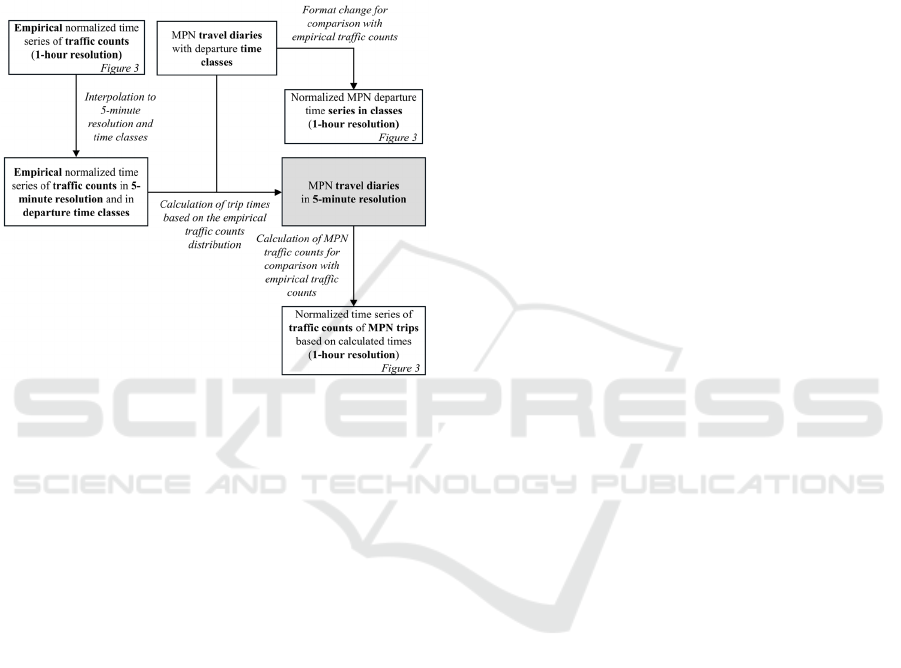
departure times is shown in Figure 2. At the
beginning of the process, empirical normalized traffic
count data at a one-hour resolution is interpolated to
a five-minute resolution, incorporating departure time
classes. Next, trip times for MPN travel diaries are
estimated based on the empirical traffic count
distribution. Finally, the refined normalized departure
times are compared with the empirical traffic counts
to ensure consistency and accuracy.
Figure 2: Process of estimating trip departure times.
Time series of traffic counts for the Netherlands
were analyzed to estimate trip departure times with a
five-minute resolution, referring to the empirical
work of Andriesse et al. (2021)
.
The empirical traffic count time series used
(orange curve in Figure 3) is the normalized one of
the Waterleidingstraat, Rosmalen, as reported by
Andriesse et al. (2021). This time series of traffic
counts was taken from a cross-section of the street,
covering both directions of traffic, in order to reduce
peaks in a single direction. Although other traffic
count time series could also be applied, the one
presented here is representative. The time series
chosen was the one that was most similar to the MPN
departure time classes in the normalized form at one-
hour resolution (blue curve in Figure 3). This curve
was constructed by summing all values within each
time class, normalizing them, and converting them to
hourly values based on the intervals defined in Table
4. In particular, the MPN time series of departure
times shows a less pronounced drop after the morning
peak hour and a more subdued afternoon peak than
the empirical time series.
To generate departure times in five-minute
resolution, the trips were assigned within their
corresponding time ranges while ensuring adherence
to observed traffic patterns. The goal was to align the
values within each time class with the empirical time
series of traffic counts as closely as possible. To
achieve this, the empirical curve from Andriesse et al.
(2021) was divided into the same time classes as the
MPN data for direct comparison. Every class was
normalized, and all values from each class were
interpolated into five-minute intervals for higher
resolution. Then, trip departure times were assigned
based on the empirical normalized times series of
traffic counts for each time class.
The departure times directly affect the calculation
of arrival times, which are calculated by adding the
travel time, rounded to the nearest five-minute
interval, to the departure time. For travel times
between one and four minutes, the values are always
rounded to five minutes to ensure they remain
recognizable as trips.
Additionally, constraints were implemented to
ensure data integrity, which may have caused slight
deviations from the empirical curve.
If a person makes a trip within a specific time
range on a given day, any subsequent trip (with a
higher trip ID) can only start after the preceding
trip has ended.
All records were adjusted to conclude at the end
of the survey day for consistency. For instance, if
a trip extended into the following day (e.g.,
ending at 01:25), it was truncated at 23:59 of the
survey day. In the 77 cases where this occurred,
the record reflects that the individual was still
traveling at the cutoff time.
While the departure times were aligned
with the empirical time series of traffic counts,
the MPN time series of traffic counts (red curve
in Figure 3) is additionally influenced by the
recorded travel times. This curve represents the
normalized time series of traffic counts at a one-
hour resolution, calculated based on the time
trips occur—encompassing everything between
departure and arrival times. It demonstrates that
the calculated times align well with the empirical
traffic counts, except for a slight deviation at the
midday peak.
4 METHODOLOGY:
IDENTIFICATION OF CAR
USAGE PATTERNS
The principal aim of this study is to derive typical car
usage profiles from the MPN data. Thus far, the
analysis has considered complete travel diaries
Understanding Car Usage Patterns for V2G Integration: Insights from Dutch Travel Diaries
193

encompassing trips made via various transport
modes. This section outlines the methodology for
creating car mobility profiles, with a specific focus on
trips where the transportation mode is recorded as
"car as a driver."
The process comprises three principal stages.
Initially, car usage profiles are generated for each
individual based on the recorded trips. Subsequently,
these profiles are aggregated to create actual car
usage profiles for cars. Finally, clustering algorithms
are employed to identify distinct usage patterns. The
car usage profiles are generated based on recorded
travel diaries, thereby providing insights into overall
usage behavior without distinguishing between EVs
and internal combustion engine vehicles. This
approach ensures a comprehensive analysis of trip
chains across the entire vehicle fleet.
4.1 Creation of Car Usage Profiles per
Individual
A five-minute mobility profile (288 entries) was
created for each person and survey day to capture
individuals' daily car mobility patterns. Each profile
tracks the individual's location and activity status
throughout the day with the car, represented by the
following states: H (Home), W (Work), and O (Other
locations).
If no trips with a car were recorded for an
individual on a specific day, the profile was filled
entirely with H (Home), which means the individual
had no car activity that day.
For individuals with recorded car trips, the
departure and arrival times were used to mark periods
of driving (D) and location changes based on the
trip’s purpose (H, W, and O).
4.2 Creation of Car Usage Profiles
The car mobility profiles of individuals are
aggregated into car usage profiles per car and day
type. Therefore, the households were classified into
three groups based on the ratio of vehicles to licensed
drivers:
Households where the number of cars matches
the number of individuals with driver’s licenses
Households with more vehicles than licensed
drivers
Households with fewer than licensed drivers
For households with the same number of cars and
licensed drivers, each vehicle was directly assigned to
a single individual’s car usage profile.
For households with more cars than licensed
drivers, unused vehicles were assumed to remain at
home (H) throughout the day.
Conversely, for households with fewer vehicles
than licensed drivers, individual mobility profiles are
aggregated to simulate shared car usage. This
approach aggregates vehicle usage profiles within
households based on data on car usage profiles per
individual. These data are assigned to vehicles, with
vehicle locations updated accordingly to reflect their
use. The final output is a structured dataset that
captures the usage patterns of each car throughout the
day.
The final dataset offered vehicle usage profiles,
detailing each car's location and activity status
throughout the day and distinguishing between
weekday and weekend patterns, as shown in Table 5.
Table 5: Excerpt of car usage profiles per car.
Car ID
Usage
Profile
Day Type
1-
3026
…WWWWWWWWWWW
WWWWDDDDDDDDDD
DDDDDDDDDDHHHH…
Weekday
2-
3005
…HHHHHHHHHHHHHH
HHHDDDDDDDDDDDDD
DDDDDDDOOOOOOO…
Weekend
4.3 Clustering of Car Usage Profiles
The k-medoids clustering algorithm, using Hamming
distance, was applied to the aggregated car usage
profiles, to identify patterns in car usage on weekdays
and weekends. A critical parameter for the k-medoids
algorithm is the number of clusters, which
significantly influences the interpretability and
accuracy of the clustering results. Both the elbow
method (Thorndike, 1953) and silhouette analysis
(Rousseeuw, 1987) were employed to determine the
optimal number of clusters.
The elbow method evaluates the total within-
cluster variance (inertia) for different cluster counts.
The "elbow" point, where the variance rate decreases
significantly, indicates the optimal number of
clusters. The silhouette analysis measures the
cohesion and separation of clusters, with higher
silhouette scores suggesting better-defined clusters.
According to Januzaj et al. (2023), the highest
silhouette score generally corresponds to the optimal
number of clusters.
VEHITS 2025 - 11th International Conference on Vehicle Technology and Intelligent Transport Systems
194
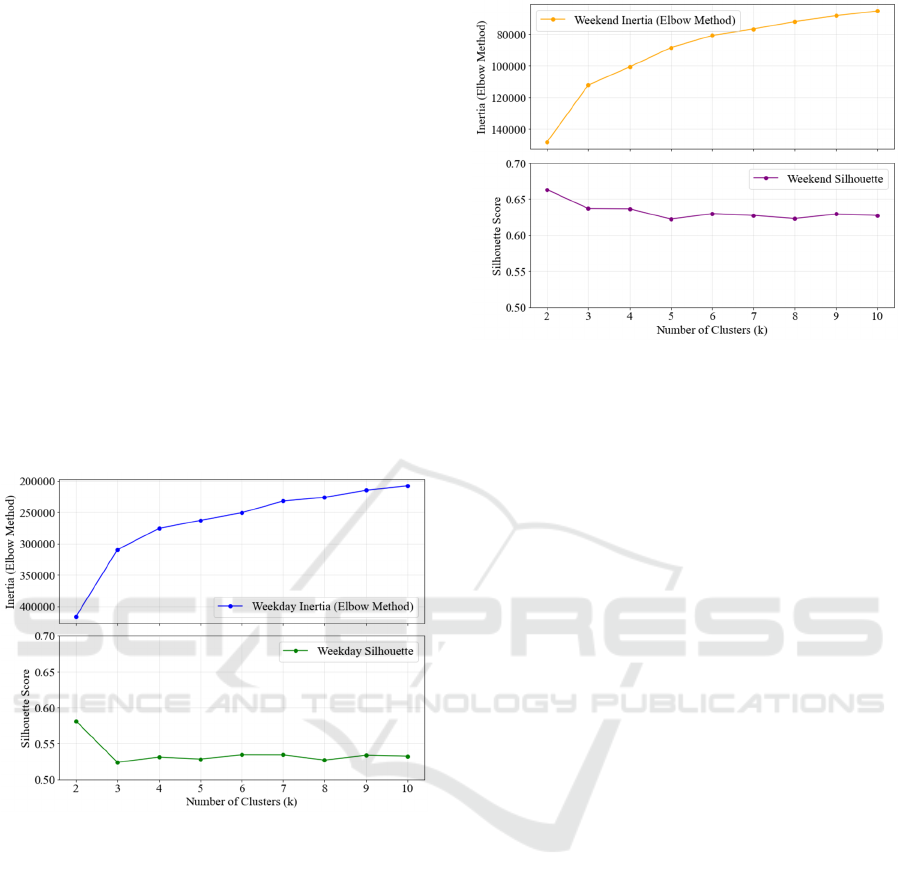
For weekdays, the silhouette analysis indicated
the highest score with two clusters, as shown in
Figure 3. However, this result was deemed
insufficient to capture the diversity of car usage
patterns, as it oversimplifies the behavior observed in
the dataset. While not yielding a definitive "elbow,"
the elbow method suggested a potential range
between four and six clusters. Upon analyzing results
with more than six clusters, it became evident that the
additional clusters offered little meaningful
distinction. For example, with seven clusters, two
clusters represented shopping and leisure activities
with only minimal differences in timing, making
them difficult to interpret or justify as separate
groups. Therefore, six clusters were selected for
weekday data to balance interpretability and detail.
Although the silhouette score for six clusters was
slightly lower than for five, the additional cluster
provided more nuanced and precise insights into car
usage profiles.
Figure 3: Determining the number of clusters for weekdays.
For weekends, the elbow method suggested a
similar range, with a noticeable bend around four or
five clusters (see Figure 4). However, the silhouette
score analysis showed a significant decline in
cohesion with five clusters compared to four. Based
on these findings, four clusters were chosen for
weekend data.
In summary, six clusters were selected for
weekdays and four for weekends, showing
characteristics of Dutch vehicle usage during these
periods.
Figure 4: Determining the number of clusters for weekends.
5 RESULTS
The six distinct car usage patterns for weekdays are
illustrated in Figure 5. Each cluster represents a
typical car usage profile, showing obvious differences
in the temporal distribution of vehicle activity states
(home, work, other locations, driving).
The largest cluster (#1), representing 71.7% of the
dataset, is characterized by cars that remain
predominantly at home throughout the day with
minimal driving activity. This cluster indicates a
significant portion of vehicles that are primarily
parked, suggesting a high potential for V2G
applications, as these vehicles are readily available
for energy storage and grid interaction. The
dominance of this cluster reflects the overall low
utilization of vehicles during weekdays, consistent
with findings in mobility studies in Chapter 2, where
most private vehicles remain unused for most of the
day.
The second-largest cluster (#2), comprising
15.0% of the dataset, corresponds to the classic
commuter profile. Vehicles in this cluster are
primarily driven in the morning and evening, with
extended parking durations at work during the day.
This pattern emphasizes the potential for workplace-
based V2G systems.
Cluster #4, comprising 3.6% of the dataset, also
presents a commuter profile, indicating the driving
activities in the morning and evening and parking at
work during the day. However, the only difference
with cluster #2 is that the car is parked overnight at a
different location from home.
Cluster #3, accounting for 4.0% of the dataset,
represents vehicles primarily used for shopping.
These cars exhibit sporadic driving activity
Understanding Car Usage Patterns for V2G Integration: Insights from Dutch Travel Diaries
195
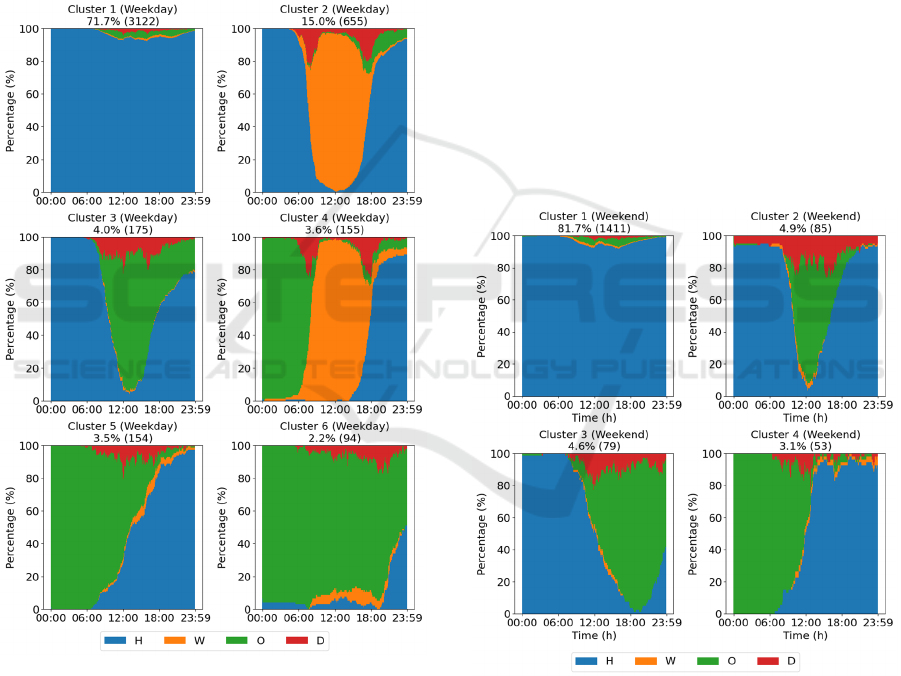
throughout the day and are parked at various non-
work locations for extended periods.
In clusters #5 and #6, representing 3.5% and 2.2%
of the dataset, respectively, the car is parked at
another place at the beginning and at home at the end
of the day. The other place could be a hotel, a second
home, or a partner's place. During the day, cars show
sporadic driving activity. They are parked for
extended periods at different non-work locations,
which could indicate less typical weekday use, such
as non-routine travel for work or leisure. These
patterns highlight the diversity of weekday travel
scenarios, including overnight stays or irregular
driving patterns.
Figure 5: Car usage profiles for weekdays.
Figure 6 presents the clustering results for
weekend car usage, showing four usage patterns.
The largest cluster (#1), representing 81.7% of the
dataset, captures vehicles that remain predominantly
at home throughout the day. This cluster highlights a
significant portion of cars with no activity on
weekends, reflecting limited driving needs during
these days.
The second-largest cluster (#2), comprising 4.9%
of the dataset, corresponds to cars used primarily for
shopping and leisure activities. Vehicles in this
cluster are typically driven mid-morning, parked at
non-home locations throughout the day, and return to
their home by evening.
Cluster #3 and #4, accounting for 4.6% and 3.1%
of the dataset, reflect cars used for extended weekend
trips (e.g., visiting friends, family, or travelling).
Vehicles in cluster #3 start their day at home, are
driven throughout the day, and end at another
location. Cluster #4 describes the opposite, starting at
another place and ending at home. These profiles
align with weekend getaways or extended leisure
trips, where vehicle availability for V2G is limited
during daytime hours. The unequal ratio of vehicles
leaving home and returning at the end of the day may
be attributed to some individuals being driven away
already during the week or to the dataset’s uneven
representation of Saturdays and Sundays. However,
precise information on this distribution is unavailable
because the MPN dataset, as mentioned above, is only
distinct between weekdays and weekends.
Figure 6: Car usage profiles for weekends.
The clustering results reveal distinct differences
in car usage between weekdays and weekends.
Cars are predominantly parked at home during
both periods, with slightly higher home parking times
on weekends. The stationary behavior of vehicles at
home, evident in the largest cluster for both periods,
underscores the potential for V2G applications,
particularly in residential settings.
VEHITS 2025 - 11th International Conference on Vehicle Technology and Intelligent Transport Systems
196

While weekday profiles are dominated by work-
related activity and commuting, weekend profiles
emphasize leisure-related mobility (e.g., for leisure or
shopping) and less work-related parking. The
shopping and leisure cluster highlights midday
availability, while the travel-related clusters capture
more dynamic and less predictable usage patterns.
Driving times remain minimal on both weekdays and
weekends. Table 6 provides a detailed summary of
mean parking times, standard deviations, and
differences based on the ratio of vehicles to driver’s
license holders.
Table 6: Mean times of activity state and standard deviation
for weekdays and weekends for different ratios of cars to
license holders.
Ratio of Cars to
License Holders
State
Mean Weekday
(hours)
Standard Deviation
Weekday (hours)
Mean Weekend
(hours)
Standard Deviation
Weekend (hours)
Less
Parking
at
Home
19.73 6.12 19.93 6.05
Parking
at
Wor
k
1.46 3.19 1.12 2.87
Parking
at other
2.24 4.64 2.41 4.84
Drivin
g
0.57 1.09 0.54 1.14
Equal
Parking
at
Home
19.68 6.10 20.06 6.02
Parking
at
Wor
k
1.91 3.59 1.41 3.19
Parking
at other
1.89 4.19 2.03 4.43
Drivin
g
0.52 0.92 0.50 1.14
More
Parking
at
Home
21.40 5.14 21.73 4.93
Parking
at
Wor
k
1.22 2.97 0.90 2.61
Parking
at other
1.06 3.02 1.09 3.30
Drivin
g
0.31 0.64 0.27 0.59
The analysis of vehicle usage patterns based on
the ratio of vehicles to individuals with driver’s
licenses shows that households with fewer cars than
driving license holders exhibit higher driving activity
and lower parking durations compared to households
with one or more cars per driving license holder.
Specifically, in households where cars are shared,
vehicles spend 19.73 hours on weekdays, and 19.93
hours on weekends parked at home, and 0.57 resp.
0.54 hours being driven. In households with a 1:1
ratio, the corresponding figures are 19.68 hours on
weekdays and 20.06 hours on weekends parked at
home, and 0.52 resp. 0.50 hours driven, while in
households with more cars than licensed individuals,
vehicles spend 21.40 hours on weekdays and 21.73
hours on weekends at home and are driven for only
0.31 resp. 0.27 hours.
6 CONCLUSIONS AND
OUTLOOK
This study presents a methodology for creating and
analyzing car usage profiles from the Netherlands
Mobility Panel (MPN) data, laying the groundwork
for assessing Vehicle-to-Grid (V2G) potential. In the
data, six car usage patterns are identified for
weekdays and four for weekends. For weekdays and
weekends, the most significant cluster is parking at
home over the whole day. On weekdays, there is also
a substantial share of parking at work, whereas at the
weekends, cars are often parked at other locations
than home or work. Households with shared vehicles
exhibit higher driving activity and lower parking
durations, whereas households with more vehicles
than driver license holders demonstrate longer
stationary periods. The clustering results further
illustrate the diversity in vehicle usage, capturing
patterns ranging from daily commuting to irregular
travel scenarios, such as overnight trips or extended
errands. The breakdown of these usage patterns
highlights that vehicles are predominantly parked at
home and additionally at work on weekdays.
The vehicle usage profiles developed in this study
are critical for evaluating V2G potential, as they
provide insights into when and where vehicles are
stationary and available for grid interaction.
Understanding these patterns enables the
development of tailored strategies for energy storage
and grid stabilization, optimizing V2G integration
into residential, workplace, and public settings.
Future research on creating and analyzing car
usage profiles should prioritize using more recent and
Understanding Car Usage Patterns for V2G Integration: Insights from Dutch Travel Diaries
197

detailed datasets to capture better current trends in
vehicle usage and adoption of electric vehicles (EVs).
Incorporating a classification by specific days of the
week, rather than the general distinction between
weekdays and weekends, would provide a more
accurate representation of mobility patterns, as travel
behavior is likely to vary across different days.
Additionally, improving spatial granularity—such as
distinguishing between urban, suburban, and rural
areas—would allow for a more nuanced analysis of
car usage. This enhanced approach would help
identify regional variations and offer deeper insights
into V2G potential across diverse geographic and
socio-economic contexts.
ACKNOWLEDGMENTS
This research is part of the project MORE – Munich
Mobility Research Campus. The project is funded by
dtec.bw – Digitalization and Technology Research
Center of the Bundeswehr. dtec.bw is funded by the
European Union – NextGenerationEU.
This publication makes use of data from the
Netherlands Mobility Panel, which is administered by
KiM Netherlands Institute for Transport Policy
Analysis.
The first author conducted this research as a guest
researcher at the Department of Transport & Planning
(TU Delft), as part of the V2G-QUESTS project (F-
DUT-2022-0241). This project was funded by the
Dutch Research Council (NWO) under the Driving
Urban Transitions Partnership which is co-funded by
the European Commission.
REFERENCES
Andriesse, Rico, Nico Dogterom, and Joran van Kessel.
2021. “Fietsstraten Buiten de Bebouwde Kom
Aanbevelingen Voor Toepassing En Vormgeving.”
https://www.fietsberaad.nl/getmedia/1138dea5-b287-
4aa0-8dd4-87a7b0a70574/Rapportage-Fietsstraten-
buiten-de-bebouwde-kom-(007309-20201204-R1-
02).pdf.aspx?ext=.pdf (November 27, 2024).
Capaciteitskaart. 2024. “Capaciteitskaart invoeding
elektriciteitsnet.” https://capaciteitskaart.
netbeheernederland.nl (December 9, 2024).
Crozier, Constance, Dimitra Apostolopoulou, and Malcolm
McCulloch. 2018. “Clustering of Usage Profiles for
Electric Vehicle Behaviour Analysis.” In 2018 IEEE
PES Innovative Smart Grid Technologies Conference
Europe (ISGT-Europe), Sarajevo, Bosnia and
Herzegovina: IEEE, 1–6. doi:10.1109/
ISGTEurope.2018.8571707.
Demirci, Alpaslan, Said Mirza Tercan, Umit Cali, and
Ismail Nakir. 2023. “A Comprehensive Data Analysis
of Electric Vehicle User Behaviors Toward Unlocking
Vehicle-to-Grid Potential.” IEEE Access 11: 9149–65.
doi:10.1109/ACCESS.2023.3240102.
Fu, Yuzhuo, Kathrin Walz, and Krzysztof Rudion. 2021.
“Analysis of Driving Patterns in Car Traffic and Their
Potential for Vehicle-to-Grid Applications.” In 2021
IEEE Madrid PowerTech, , 1–6. doi:10.1109/
PowerTech46648.2021.9494995.
Hoogendoorn-Lanser, Sascha, Nina T. W. Schaap, and
Marie-José Olde Kalter. 2015. “The Netherlands
Mobility Panel: An Innovative Design Approach for
Web-Based Longitudinal Travel Data Collection.”
Transportation Research Procedia 11: 311–29.
doi:10.1016/j.trpro.2015.12.027.
Januzaj, Ylber, Edmond Beqiri, and Artan Luma. 2023.
“Determining the Optimal Number of Clusters Using
Silhouette Score as a Data Mining Technique.”
International Journal of Online and Biomedical
Engineering (iJOE) 19(04): 174–82. doi:10.3991/
ijoe.v19i04.37059.
Kempton, Willett, and Jasna Tomić. 2005. “Vehicle-to-
Grid Power Implementation: From Stabilizing the Grid
to Supporting Large-Scale Renewable Energy.”
Journal of Power Sources 144(1): 280–94.
doi:10.1016/j.jpowsour.2004.12.022.
Noel, Lance, Gerardo Zarazua De Rubens, Johannes
Kester, and Benjamin K. Sovacool. 2019. Vehicle-to-
Grid: A Sociotechnical Transition Beyond Electric
Mobility. Cham: Springer International Publishing.
doi:10.1007/978-3-030-04864-8.
Rousseeuw, Peter J. 1987. “Silhouettes: A Graphical Aid to
the Interpretation and Validation of Cluster Analysis.”
Journal of Computational and Applied Mathematics
20: 53–65. doi:10.1016/0377-0427(87)90125-7.
Sovacool, Benjamin K., Jonn Axsen, and Willett Kempton.
2017. “The Future Promise of Vehicle-to-Grid (V2G)
Integration: A Sociotechnical Review and Research
Agenda.” Annual Review of Environment and
Resources 42(1): 377–406. doi:10.1146/annurev-
environ-030117-020220.
Statistics Netherlands (CBS). 2024. “Nearly Half the
Electricity Produced in the Netherlands Is Now
Renewable.” Statistics Netherlands. doi:10/nearly-half-
the-electricity-produced-in-the-netherlands-is-now-
renewable.
Thorndike, Robert L. 1953. “Who Belongs in the Family?”
Psychometrika 18(4): 267–76. doi:10.1007/
BF02289263.
Zheng, Yanchong, Songyan Niu, Yitong Shang, Ziyun
Shao, and Linni Jian. 2019. “Integrating Plug-in
Electric Vehicles into Power Grids: A Comprehensive
Review on Power Interaction Mode, Scheduling
Methodology and Mathematical Foundation.”
Renewable and Sustainable Energy Reviews 112: 424–
39. doi:10.1016/j.rser.2019.05.059.
VEHITS 2025 - 11th International Conference on Vehicle Technology and Intelligent Transport Systems
198
