
The Integration of Time Series Anomaly Detection into a Smart Home
Environment
Eran Kaufman, Yigal Hoffner, Adan Fadila, Amin Masharqa and Nour Mawasi
Department of Software Engineering, Shenkar College, Israel
Keywords:
Smart Home Architecture, Anomaly Detection Methods, Anomaly Management Process.
Abstract:
Smart home IoT systems have become integral to modern households. To ensure security and safety, prevent
hazards, accidents and health emergencies, optimize resource usage, and maintain system reliability, it is es-
sential to have anomaly detection as an integral part of the home management system. Integrating anomaly
detection into the smart home environment requires it to be extended to a comprehensive anomaly manage-
ment process that can be broken down into several stages: data collection and aggregation, anomaly detection,
anomaly assessment, decision-making, action-taking, logging and analysis of anomaly events and responses.
Our work focuses on three key contributions. First, we explore anomaly detection algorithms to improve de-
tection accuracy, improve classification, and provide users with detailed information on identified anomalies.
Second, we present a step-by-step breakdown of the anomaly management process, highlighting how anomaly
detection functions as its critical subprocess. Finally, we provide an in-depth explanation of how this man-
agement process is seamlessly integrated into a functional smart home environment, ensuring a cohesive and
effective approach to anomaly handling.
1 INTRODUCTION
Smart home IoT systems are growing in popularity
in the consumer market, providing the convenience
of automating various aspects of daily life. However,
they also raise concerns about the kind of anomalies
that can take place in the home environment.
Anomalies in smart home environments can be
categorized based on their nature and severity, en-
abling tailoring the response accordingly. Security
anomalies include intrusion attempts, cybersecurity
threats, and tampering with security devices. Safety
and emergency anomalies involve fire hazards, water
leaks, electrical problems, and other immediate dan-
gers for the residents. Resident health and well-being
anomalies cover medical emergencies and deviations
from normal routines. Energy and resource usage
anomalies include excessive resource consumption,
such as electricity and water wastage. System mal-
functions and operational anomalies arise from sen-
sor failures, automation errors, and communication
issues. Lastly, behavioral and routine deviations in-
volve unexpected resident behavior, device usage.
Automatic detection of any anomalous status of
smart home systems (Sikder et al., 2021; Fu et al.,
2021) is used to counter threats such as unauthorized
access, deviations in user interactions, and malicious
activities such as attempts to reconfigure devices or
abnormal device usage.
According to (Fernandes et al., 2016; Guan et al.,
2020) security threats in a smart home environ-
ment can be broadly categorized into two types of
anomalies: physical threats and cyber security sys-
tem threats. Physical threats involve detecting un-
usual activities, such as vandalism, burglaries, or ter-
rorist attacks, through motion sensors and security
cameras. Cybersecurity threats can affect user safety
in the physical world due to the unreliable and vulner-
able nature of current IoT devices (Chi et al., 2022; Fu
et al., 2022).
Energy and resource usage anomalies are iden-
tified by detecting excessive energy consumption or
malfunctions in appliances such as water heaters or
air conditioning units (Hnat et al., 2011).
Safety concerns encompass immediate risks, such
as smoke detector alarms, water leaks, unusual noise,
abnormal temperature or humidity levels, and open
doors or windows at night or when the house is empty.
In addition, resident behavior is analyzed to rec-
ognize unusual patterns in resident behavior and de-
viations from daily routines, such as inactivity during
waking hours or potential health emergencies, espe-
Kaufman, E., Hoffner, Y., Fadila, A., Masharqa, A. and Mawasi, N.
The Integration of Time Series Anomaly Detection into a Smart Home Environment.
DOI: 10.5220/0013423300003944
In Proceedings of the 10th International Conference on Internet of Things, Big Data and Security (IoTBDS 2025), pages 153-163
ISBN: 978-989-758-750-4; ISSN: 2184-4976
Copyright © 2025 by Paper published under CC license (CC BY-NC-ND 4.0)
153

cially for the elderly.
The above concerns have strengthened the de-
mand for effective anomaly detection systems to im-
prove security, safety, health, operational correctness,
and efficiency. This resulted in numerous articles that
discuss anomaly detection in the home context, focus-
ing mainly on the technical aspects of detection (Xiao
et al., 2024; Jiang et al., 2022; Ramapatruni et al.,
2019; Shin et al., 2011; Fahad and Rajarajan, 2015).
Most articles do not include any discussion of how
detection fits into the broader anomaly management
process and how this management process integrates
with routine home management.
1.1 Our Contribution
Integrating anomaly detection into the smart home en-
vironment requires it to be extended to a comprehen-
sive anomaly management process that can be bro-
ken down into several stages: data collection and ag-
gregation, anomaly detection, anomaly assessment,
decision-making, action-taking, logging, and analysis
of anomaly events and responses.
We therefore offer several complementary per-
spectives on anomaly management:
1. Exploring anomaly detection algorithms to im-
prove detection and classification and provide
users with detailed information about identified
anomalies.
2. Presenting a step-by-step breakdown of an
anomaly management process that incorporates
anomaly detection as one of its sub-processes.
3. Providing an in-depth explanation of how the
anomaly management process is seamlessly inte-
grated into a functional smart home environment.
The structure of the paper is as follows. Section
2 presents a survey of related work on anomaly de-
tection and describes the different anomaly detection
methods used in our system. Section 3 presents a de-
tailed architecture of our smart home system as the
basis for integrating the anomaly management pro-
cess. Section 4 describes the anomaly management
process as an integral part of the smart home architec-
ture. Section 5 describes the experiments carried out
with our system’s different anomaly detection meth-
ods. Section 6 presents conclusions and future work.
2 RELATED WORK
Many recent articles have addressed the issue of
anomaly detection specifically for the home environ-
ment. For example, AEGIS observes the change in
Figure 1: Point-wise, contextual and collective anomalies.
device behavior based on user activities and builds
a contextual model to differentiate benign and ma-
licious behavior (Sikder et al., 2021). (Choi et al.,
2018) precomputes sensor correlation and the transi-
tion probability between the sensor states and finds
a violation of the sensor correlation and transition to
detect and identify the faults. PFirewall (Chi et al.,
2021) utilizes the semantic information from the au-
tomation rules to protect smart home users’ privacy
by filtering out unnecessary events, and HAWatcher
(Fu et al., 2021) mines inter-device correlations and
uses them to detect device anomalies.
More general time series anomaly algorithms can
be categorized as shown in figure 1 and described in
(Bao et al., 2018):
1. Point-Wise Anomalies. Also known as global
outliers, these points lie outside a user-defined
sensitivity parameter over the entirety of a data
set. This user-defined threshold is used to balance
between type 1 and type 2 statistical errors.
2. Contextual Anomalies. Also referred to as con-
ditional outliers, these anomalies have values that
significantly deviate from other data points that
exist in the same context (usually a period) but are
not significant in the global sense. The value is
found within global expectations but may appear
anomalous within specific seasonal data patterns.
3. Collective Anomalies. When a subset of contin-
uous points within a set is anomalous to the entire
dataset. In this category, individual values are not
anomalous (neither globally nor contextually), but
the entire subset is. Individual behavior may not
deviate from the normal range in a specific sec-
tion, but these anomalies become apparent when
combined with other sections.
Another way to categorize anomalies is based
on their implementation method (Bao et al., 2018).
These include statistical, predictive, clustering, di-
mensionality reduction, or reconstructive-based mod-
els.
2.1 Statistical Models
Statistical models generate statistical measures, such
as mean, variance, median, quantile, kurtosis, skew-
ness, etc. Newly added time-series data can be exam-
IoTBDS 2025 - 10th International Conference on Internet of Things, Big Data and Security
154

ined using the generated model to see if it falls inside
the normal boundary (Markou and Singh, 2003).
2.2 Predictive Models
Predictive models are among the most common ap-
proaches to anomaly detection. These methods fore-
cast future states based on past and current states. We
can deduce the anomaly according to the severity of
the discrepancy between the predicted value and the
real one. For example, autoregressive integrated mov-
ing average (ARIMA) (Box and Pierce, 1970) is fre-
quently employed to forecast time series.
The ARIMA model is made of three parts:
1. An auto-regressive (AR) component, composed
of a weighted sum of lagged values, can model
the value of a random variable X at time step t as:
AR(P) : X
t
= φ
1
X
t−1
+ φ
2
X
t−2
+ . . . + φ
p
X
t−p
+ ε
t
(1)
where {φ
i
} are auto correlationents and ε is white
noise. The parameter p is the order of AR model.
2. A moving-average (MA) component that com-
putes the weighted sum of lagged prediction er-
rors and is formulated as:
MA(q) : X
t
= ε
t
−θ
1
ε
t−1
−θ
2
ε
t−2
−. . . −−θ
q
ε
t−q
(2)
where {θ
i
} are moving-average coefficients, ε
t
denotes a model prediction error at time step t,
and q is the order of MA model.
3. An integrated component representing the time-
series using differences, and thus a data point at
time step t is
ˆ
X = X
t
− X
t−1
where d denotes the
order of differencing.
The differencing process makes the time series
stationary, resulting in ARIMA being very effective
for non-stationary time series. If the time-series data
has a seasonal variation, we can use a variant called
seasonal ARIMA (SARIMA) (Williams and Hoel,
2003). In this case, we introduce additional param-
eters that deal with seasonality.
The parameters for the S/ARIMA can be learned
in a supervised or non-supervised manner. In a non-
supervised manner, the order of p and q can be deter-
mined by using the sample autocorrelation function
or via the Akaike information criterion.
In a supervised manner, the parameters are learned
from a training set using cross-validation.
Another commonly used algorithm is the season-
trend decomposition (STL). STL is a statistical
method for breaking down time-series data into three
uncorrelated components: seasonality, trend and
residues. The trend analysis of the data shows a gen-
eral direction of the overall data, while the seasonal
analysis presents a pattern that is repeated at fixed
time intervals. The residue (noise) is the random os-
cillation or unexpected change. The frequency meta-
parameter for this algorithm can be found either by
using the autocorrelation function in the time domain
or by calculating the bandwidth of the Fourier trans-
form in the frequency domain.
In the category of predictive models, we also in-
clude the SVM regressor, the nearest neighbor regres-
sor and neural nets-based regressors. These methods
assume a ’natural’ trade line to the dataset behavior
and exclude points outside a particular ’strip’ of the
predicted line. These are contextual anomalies.
2.3 Clustering Models
Clustering-based methods are choices for grouping
the data into disjoint groups. Once a time series is
mapped into a multidimensional space, clustering al-
gorithms group them close to a cluster depending on
their similarities. Here, we assume that there is some
metric in which closely related points are close to
each other and the outliers are far away. They can
vary from centroid-based clustering like k-means to
hierarchical-based clustering like DBSCAN and oth-
ers. These algorithms are usually collective anoma-
lies and are represented in the time domain. Popular
data clustering methods include k-means algorithm
(MacQueen, 1967), one-class support vector machine
(OCSVM) (Manevitz and Yousef, 2001), or Gaus-
sian mixture model (GMM) (McLachlan and Basford,
1988).
OCSVM (Manevitz and Yousef, 2001) is an unsu-
pervised algorithm based on dividing the points into
disjoint spaces with the margin between spaces as
wide as possible. Instead of working in feature space,
it is often better to work in kernel space. Working
in kernel space provides two principal benefits. The
first is that it implicitly induces a non-linear feature
map, allowing for a richer classifier space. The sec-
ond is that when the kernel trick is available, it effec-
tively replaces the dimension of the feature space with
the size of the sample space, which allows for faster
computations. Among the most popular kernels are
the linear kernel, polynomial kernel, and radial basis
kernel (RBF).
2.4 Reconstructional Models
Dimensionality reduction and reconstructional mod-
els assume that a large-scale system can be repre-
sented using a few significant factors. Thu. Lin-
The Integration of Time Series Anomaly Detection into a Smart Home Environment
155

ear algebra-based methods include principal compo-
nent analysis (PCA) and singular value decomposi-
tion (SVD) (Wang et al., 2021).
Tree-based methods include isolation forest, and
neural network-based methods include the neural net
AutoEncoder (AE).
Isolation forest is an algorithm that detects anoma-
lies by the depth of the tree needed for isolating each
point. At the basis of the algorithm there is an as-
sumption that outliers are easier to separate from the
rest of the points, compared to ordinary points.
In principle, anomalies are farther away in the fea-
ture space and fewer splits are required than a normal
point. Anomalous points will, therefore, be defined
as points where the number of partitions required un-
til they are insulated is low.
2.5 NeuralNet Based Models
Deepnets can be used in some of the aforementioned
techniques, i.e. either as a predictive model or as a re-
constructional model. In time-series applications, the
temporal context should be considered when model-
ing the series. For this reason two general kinds of
neural nets are considered:
1. RNNS. RNNs have been extended with other vari-
ants, such as LSTM (Hochreiter and Schmidhu-
ber, 1997) and GRU (Cho et al., 2014). LSTM and
GRU address the vanishing or exploding gradient
problem, where the gradient becomes too small
or too large as the network goes deeper. There are
multiple gates in an LSTM and a GRU cell, and
they can learn long-term dependencies by deter-
mining the number of previous states to keep or
forget at every time step.
Meanwhile, the dilated RNN is proposed to ex-
tract multiscale features while modeling long-
term dependencies by using a skip connection
between hidden states. For instance, Shen et
al. (Shen et al., 2020) adopt a three-layer di-
lated RNN and extract features from each layer
to jointly consider long-term and short-term de-
pendencies. RNN-based approaches are generally
used for anomaly detection in two ways. One is
to predict future values and compare them to pre-
defined thresholds or the observed values. This
strategy is applied in (Shen et al., 2020; Hund-
man et al., 2018; Park et al., 2017; Kieu et al.,
2019). The other is to construct an autoencoder in
order to restore the observed values and evaluate
the discrepancy between the reconstructed value
and the observed one. This strategy is used in
(Hsieh et al., 2019; Li et al., 2019; Li et al., 2019;
Su et al., 2019; Guo et al., 2018).
2. CNNs. Although the RNN is the primary option
for modeling time-series data, CNN sometimes
shows better performance in several applications
that work with short term data. (Choi et al., 2020;
Wen and Keyes, 2019; Zhou et al., 2019).
By stacking convolutional layers, each layer
learns a higher level of features. In addition,
the pooling layers introduce non-linearity to the
CNN, allowing them to capture the complex fea-
tures in the sequences. Instead of explicitly cap-
turing the temporal context, the CNN models
learn patterns in segmented time series.
3 THE SMART HOME SYSTEM
ARCHITECTURE
Anomaly detection algorithms constitute merely a
component of anomaly management, and it is nec-
essary to consider the entire process and its environ-
ment. This includes identifying stakeholders, resi-
dents, relevant sensors and actuators at our disposal,
permission access lists (specifying authorization of
users for various tasks), user hierarchies, conflict res-
olution mechanisms, and the precise context in which
anomalies occur. For example, in the event of a fire
risk, it is crucial to determine whether or not a resident
is present at the house and to identify the appropriate
individuals and organizations to inform.
(Hoffner et al., 2024) have suggested a layered
architecture for the smart home environment, which
takes the above considerations into account. Their
architecture is shown in Figure 2. The system con-
sists of two channels: the data flow and the control
flow channels. The decision-making process, based
on user-defined automation rules, is the process that
connects the two channels. This is the base architec-
ture into which the anomaly management process is
integrated.
The data flow channel collects, processes, and ag-
gregates data from the home and the residents for day-
to-day functioning and the various anomaly detection
processes. The control flow channel carries out the
actions determined by the rules and their execution by
the rule interpreter in the Generic Operation Process.
The data flows from the sensors to the Sensor
Monitoring Process, to the Concrete State Process,
and finally to the Generic Event Process (Figure 2).
These processes transform the data from the sensors
to the appropriate level of abstraction to be used by
the decision-making process of the control flow chan-
nel. The data flow channel aggregates and analyzes
data from sensors and other sources and transforms
individual data points into progressively more com-
IoTBDS 2025 - 10th International Conference on Internet of Things, Big Data and Security
156
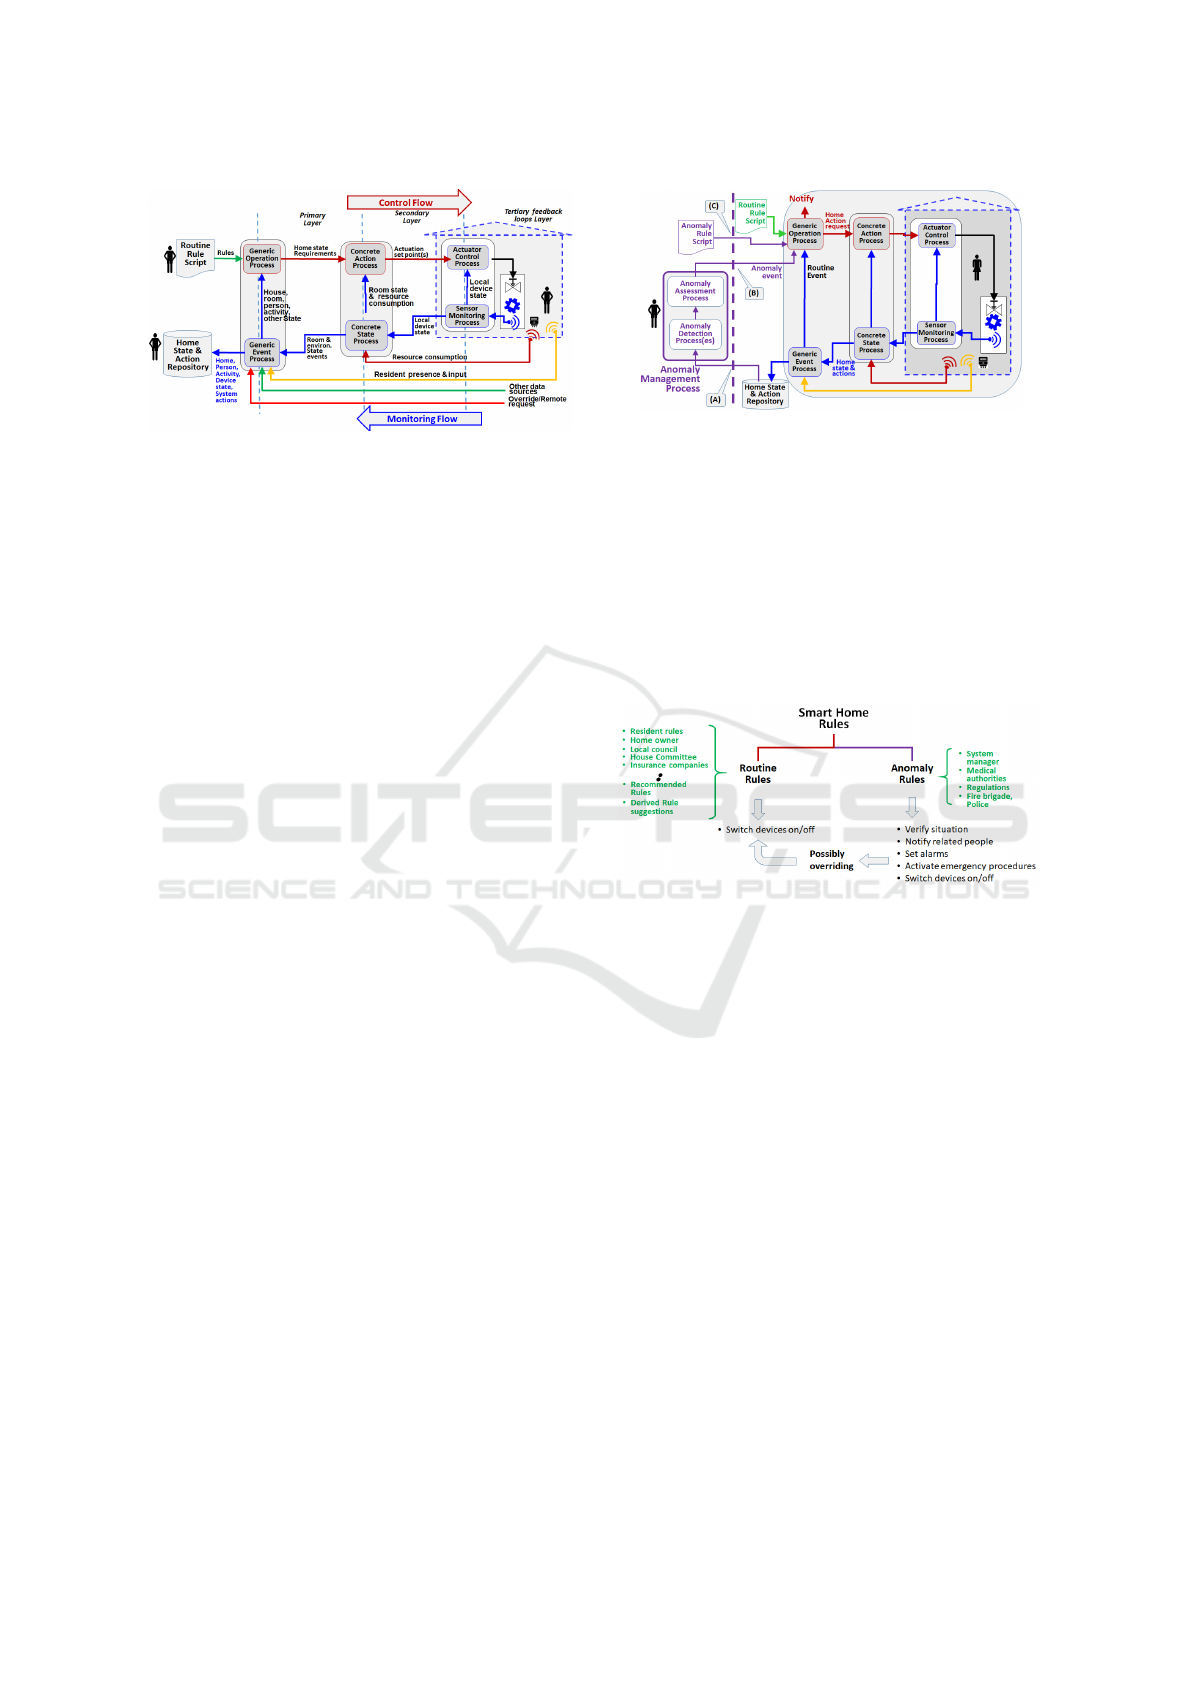
Figure 2: The architecture of the routine home management
system illustrates the control and data flow channels inter-
connected by decision-making rules executed within the in-
terpreter of the Generic Operation Process.
prehensive views of the home, going from the status
of a sensor to the condition of a room and, ultimately,
to the overall state of the home and its current occu-
pants’ activities.
In the control flow channel (Figure 2), the Generic
Operation Process has an interpreter that executes
the rules from the rule script and decides whether a
change to the home state is necessary. These deci-
sions are passed to the Concrete Action Process, ul-
timately becoming actions through the Actuator Con-
trol Process. Those decisions flow from the high-level
layer to the low-level ones, from ‘What to do’ to ‘How
to do it’ and to ‘Doing it’, where each layer adds its
relevant knowledge to the decision-making process.
4 THE INTEGRATION OF THE
ANOMALY MANAGEMENT
PROCESS INTO THE HOME
MANAGEMENT SYSTEM
The smart home management architecture shown in
figure 2 outlines the processes of collecting data from
the home environment and its residents, the decision-
making using routine rules, and the resulting action
on the home environment. These are the relevant in-
terface points for the integration of the anomaly man-
agement process, as shown in figure 3:
(A) Input from the routine home management sys-
tem about the state of the home is made available to
the anomaly detection processes.
(B) The detected anomaly and related data are for-
warded to the rule interpreter in the Generic Action
Process.
(C) The anomaly rules are provided to the rule in-
terpreter, which selects and activates the appropriate
rule in response to an anomaly event.
The decision-making process that determines the
Figure 3: Integrating the anomaly management process into
the routine home management system through three key in-
terface points.
response to an anomaly can be done by developing
special rules to decide how to act when anomalies oc-
cur. Such rules are called anomaly rules to be distin-
guished from routine rules (Figure 4). An important
conclusion from the above is that anomaly-related
rules may, in some cases, have to override day-to-day
rules. This requires the conflict detection and resolu-
tion process described in (Hoffner et al., 2024).
Figure 4: The Anomaly handling process requires adding
Anomaly rules to the already existing Routine rules. Such
rules may be activated when a corresponding anomaly is
detected.
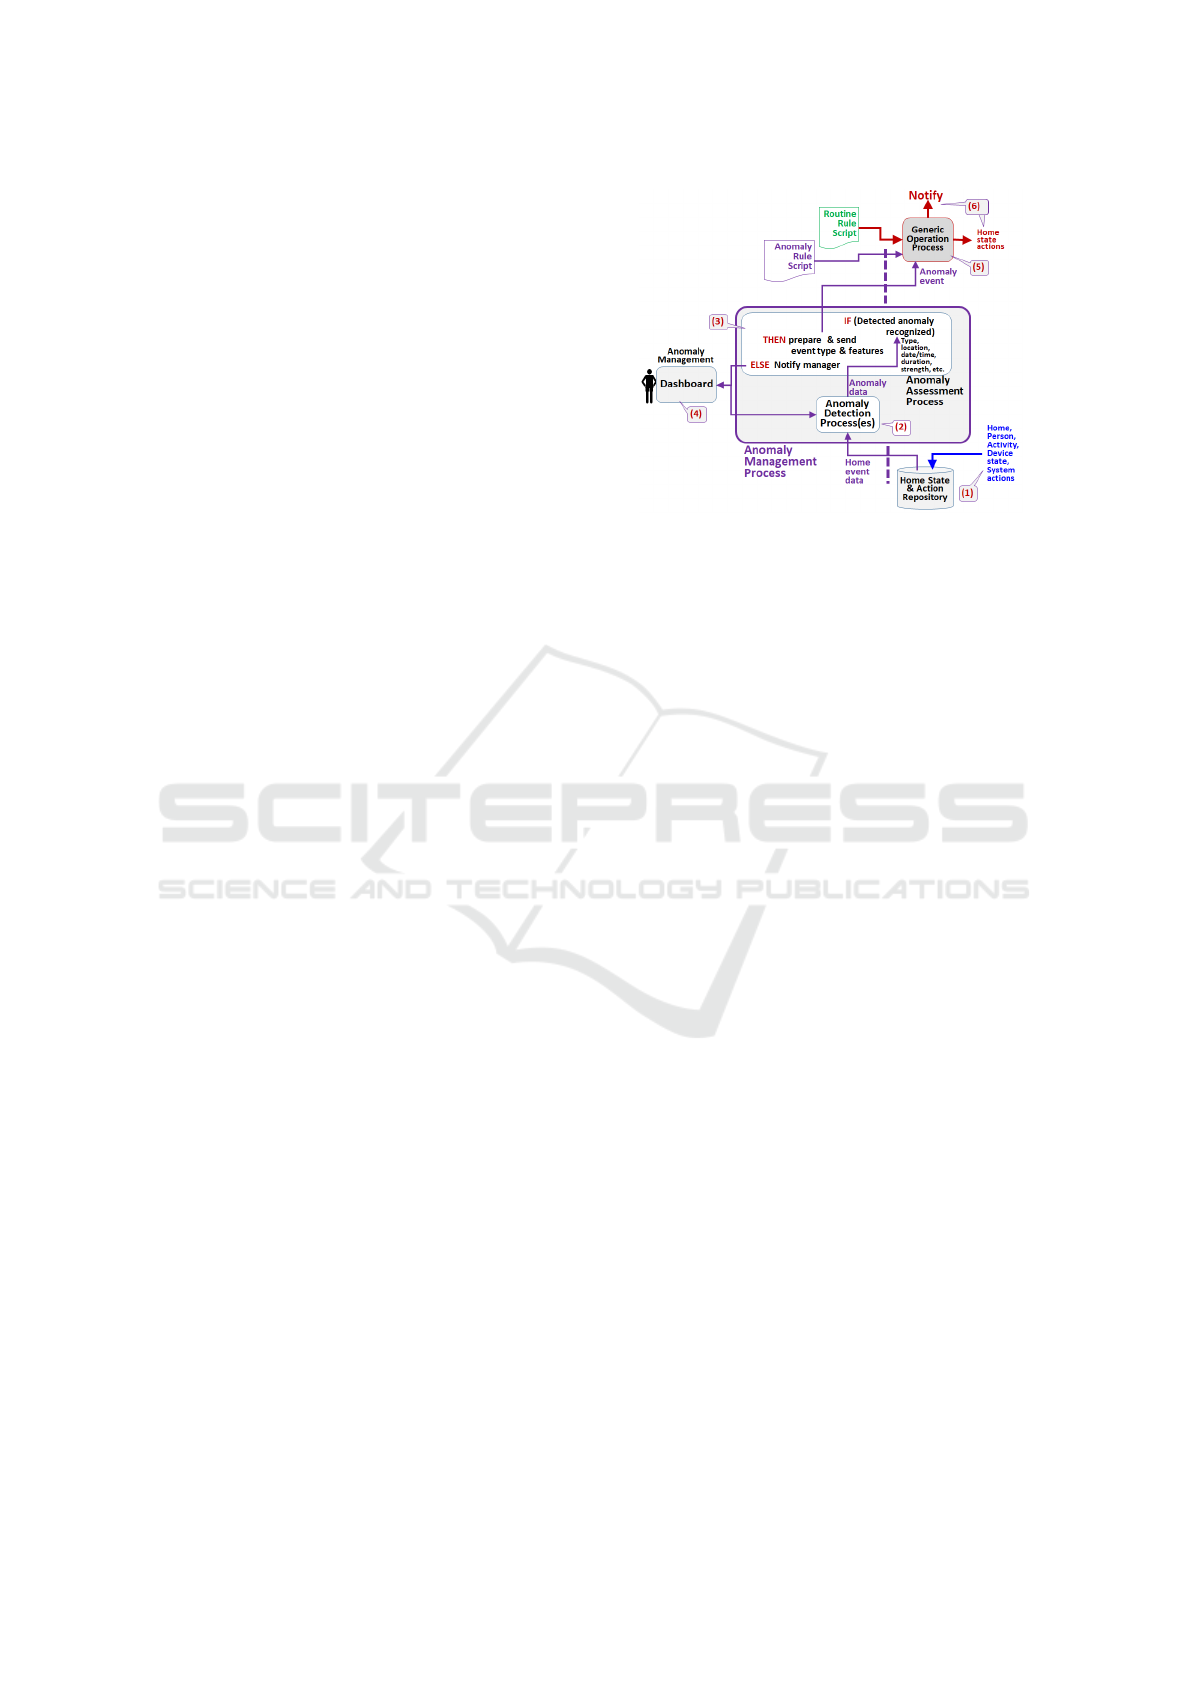
Figure 5 shows the stages of the anomaly manage-
ment process:
1. Data Collection and Aggregation: The rele-
vant data from the various sensors and user in-
put are collected and processed. In addition to
collecting sensor data, system actions, such as
switching devices on or off or opening or clos-
ing doors and windows, are also recorded. This
data is aggregated to create meaningful informa-
tion for analyzing and assessing the home and res-
ident state. For example, the readings of Sensor
#122-6 are converted into ‘Temperature X in Joe’s
room.’ This makes it easier to explain the nature
of the anomaly and enables sending comprehen-
sible messages to interested parties when neces-
sary. This can subsequently be used to trigger the
appropriate actions where necessary. In addition,
this makes the anomaly detection process portable
to other systems as it does not rely on the specific
The Integration of Time Series Anomaly Detection into a Smart Home Environment
157
readings of a sensor but uses the sensor data con-
verted into a standard form such as temperature
expressed as Celsius or Fahrenheit degrees.
2. Anomaly Detection: Using data sent from the
repository, the basic process of this stage is car-
ried out by the detector, described in section 2,
which uses the data collected and aggregated by
the previous stage and identifies and categorizes
anomalies (e.g., pointwise, contextual and sea-
sonal). The anomaly-related data is sent to be pro-
cessed and assessed.
3. Anomaly Processing and Assessment Process:
This process tries to recognize the type of
anomaly and its characteristics to determine
whether related anomaly rules are in place for
dealing with it. If the anomaly is not recognized,
the management of the process should be notified,
as explained in item (4).
If the anomaly is recognized, the process assesses
the severity of the anomaly and collects further
contextual information that could help with de-
ciding what action should be taken. For example,
the state of affairs in the house, who is present,
and whether the anomaly affects everyone in the
home. From a practical point of view, this pro-
cess creates an event with various parameters that
describe the anomaly and its context. For exam-
ple, ”the refrigerator in the living room exhibits
a pointwise anomaly, probably because the door
was left open.” While spikes in a refrigerator’s
current consumption are expected each time the
door is opened, a significant change in the con-
sumption trend may indicate a motor malfunction.
Similarly, light usage exhibits periodic, seasonal
patterns, being on at night and off during the day.
A deviation from this pattern, such as lights be-
ing left on during the day, represents a contextual
anomaly rather than a pointwise one, as the iso-
lated state of being ”on” is not inherently anoma-
lous.
Once an anomaly is detected, processed and as-
sessed, the anomaly-related information is for-
warded as an event to the Rule Interpreter in the
Generic Operation Process.
4. Anomaly Management Notification: If the
anomaly type is not recognized, the manager of
the anomaly management process is notified. This
enables adding the new anomaly into the assess-
ment process and creating the necessary anomaly
rules to deal with it.
5. Selecting and Activating an Anomaly Rule:
The Rules Interpreter of the Generic Operation
Process determines which anomaly-related rule
Figure 5: The stages of the anomaly management process.
A recognized anomaly is processed and forwarded to the
Generic Operation Process to select an appropriate rule and
act on it.
should be activated to create the necessary re-
sponse, as shown in Figure 5. The Interpreter
takes the parameters of the detected anomaly and
checks if a matching rule needs to be activated.
The rule may also require additional data from the
Generic Event Process to check the broader con-
text in which the anomaly occurred. For example,
check who is in the house that can act according
to the anomaly.
An example of a rule conflict concerns an
anomaly rule that detects lights ON during the
daytime. The rule may state that the lights should
be switched OFF. This can conflict with a rule that
states that if Joe is in RoomX, the lights should be
ON. This can be dealt with in two different ways.
The anomaly rule’s condition can be further qual-
ified by checking that the house is not empty or
that priority is given to Joe’s rule.
Selection of an appropriate anomaly rule: If the
event matches the condition of a rule, the rule will
be triggered. If the action does not conflict with
the current setting of the system, it will be acti-
vated immediately. The conflict resolution pro-
cess will be activated if there is a conflict with ac-
tivated routine rules. In most cases, anomaly rules
will likely have precedence over routine rules.
6. Possible Responses to a Detected Anomaly:
The response to an anomaly depends on its type,
severity, and contextual information. Security
threats require immediate action, such as locking
doors and windows, activating surveillance and
alarms, notifying residents and authorities, and
informing system administrators of cybersecurity
risks.
For energy and resource management, malfunc-
IoTBDS 2025 - 10th International Conference on Internet of Things, Big Data and Security
158
tioning appliances should be shut down to pre-
vent hazards, with residents, owners, and service
providers like technicians or electricians notified.
Residents should be informed of safety concerns,
and, if possible, additional data should be gath-
ered from those present.
Emergencies like fires require immediate fire de-
partment notification, while water leaks should
be addressed by shutting off the supply and con-
tacting a plumber. System functionality issues
must be reported to administrators and service
providers to prevent disruptions.
If anomalies involve unusual resident behavior,
residents should be contacted, with escalation to
health authorities in extreme cases. Minor issues,
such as an open refrigerator door or unnecessary
lights, may simply require user alerts.
In all cases, it is essential to log events to enable
post-processing and analysis of the happenings. This,
together with the data used to detect the anomaly, al-
lows for improving the detection and response pro-
cesses and can serve as evidence for resolving dis-
putes or supporting litigation processes.
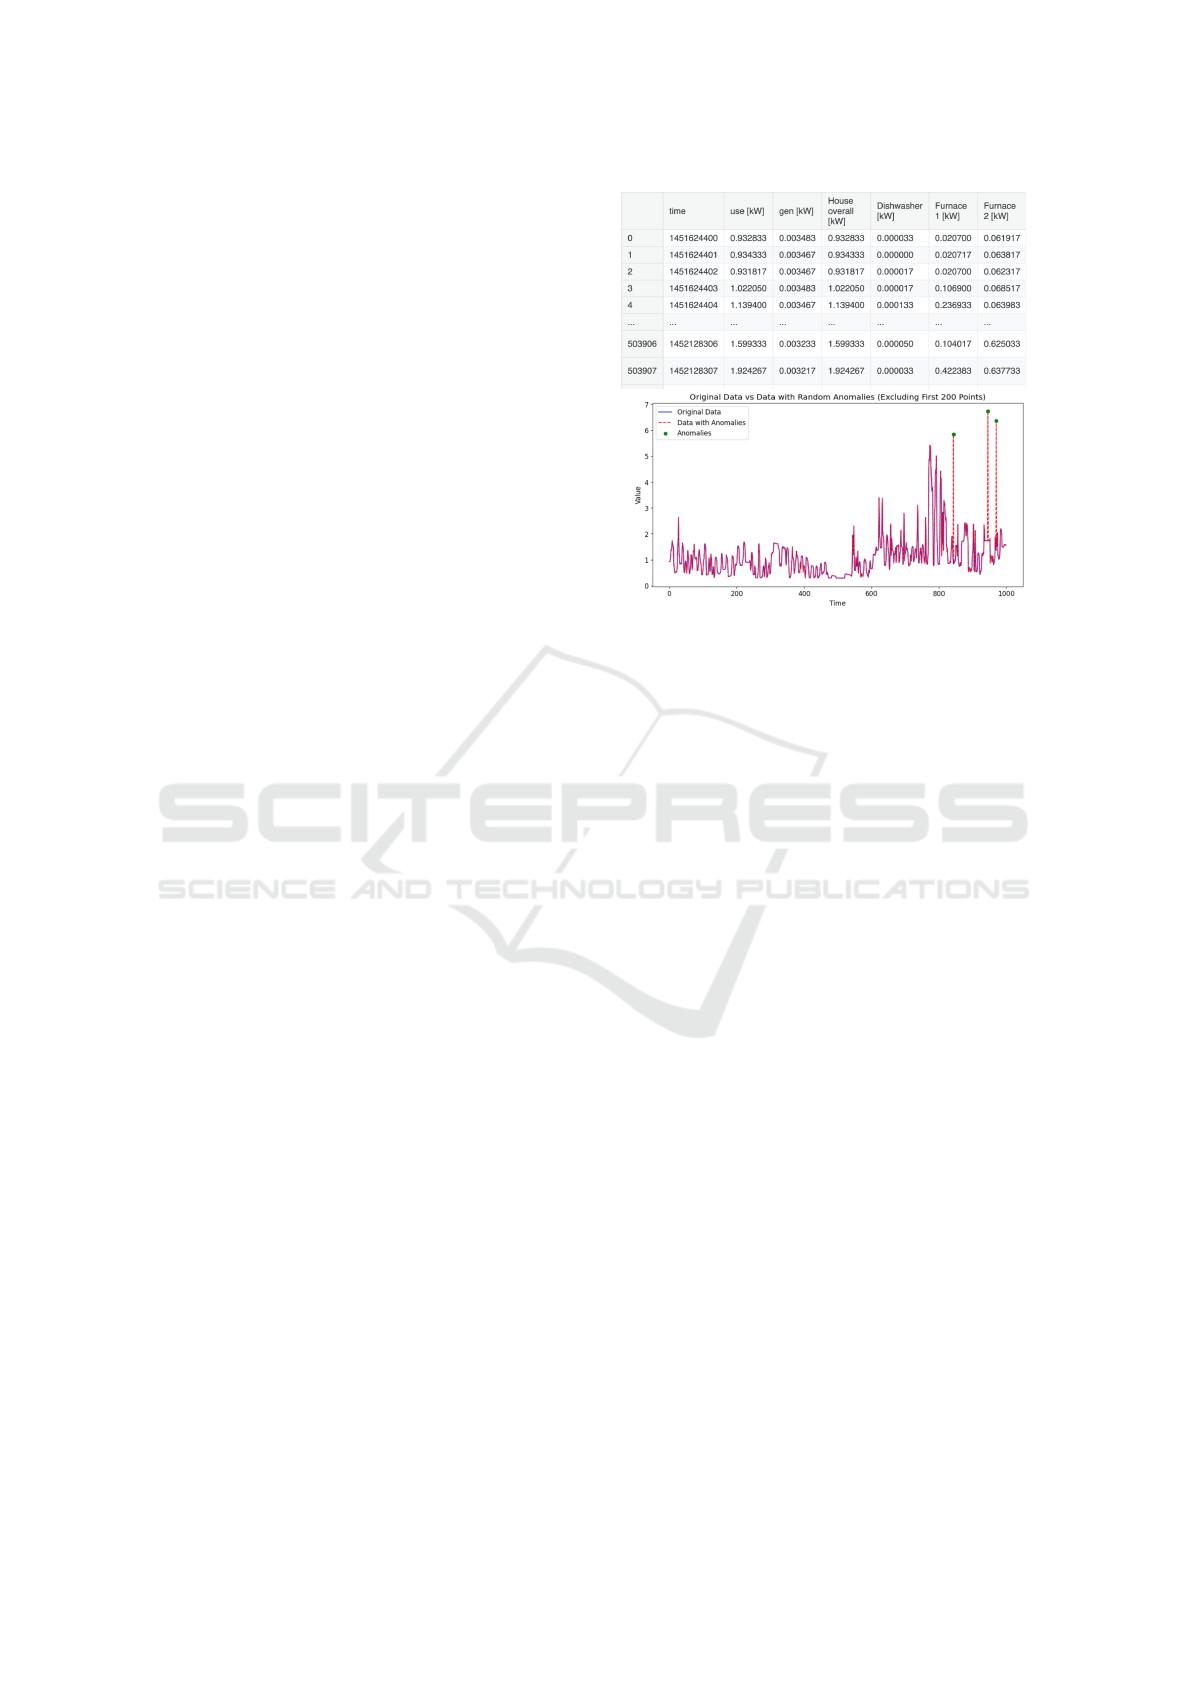
5 SYSTEM EXPERIMENTS
Our experiments were done on data collected from
our smart home model house by collecting real-time
data from its living residents. We injected into the
system’s log some random data point to see whether
the system will recognize them as anomalous and
added a rule to the rule database: ’IF EnergyCon-
sumption is Pointwise anomalous THEN SendAlert
to Joe’. The data consist of the electric consumption
of different appliances over time (Television, Dryer,
Oven, Refrigerator, Microwave) and the total con-
sumption. The top half of figure 6 shows a short ex-
ample of the raw data, while the bottom half shows
one time frame of the total consumption, which we
have added to some anomalous points in order to see
whether the algorithms can detect these points.
For our experiments we built a multi-anomaly de-
tector using the above algorithms and compared the
results for anomaly detection under the same cate-
gory using a majority vote. It is imperative for the
user to get detailed information regarding the type of
anomaly at hand since different anomalies require dif-
ferent course of action.The following are some illus-
trative examples.
Figure 6: Raw data of total house energy consumption.
5.1 Pointwise Anomalies
Reconstructive Models. In the category of point-
wise anomaly detection reconstructive models, we
used STL algorithm. Figure 7 shows an example
of the STL detection. The top part of the figure is
the STL decomposition to seasonal trend and residue.
The middle part shows the residue after applying a
sliding window to calculate the mean and standard
deviation, and the anomalous points detected are il-
lustrated at the bottom part of this figure. It is evident
that the added anomalous points were easily detected.
Predicative Models. In the category of pointwise
predicative models we illustrate here the use of
ARIMA. Figure 8 shows the predictive approach us-
ing ARIMA where points were reconstructed using
a sliding window of size 50 samples. Each window
was used to predict the following point hence result-
ing in the yellow curve. When points exceeded 3 stan-
dard deviations from the expected values they were
marked as anomalous. In order to estimate the pa-
rameters for S/ARIMA cross-validation was used, the
data was split into train and test 70% − 30% and val-
idated over all possible combinations of parameters
P,Q and I over the range of [1 − 3].
We conclude that pointwise anomaly detection
can be identified by our system by using a majority
vote of the detection algorithms and that the system
architecture worked correctly by taking the correct
course of action.
The Integration of Time Series Anomaly Detection into a Smart Home Environment
159
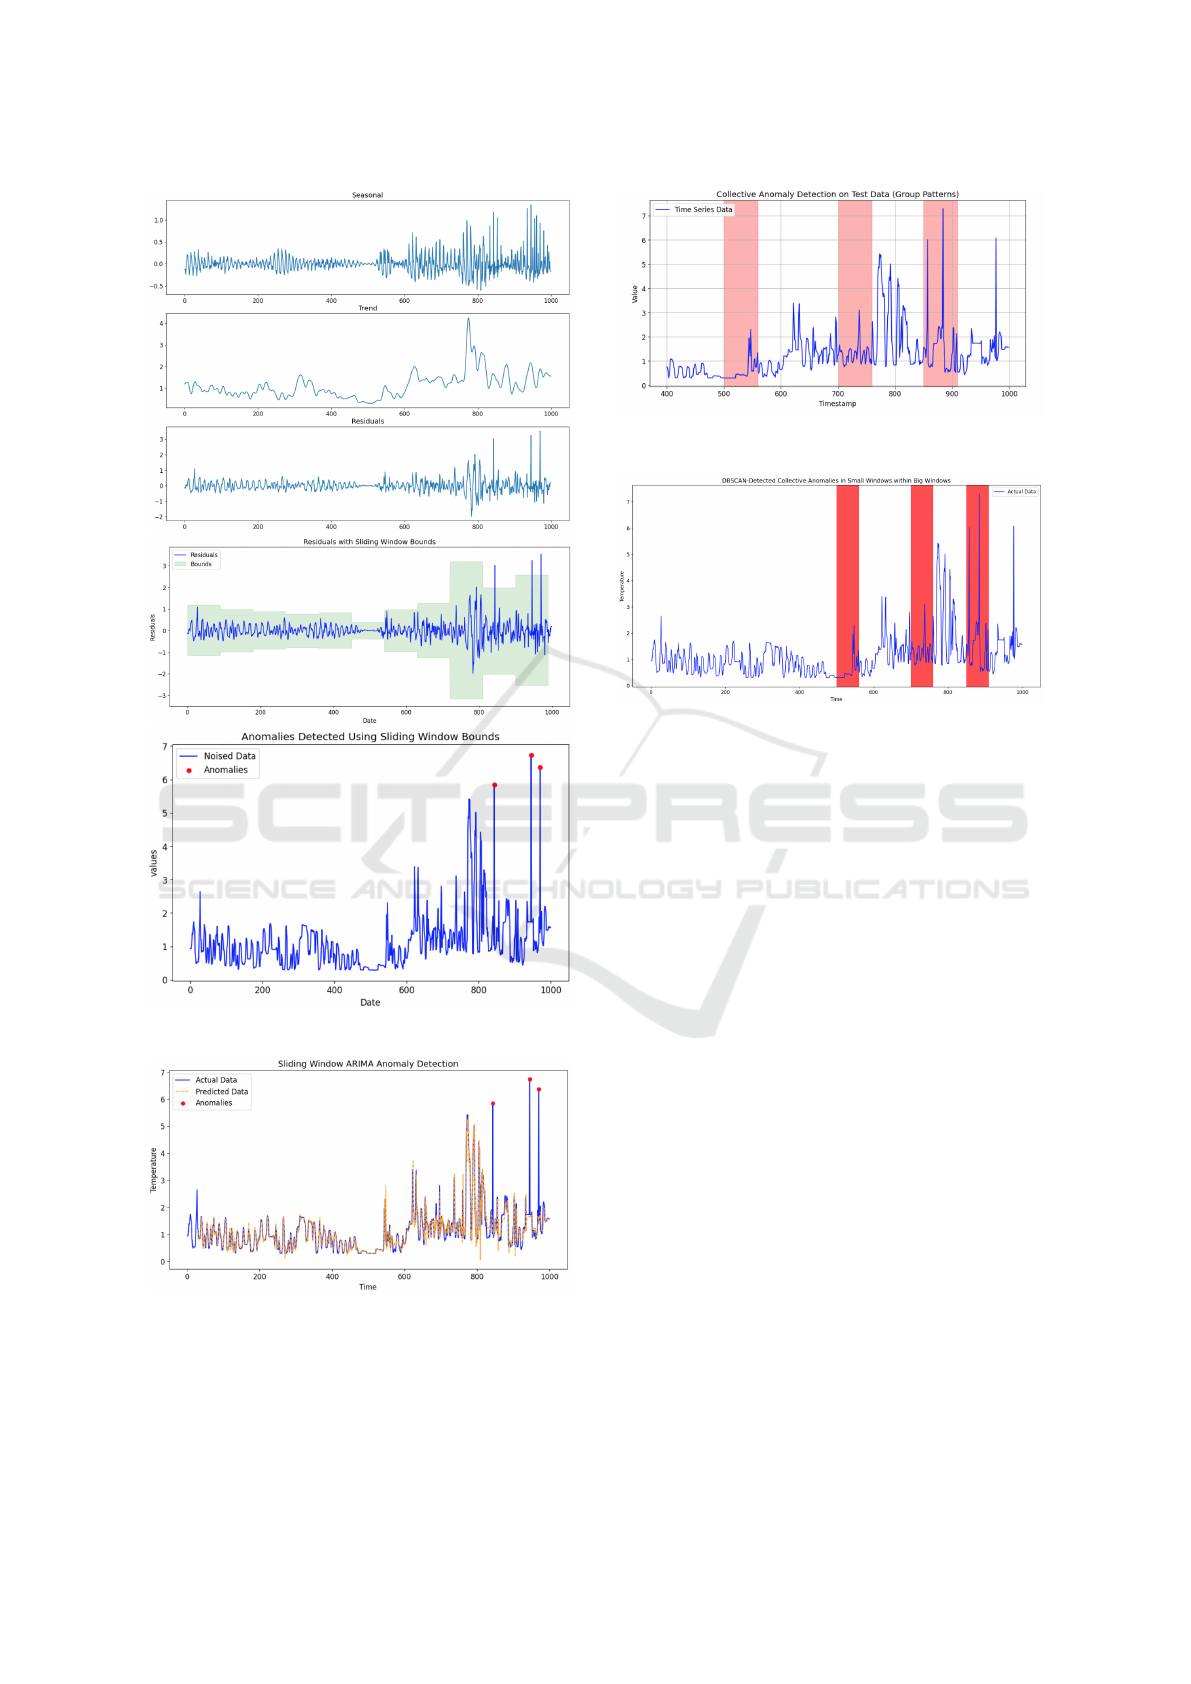
Figure 7: STL anomaly detection example.
Figure 8: ARIMA anomaly detection example.
5.2 Collective Anomalies
Distributional Learning Models. In the category
of collective anomaly detection we present the re-
Figure 9: OCSVM anomaly detection example.
Figure 10: DBSCAN anomaly detection example.
sults of DBSCAN and OCSVM. We used OCSVM
with RBF kernel. The regularization parameter C was
5-fold cross-validated over the set {2
3
, 2
5
, . . . , 2
15
},
and for the RBF kernel, the γ parameter was five-fold
cross-validated over the set {2
5
, 2
3
, . . . , 2
3
}. Figure 9
shows the collective anomalies found by OCSVM al-
gorithm. The time frames which were detected seem
to be either time frames with a change in the trend,
i.e. long periods of silence or a spike.
Clustering Models. DBSCAN belongs to the cate-
gory of clustering algorithms. A sliding window of
50 samples was taken with an overlap of 10 samples.
In the vector space of this feature space, DBSCAN
was evaluated. Figure 10 shows anomalies detected;
it can be seen that the time frames detected are similar
to those detected by OCSVM.
Neuralnet Models. For neuralnet-based models,
we used LSTM. Neuralnet based models are divided
into predictive or reconstructive models. LSTM is
a predictive model with a window size of 50. The
activation function of the units was tanh, and the re-
current activation function was sigmoid, with globe-
trot uniform distribution as the kernel initializer. The
network architecture was constructed by 32 units of
LSTM followed by a dropout layer with probability
0.2, followed by a shorter LSTM of 16 units and an-
other dropout layer and a fully connected layer with
IoTBDS 2025 - 10th International Conference on Internet of Things, Big Data and Security
160

Figure 11: LSTM anomaly detection example.
MSE as the loss function. Figure 11 shows the re-
sults, and as can be seen, LSTM disagrees with the
other two models on 2 sequences of relative silence
and agrees with the one containing spikes.
Finally, the anomaly detector was activated by a
majority vote in three distinct sections characterized
by relative silence and sporadic spikes. In these in-
stances, an anomaly event was issued to the Generic
Action Manager. Subsequently, a rule was triggered
that instructed the system to alarm the resident due
to extended periods of silence or spikes, contingent
upon the application’s requirements. If the alarm was
proved to be false, the user could then inactivate the
rule thereby mitigating false alarms.
The code, data and results are available here https:
//www.kaggle.com/code/adanfadila/working.
6 SUMMARY AND
CONCLUSIONS
In this paper, we tackled the problem of han-
dling anomalies in the smart home environment and
demonstrated how anomaly detection integrates into
our smart home architecture as part of a broader
anomaly-handling process.
The existing monitoring and control infrastruc-
ture, which is based on data-flow and control-flow
channels and the rule-based decision-making pro-
cess, provides an excellent platform for integrating
the anomaly management process. Data collected
through the data-flow channel informs routine house-
hold decisions while feeding the anomaly detection
processes. When an anomaly is identified, it is an-
alyzed alongside contextual data, triggering relevant
rules in the rule interpreter. Conflicts between acti-
vated rules are resolved based on predefined priori-
ties.
Anomaly management has profound implications
when creating a safe environment that covers cyber-
security, health, predictive maintenance and malfunc-
tion problems. The intricate environment of the smart
home forced us to address not only the anomaly al-
gorithms themselves but also a comprehensive under-
standing of the home environment and the nature of
the anomaly at hand. We have enhanced the deal-
ing with anomalies on several accounts: the detection
process, the understanding and explanation process
and the anomaly management process. We imple-
mented and tested this architecture on a model house
with very satisfactory results.
Dividing the anomaly-management process into
stages proved useful in making the integration easier
and simplifying the development and runtime epochs
significantly.
REFERENCES
Bao, Y., Tang, Z., Li, H., and Zhang, Y. (2018). Computer
vision and deep learning based data anomaly detec-
tion method for structural health monitoring. Struc-
tural Health Monitoring: An International Journal,
18:147592171875740.
Box, G. E. P. and Pierce, D. A. (1970). Distribution of resid-
ual autocorrelations in autoregressive-integrated mov-
ing average time series models. Journal of the Ameri-
can Statistical Association, 65(332):1509–1526.
Chi, H., Fu, C., Zeng, Q., and Du, X. (2022). Delay wreaks
havoc on your smart home: Delay-based automation
interference attacks. In 43rd IEEE Symposium on Se-
curity and Privacy, SP 2022, San Francisco, CA, USA,
May 22-26, 2022, pages 285–302. IEEE.
Chi, H., Zeng, Q., Du, X., and Luo, L. (2021). Pfire-
wall: Semantics-aware customizable data flow control
for smart home privacy protection. In 28th Annual
Network and Distributed System Security Symposium,
NDSS 2021, virtually, February 21-25, 2021. The In-
ternet Society.
Cho, K., van Merrienboer, B., G
¨
ulc¸ehre, C¸ ., Bahdanau, D.,
Bougares, F., Schwenk, H., and Bengio, Y. (2014).
Learning phrase representations using RNN encoder-
decoder for statistical machine translation. In Mos-
chitti, A., Pang, B., and Daelemans, W., editors, Pro-
ceedings of the 2014 Conference on Empirical Meth-
ods in Natural Language Processing, EMNLP 2014,
October 25-29, 2014, Doha, Qatar, A meeting of
SIGDAT, a Special Interest Group of the ACL, pages
1724–1734. ACL.
Choi, J., Jeoung, H., Kim, J., Ko, Y., Jung, W., Kim, H.,
and Kim, J. (2018). Detecting and identifying faulty
iot devices in smart home with context extraction. In
48th Annual IEEE/IFIP International Conference on
Dependable Systems and Networks, DSN 2018, Lux-
embourg City, Luxembourg, June 25-28, 2018, pages
610–621. IEEE Computer Society.
Choi, Y., Lim, H., Choi, H., and Kim, I. (2020). Gan-
based anomaly detection and localization of multivari-
ate time series data for power plant. In Lee, W., Chen,
L., Moon, Y., Bourgeois, J., Bennis, M., Li, Y., Ha, Y.,
The Integration of Time Series Anomaly Detection into a Smart Home Environment
161

Kwon, H., and Cuzzocrea, A., editors, 2020 IEEE In-
ternational Conference on Big Data and Smart Com-
puting, BigComp 2020, Busan, Korea (South), Febru-
ary 19-22, 2020, pages 71–74. IEEE.
Fahad, L. G. and Rajarajan, M. (2015). Anomalies detection
in smart-home activities. In 2015 IEEE 14th interna-
tional conference on machine learning and applica-
tions (ICMLA), pages 419–422. IEEE.
Fernandes, E., Jung, J., and Prakash, A. (2016). Secu-
rity analysis of emerging smart home applications. In
IEEE Symposium on Security and Privacy, SP 2016,
San Jose, CA, USA, May 22-26, 2016, pages 636–654.
IEEE Computer Society.
Fu, C., Zeng, Q., Chi, H., Du, X., and Valluru, S. L. (2022).
Iot phantom-delay attacks: Demystifying and exploit-
ing iot timeout behaviors. In 52nd Annual IEEE/IFIP
International Conference on Dependable Systems and
Networks, DSN 2022, Baltimore, MD, USA, June 27-
30, 2022, pages 428–440. IEEE.
Fu, C., Zeng, Q., and Du, X. (2021). Hawatcher:
Semantics-aware anomaly detection for appified smart
homes. In Bailey, M. D. and Greenstadt, R., edi-
tors, 30th USENIX Security Symposium, USENIX Se-
curity 2021, August 11-13, 2021, pages 4223–4240.
USENIX Association.
Guan, Z., Lu, X., Wang, N., Wu, J., Du, X., and Guizani, M.
(2020). Towards secure and efficient energy trading in
iiot-enabled energy internet: A blockchain approach.
Future Gener. Comput. Syst., 110:686–695.
Guo, Y., Liao, W., Wang, Q., Yu, L., Ji, T., and Li, P.
(2018). Multidimensional time series anomaly de-
tection: A gru-based gaussian mixture variational au-
toencoder approach. In Zhu, J. and Takeuchi, I.,
editors, Proceedings of The 10th Asian Conference
on Machine Learning, ACML 2018, Beijing, China,
November 14-16, 2018, volume 95 of Proceedings of
Machine Learning Research, pages 97–112. PMLR.
Hnat, T. W., Srinivasan, V., Lu, J., Sookoor, T. I., Dawson,
R., Stankovic, J. A., and Whitehouse, K. (2011). The
hitchhiker’s guide to successful residential sensing de-
ployments. In Liu, J., Levis, P. A., and R
¨
omer, K.,
editors, Proceedings of the 9th International Confer-
ence on Embedded Networked Sensor Systems, SenSys
2011, Seattle, WA, USA, November 1-4, 2011, pages
232–245. ACM.
Hochreiter, S. and Schmidhuber, J. (1997). Long short-term
memory. Neural Comput., 9(8):1735–1780.
Hoffner, Y., Kaufman, E., Amir, A., Yovel, E., and Harel,
F. (2024). Automation of smart homes with multi-
ple rule sources. In Kobusinska, A., Jacobsson, A.,
and Chang, V., editors, Proceedings of the 9th Inter-
national Conference on Internet of Things, Big Data
and Security, IoTBDS 2024, Angers, France, April 28-
30, 2024, pages 40–52. SCITEPRESS.
Hsieh, R., Chou, J., and Ho, C. (2019). Unsupervised on-
line anomaly detection on multivariate sensing time
series data for smart manufacturing. In 12th IEEE
Conference on Service-Oriented Computing and Ap-
plications, SOCA 2019, Kaohsiung, Taiwan, Novem-
ber 18-21, 2019, pages 90–97. IEEE.
Hundman, K., Constantinou, V., Laporte, C., Colwell,
I., and S
¨
oderstr
¨
om, T. (2018). Detecting spacecraft
anomalies using lstms and nonparametric dynamic
thresholding. In Guo, Y. and Farooq, F., editors,
Proceedings of the 24th ACM SIGKDD International
Conference on Knowledge Discovery & Data Mining,
KDD 2018, London, UK, August 19-23, 2018, pages
387–395. ACM.
Jiang, C., Fu, C., Zhao, Z., and Du, X. (2022). Effective
anomaly detection in smart home by integrating event
time intervals. Procedia Computer Science, 210:53–
60. The 13th International Conference on Emerg-
ing Ubiquitous Systems and Pervasive Networks (EU-
SPN) / The 12th International Conference on Current
and Future Trends of Information and Communication
Technologies in Healthcare (ICTH-2022) / Affiliated
Workshops.
Kieu, T., Yang, B., Guo, C., and Jensen, C. S. (2019). Out-
lier detection for time series with recurrent autoen-
coder ensembles. In Kraus, S., editor, Proceedings
of the Twenty-Eighth International Joint Conference
on Artificial Intelligence, IJCAI 2019, Macao, China,
August 10-16, 2019, pages 2725–2732. ijcai.org.
Li, D., Chen, D., Jin, B., Shi, L., Goh, J., and Ng, S.
(2019). MAD-GAN: multivariate anomaly detection
for time series data with generative adversarial net-
works. In Tetko, I. V., Kurkov
´
a, V., Karpov, P., and
Theis, F. J., editors, Artificial Neural Networks and
Machine Learning - ICANN 2019: Text and Time Se-
ries - 28th International Conference on Artificial Neu-
ral Networks, Munich, Germany, September 17-19,
2019, Proceedings, Part IV, volume 11730 of Lecture
Notes in Computer Science, pages 703–716. Springer.
MacQueen, J. B. (1967). Some methods for classification
and analysis of multivariate observations. In Cam, L.
M. L. and Neyman, J., editors, Proc. of the fifth Berke-
ley Symposium on Mathematical Statistics and Prob-
ability, volume 1, pages 281–297. University of Cali-
fornia Press.
Manevitz, L. M. and Yousef, M. (2001). One-class svms for
document classification. J. Mach. Learn. Res., 2:139–
154.
Markou, M. and Singh, S. (2003). Novelty detection: a re-
view—part 1: statistical approaches. Signal Process-
ing, 83(12):2481–2497.
McLachlan, G. J. and Basford, K. E. (1988). Mixture mod-
els: Inference and applications to clustering. Marcel
Dekker, New York.
Park, D., Hoshi, Y., and Kemp, C. C. (2017). A mul-
timodal anomaly detector for robot-assisted feeding
using an lstm-based variational autoencoder. CoRR,
abs/1711.00614.
Ramapatruni, S., Narayanan, S. N., Mittal, S., Joshi, A.,
and Joshi, K. (2019). Anomaly detection models for
smart home security. In 2019 IEEE 5th Intl Confer-
ence on Big Data Security on Cloud (BigDataSecu-
rity), IEEE Intl Conference on High Performance and
Smart Computing, (HPSC) and IEEE Intl Conference
on Intelligent Data and Security (IDS), pages 19–24.
Shen, L., Li, Z., and Kwok, J. (2020). Timeseries anomaly
detection using temporal hierarchical one-class net-
IoTBDS 2025 - 10th International Conference on Internet of Things, Big Data and Security
162

work. In Larochelle, H., Ranzato, M., Hadsell, R.,
Balcan, M. F., and Lin, H., editors, Advances in Neu-
ral Information Processing Systems, volume 33, pages
13016–13026. Curran Associates, Inc.
Shin, J. H., Lee, B., and Park, K. S. (2011). Detection of
abnormal living patterns for elderly living alone using
support vector data description. IEEE Transactions on
Information Technology in Biomedicine, 15(3):438–
448.
Sikder, A. K., Babun, L., and Uluagac, A. S. (2021).
Aegis+: A context-aware platform-independent se-
curity framework for smart home systems. DTRAP,
2(1):6:1–6:33.
Su, Y., Zhao, Y., Niu, C., Liu, R., Sun, W., and Pei, D.
(2019). Robust anomaly detection for multivariate
time series through stochastic recurrent neural net-
work. In Teredesai, A., Kumar, V., Li, Y., Rosales,
R., Terzi, E., and Karypis, G., editors, Proceedings
of the 25th ACM SIGKDD International Conference
on Knowledge Discovery & Data Mining, KDD 2019,
Anchorage, AK, USA, August 4-8, 2019, pages 2828–
2837. ACM.
Wang, X., Miranda-Moreno, L. F., and Sun, L. (2021).
Hankel-structured tensor robust PCA for multivari-
ate traffic time series anomaly detection. CoRR,
abs/2110.04352.
Wen, T. and Keyes, R. (2019). Time series anomaly detec-
tion using convolutional neural networks and transfer
learning. CoRR, abs/1905.13628.
Williams, B. M. and Hoel, L. A. (2003). Modeling and fore-
casting vehicular traffic flow as a seasonal arima pro-
cess: Theoretical basis and empirical results. Journal
of Transportation Engineering, 129(6):664–672.
Xiao, J., Xu, Z., Zou, Q., Li, Q., Zhao, D., Fang, D., Li,
R., Tang, W., Li, K., Zuo, X., Hu, P., Jiang, Y., Weng,
Z., and Lyu, M. R. (2024). Make your home safe:
Time-aware unsupervised user behavior anomaly de-
tection in smart homes via loss-guided mask. In Pro-
ceedings of the 30th ACM SIGKDD Conference on
Knowledge Discovery and Data Mining, KDD ’24,
page 3551–3562. ACM.
Zhou, B., Liu, S., Hooi, B., Cheng, X., and Ye, J. (2019).
Beatgan: Anomalous rhythm detection using adver-
sarially generated time series. In Kraus, S., editor,
Proceedings of the Twenty-Eighth International Joint
Conference on Artificial Intelligence, IJCAI 2019,
Macao, China, August 10-16, 2019, pages 4433–
4439. ijcai.org.
The Integration of Time Series Anomaly Detection into a Smart Home Environment
163
