
Developing a Geospatial Framework for Calculating a 15-Minute
City Index (FMCI): The Case of Quezon City
Carlo Angelo R. Mañago
a
, Marielle G. Nasalita
b
, Cesar V. Saveron
c
, Ynah Andrea D. Sunga
d
and Alexis Richard C. Claridades
e,*
Department of Geodetic Engineering, University of the Philippines Diliman, Quezon City, Philippines
Keywords: 15-Minute City, Urban Life Quality, 15-Minute City Index, Service Area, Network Analysis, Pedestrian
Network.
Abstract: The 15-minute city concept is a measure of the quality of urban life based on proximity, sustainability, and
sociality. This study proposes a geospatial framework for calculating the 15-minute city index (FMCI) aimed
to measure the accessibility of its residents to six social functions, which include living, working, supplying,
caring, learning, and enjoying. Quezon City, Philippines, was chosen for its urban characteristics that aligned
with this vision and served as the study area. To account for pedestrian needs, age-based weights were
assigned to the social functions, and service areas were mapped using a uniform walking speed. FMCI values
were calculated based on weighted social functions and barangay population distribution by age group.
Results revealed that 39% of Quezon City’s barangays achieved a perfect FMCI score of one, indicating
access to all six functions within a 15-minute walk. Positive spatial autocorrelation indicated the clustering of
barangays with similar FMCI values, with hot spots in the southern and cold spots in the northern parts of the
city. These findings offer insights for policymakers in improving urban life quality. The adaptable FMCI
framework can be applied to other urban areas to assess service accessibility, considering residents' needs.
1 INTRODUCTION
The 15-minute city is a population-oriented urban
development concept that has gained popularity in
recent years. Its primary idea is that the accessibility
to essential services of the residents should be within
a 15-minute radius of their homes, whether by
walking, biking, or utilizing public transportation
(Poorthuis & Zook, 2023). It is a multi-reformative
urban model that addresses the decentralization of a
city, reduction of carbon footprint, and social and
economic integration (ArchDaily, 2024). The
COVID-19 pandemic brought renewed focus to this
pedestrian-centered idea, as lockdowns underscored
the need for easily accessible amenities amid
limitations on mobility and public transportation
(Akrami et al., 2024).
a
https://orcid.org/ 0009-0001-7799-1645
b
https://orcid.org/0009-0001-1777-7161
c
https://orcid.org/0009-0006-0492-4608
d
https://orcid.org/0009-0008-5763-5070
e
https://orcid.org/0000-0001-9826-4271
*Corresponding author.
Moreno et al. (2021) claim that the ability of
residents to access six essential urban social functions
(SF), which include (a) living, (b) working, (c)
supplying, (d) caring, (e) learning, and (f) enjoying,
in a 15-minute space-time frame is linked to a higher
quality of life. This concept connects the proximity
and integration of the six essential functions to the
enhancement of well-being, sociality, and
sustainability, which emphasizes the purpose and
significance of the 15-minute city to offer a high-
quality urban life to the residents.
For the practical and effective implementation of
the 15-minute city, each societal function should be
broken down into subcategories and linked to
corresponding specific uses, activities, and facilities
(Moreno et al., 2023). Table 1 provides a summary of
the elements and facilities associated with six SFs.
Mañago, C. A. R., Nasalita, M. G., Saveron, C. V., Sunga, Y. A. D. and Claridades, A. R. C.
Developing a Geospatial Framework for Calculating a 15-Minute City Index (FMCI): The Case of Quezon City.
DOI: 10.5220/0013426100003935
Paper published under CC license (CC BY-NC-ND 4.0)
In Proceedings of the 11th International Conference on Geographical Information Systems Theory, Applications and Management (GISTAM 2025), pages 73-84
ISBN: 978-989-758-741-2; ISSN: 2184-500X
Proceedings Copyright © 2025 by SCITEPRESS – Science and Technology Publications, Lda.
73

Considerably, population distribution per age
distribution of a city is an important demographic
characteristic to be considered in assessing a 15-
minute city (Moreno et al., 2023). For instance, a
child must have access to learning or enjoying SFs,
while the elderly must have access to the caring SF.
Assessment of accessibility within the neighborhood
requires incorporation of the origins of mobility
needs, which the population distribution represents.
This ensures that services are located close to the
people who are the users of these services (Caselli,
2021). Thus, this research project will incorporate
population data to facilitate the assessment.
Table 1: Elements and facilities are integrated into the six
SFs.
Social Function Subcategories
Living
Housing
Energy
Waste Management
Transportation
Services
Infrastructure
Working
Environment
Access
Diversity
Services
Getting Supplies
Food
Non-food-related consumption
Public services
Enjoying
Holidays
Culture
Leisure
Association
Learning
Access
Availability
Performance
Guide
Caring/Being Healthy
Access to care
Prevention
Emergency
Living environment
Wellness
Sport
Pollution
Over the past few years, the 15-minute city
concept has gained significant support from various
countries due to its urban planning benefits. Cities
such as Barcelona, Oxford, and Paris have embraced
this model (Vaughn, 2023). In China, the government
has prioritized the development of walkable
neighborhoods, ensuring that essential public services
are accessible within a 15-minute walk. This initiative
not only promotes walking behaviors and enhances
overall health but also highlights the critical role of
such neighborhoods in reducing the risk of obesity
and non-communicable diseases (NCDs) among
residents (Weng et al., 2019).
Scholarly research demonstrates varying
approaches to measuring accessibility in urban
contexts, with some studies favoring network
distances (Birkenfeld et al., 2023; Fazio et al., 2023;
Gorrini et al., 2023; Knap et al., 2023) while others
employ Euclidean distances, largely due to the
computational challenges posed by road network data
(Gaglione, 2022; S. Zhang et al., 2022). Network
distances are generally preferred as they provide more
realistic and precise results by reflecting the actual
paths residents travel to access urban amenities
(Papadopoulos et al., 2023). In contrast, Euclidean
distances are deemed inadequate for spatial analyses
within road networks, as they fail to account for
critical factors such as road length and travel time,
leading to underestimation (Shahid et al., 2009).
A variety of indicators have been used to evaluate
the principles underlying the 15-minute city concept.
For example, Starrico (2022) assessed service
accessibility by calculating the percentage of the
population with access to at least one amenity of the
same type within a 15-minute walking radius,
highlighting the need to consider population
coverage. The selected metrics aid in optimizing the
balance between service count, spatial distribution,
and area coverage relative to user locations. Starrico’s
findings revealed significant disparities, with certain
areas over-supplied with amenities while others
lacked sufficient services despite being populated.
Similarly, Gaglione et al. (2022) examined
accessibility by analyzing population density in
conjunction with urban amenities. By overlaying
population density data onto service area polygons
generated through urban amenity analysis, they
identified the proportion of the population served or
underserved within a 15-minute walking distance.
These reinforce the utility of population distribution
as a key metric for evaluating the "density" dimension
of the 15-minute city, which is the number of
residents who can access available resources,
infrastructure, and spaces (Moreno et al., 2021).
In the Philippines, the Quezon City government is
actively considering the adoption of the "15-minute
city" concept as an important part of its efforts to
foster a livable, environmentally conscious, and
sustainable community for its residents. This
endeavor of the local government unit aims to
stimulate the economy locally through the
decentralization of conventional urban services and
their increased accessibility within local
neighborhoods (Mateo, 2023). This study aims to
develop a geospatial data-based method for
evaluating the "15-minute city" concept in the case of
Quezon City's urban setting.
GISTAM 2025 - 11th International Conference on Geographical Information Systems Theory, Applications and Management
74
This study aims to create a 15-Minute City Index
(FMCI) that quantifies how closely a region or area
approaches the ideal of 15-minute walking
accessibility to six key SFs: living, working, caring,
supplying, learning, and enjoying. The research
focuses specifically on walking as the mode of
transportation, using a walking speed tailored to
Metro Manila, Philippines, with a case study in
Quezon City. The index calculation, based on the
barangay, the smallest administrative unit in the
Philippines, incorporates barangay-level population
distribution data by age group and the weighted needs
specific to each group.
The FMCI is scored between 0 and 1, where a
score of 0 represents no accessibility to any of the six
SFs, and a score of 1 signifies full access to all six
functions within a 15-minute walking distance,
meeting the age-specific needs of the population.
With this, the paper aims to perform service area
network analysis or isochrone analysis for the six SFs,
to develop a geospatial framework for the 15-minute
city, define the FMCI and model its dependence on
age-group-specific population distribution, calculate
the FMCI for each barangay, the smallest
administrative unit in the Philippines, and to examine
spatial autocorrelation to identify clustering patterns
of FMCI values.
2 METHODOLOGY
2.1 Geospatial Framework
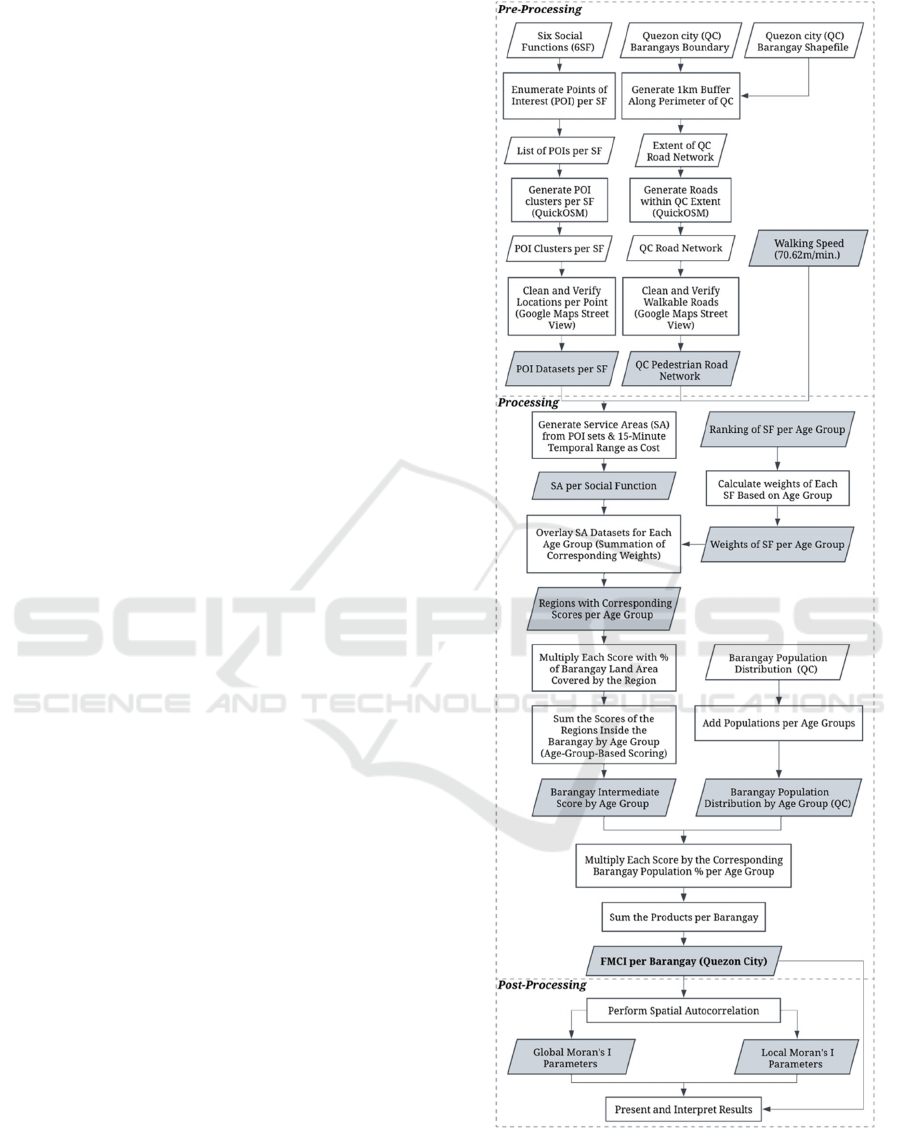
Figure 1 presents the geospatial framework for
developing the 15-minute city index in the selected
case study area of Quezon City. This displays the
interplay and relation of the five key components of
the FMCI, which include age group classification,
pedestrian network, population distribution, the six
SFs, and walking speed, based on literature. This
paper adopts the six SFs defined by Moreno et al.
(2021) to identify urban amenities offering various
services, which will be referred to as 'points of
interest' in this study.
Network analysis, in particular service area
analysis, is employed to assess the proximity of
services with time as the cost (ESRI, n.d.).
Consequently, this required the incorporation of road
network data. To emphasize the pedestrian-centric
principle of the 15-minute city, walking was chosen
as the transportation mode. The selected walking
speed was utilized to generate service areas around
the points of interest.
Figure 1: Geospatial framework for calculating FMCI.
Moreover, while many existing studies utilized
population household locations as starting points, this
research took on a different approach inspired by
Developing a Geospatial Framework for Calculating a 15-Minute City Index (FMCI): The Case of Quezon City
75
Gaglione et al. (2022), wherein the origins of
proximity analysis were points of interest. As such,
the regions reached within 15 minutes from the points
of interest delineate the population household
locations within the service area. The calculation of
the 15-minute city index depended on the age-based
weight of SFs and population distribution of the age
classification with respect to the six SFs, while the
analysis of results involved spatial statistics. These
will be discussed further in the subsequent sections.
It is important to note that this framework was applied
in the case of Quezon City, Philippines.
2.2 Data Gathering
2.2.1 Age Group Classification
The age group classification in this study is based on
the common age structure used for population
distribution in the Philippines (Philippines Age
Structure - Demographics, 2020), which is 0 - 14
years, 15 - 34 years, 35 - 54 years, 55 - 64 years and
65 - years and above. Given the focus on walking as
the mode of transport for assessing the 15-Minute
City Index (FMCI) in Quezon City, the first age group
has been adjusted to 7–14 years. This modification
aligns with the onset of independent mobility among
children, which typically begins around age seven
(Schoeppe et al., 2015). This adjustment is crucial for
the assessment, as it ensures the evaluation considers
the accessibility of services for children capable of
independent walking. By doing so, the study ensures
that points of interest (POIs) are realistically
reachable within a 15-minute walk for this
demographic.
Moreover, considering the median marrying age
in Quezon City, which is around 29 to 30 years (PSA,
2023), the classification has been further adjusted to
better categorize and address the specific needs of
those below and above these ages. Below is the
revised and final age group classification which will
be used in this study:
• 7- 14 years
• 15 - 29 years
• 30 - 54 years
• 55 - 64 years
• 65 years and above
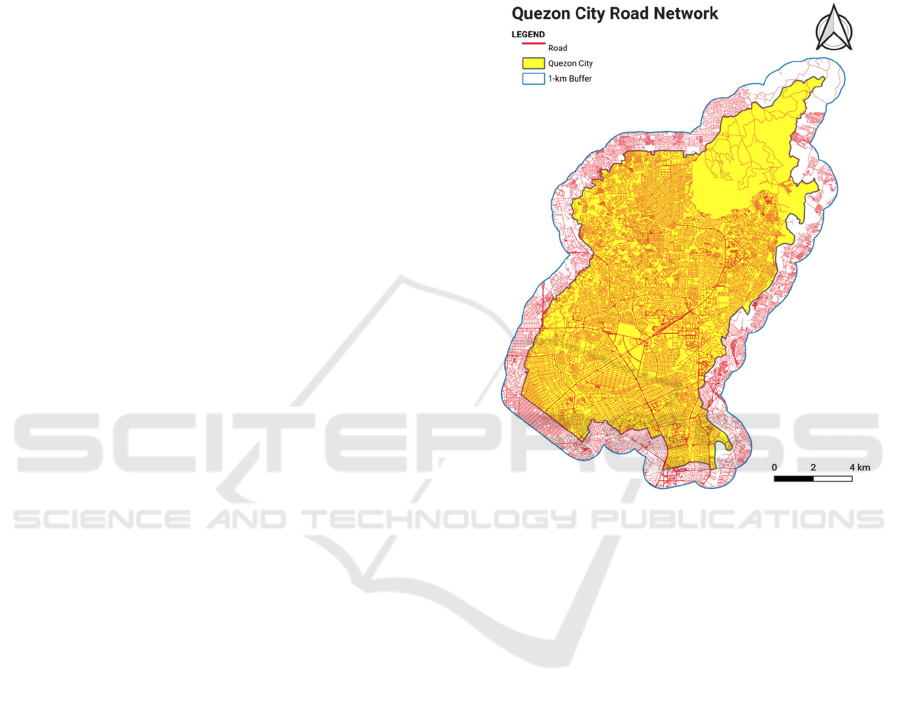
2.2.2 Road Data and Land Use
Road data for Quezon City was acquired using the
QuickOSM plugin in QGIS, which enables the
retrieval of freely available OpenStreetMap (OSM)
data (QGIS Documentation v: 3.34, n.d.), which is
completely available for the area. To properly
account for facilities outside the study area that may
be within the proximity of areas that are near said
boundaries, a one-kilometer buffer was applied,
allowing the inclusion of routes extending beyond
Quezon City's immediate boundaries. Figure 2
illustrates the raw road data prior to data cleaning and
network establishment.
Figure 2: Quezon City’s Road network is extended by a
one-kilometer buffer.
2.2.3 Population Distribution
The population data utilized in this study originates
from the 2020 Barangay Census of Quezon City,
sourced from the Humanitarian Data Exchange
platform and managed by the Office for the
Coordination of Humanitarian Affairs (OCHA)
Philippines. It includes information on the total
population as well as population breakdowns by age
and sex for each barangay in Quezon City.
2.2.4 Points of Interest
In this paper, POIs from the open dataset are
classified into the six SFs defined by Moreno et al.
(2023). These functions represent key aspects of daily
life and urban needs, with each category
encompassing specific amenities that serve these
roles. This paper adopts this methodology by
focusing on the available facilities related to the set of
terms and concepts specifying each SF, based on
GISTAM 2025 - 11th International Conference on Geographical Information Systems Theory, Applications and Management
76
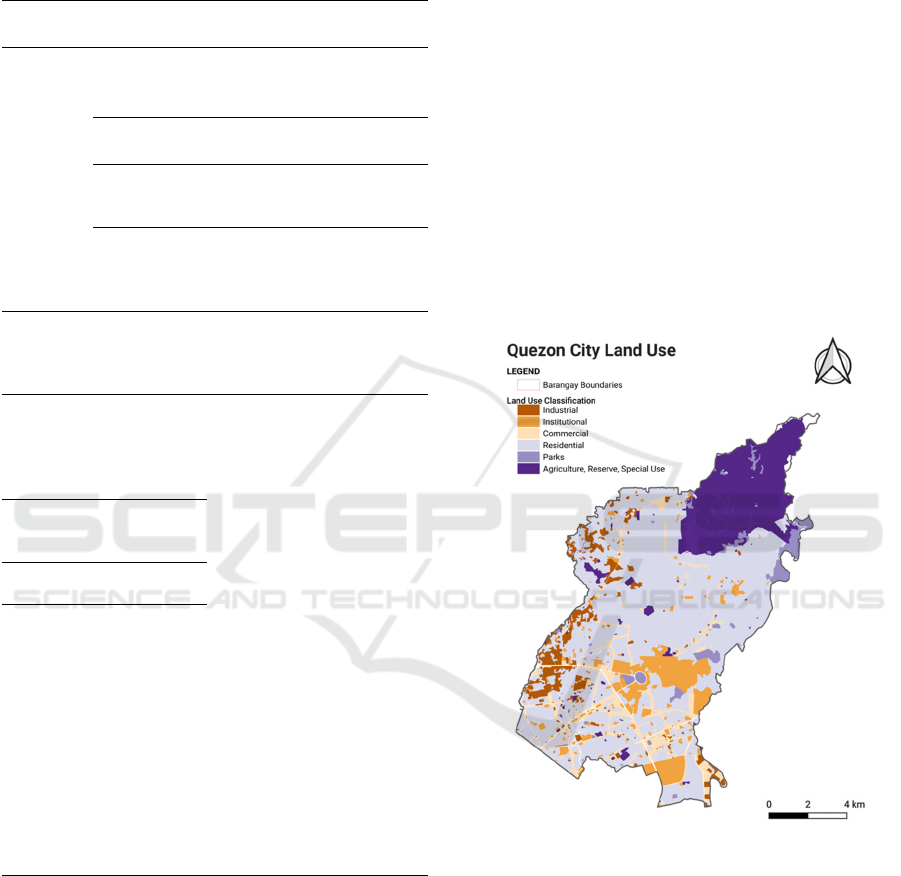
Table 1. Table 2 presents the POIs categorized under
each SF and their respective formats and sources.
Table 2: Information on the POIs.
Social
Function
Points of
Interest
Data
Format
Data Source
Living
LRT1 & 2,
MRT3 Train
Stations
Point
Land
Transportation
Office
QC Bus
Stations
Point
Quezon City
Governmen
t
EDSA
Carousel Bus
Stations
Point Edsa Busway
Barangay Halls
&
Quezon City
Hall
Point OpenStreetMap
Working
Commercial,
Industrial, &
Institutional
areas
Polygon
Quezon City
Government
Supplying
General shops
Supermarket
Convenience
Stores
Public Market
Point OpenStreetMap
Caring
Hospitals
Pharmacies
Health Centers
Learning
K-12 Public
Schools
Enjoying
Museum
Picnic sites/
Park
Theme park,
Water park
Zoo
Amusement
Arcade
Garden
Playground
Swimming
Areas
Malls
2.2.5 Walking Speed
In a walkability study by Gerilla (1995), a mean
walking speed of 70.62 meters per minute, or
approximately 4.23 kph, was determined for Metro
Manila. This speed was established by estimating
walking distance in the region and has since been
used in other walkability studies in the Philippines
and Asia to reflect the walking speed in Metro Manila
(Mateo-Babiano & Ieda, 2007; Tolentino & Sigua,
2022). This speed was uniformly used to create
service areas from sets of POIs.
2.3 Data Preparation
2.3.1 Getting Points for the Working Social
Function
Figure 3 shows the land use (LU) classification of
Quezon City obtained from the city government.
Based on local regulations, one location can only be
classified into one LU. Based on this, commercial,
industrial, and institutional areas within Quezon City
are designated as the working areas within the city to
simplify the identification of the places of work. This
assumes that people working from home or those with
no fixed places of work (delivery workers, etc.) are
not considered.
Figure 3: Land use classification of Quezon City.
These areas are converted into points of interest
for the working SF by generating points along the
boundary of the polygon features. Apart from the
boundary points serving as entry points to these areas,
centroids were not used to avoid over-generalization
of the POI. The interval of the generated points is
based on the maximum distance reached in 15
minutes using our assumed walking speed based on
Equation 1.
𝑀𝑎𝑥.𝐷𝑖𝑠𝑡𝑎𝑛𝑐𝑒 = 𝑤𝑎𝑙𝑘𝑖𝑛𝑔 𝑠𝑝𝑒𝑒𝑑 × 𝑡𝑖𝑚𝑒 𝑐𝑜𝑠𝑡
(1)
Developing a Geospatial Framework for Calculating a 15-Minute City Index (FMCI): The Case of Quezon City
77

where:
walking speed = 70.62
m/min
time cost =15
min
As a result, points along the working area
boundary were generated at 1059.3-meter intervals to
reflect the 15-minute temporal distance between each
adjacent point.
2.3.2 Calculating the Age Group-Based
Population per Barangay
The population for ages 0-6 was subtracted from the
total population, consistent with the adopted age
ranges. Given that the raw population data is
aggregated at ranges finer than what is adapted in this
study, the population for each age group was obtained
by summing the population data within the specified
range. The ratio of each age group relative to the new
total population per barangay was also calculated.
2.3.3 Weighting of Social Functions
Pedestrian characteristics are important in studies
involving walkability (Gorrini et al., 2023).
Therefore, in this study, a set of weights for each SF
was established for each group. To accomplish this,
seven experts in various fields relevant to the study,
including sociology, geography, geomatics, and
urban planning, are consulted to characterize the
population for each age group. The experts were
requested to rank each SF based on its importance for
each age group. Table 3 shows the resulting average
rank for the SFs per age group.
Table 3: Average rank of SFs per age group.
Social
Function
Ranking for each age group
7-14 15-29 30-54 55-64 ≥ 65
Livin
g
3 2 1 1 2
Working 6 5 2 2 6
Su
pp
l
y
in
g
5 6 3 5 4
Caring 4 4 3 3 1
Learnin
g
1 1 6 6 5
Enjoying 2 3 3 4 3
Then, the weight of each rank was calculated through
Equation 2. Table 4 shows the computation of the
weights for each rank based on using values from
Table 3 in this equation.
𝑊
=
1
𝑚
1
𝑘
(2)
where:
𝑊
= weight of SF 𝑖
𝑚=total number of SFs
𝑛=rank of SF 𝑖
Table 4: Calculation of weight per rank.
Rank Calculation Weight
1
1
6
×
1+
1
2
+
1
3
+
1
4
+
1
5
+
1
6
0.4083
2
1
6
×
1
2
+
1
3
+
1
4
+
1
5
+
1
6
0.2417
3
1
6
×
1
3
+
1
4
+
1
5
+
1
6
0.1583
4
1
6
×
1
4
+
1
5
+
1
6
0.1028
5
1
6
×
1
5
+
1
6
0.0611
6
1
6
×
1
6
0.0278
Based on these results, the final weights of each
SF for each age group are established. It is important
to note that from Table 3, experts ranked supplying,
caring, and enjoying SFs equally for the age group
30-54 years old, thus having the same weight. Since
the 3 SFs are tied in ranking, the weights for ranks 3-
5 were added and divided by 3 and assigned to the
three SFs to make sure the sum of weights is still 1.
The results are presented in Table 5.
Table 5: Weights of SFs per age group.
Social
Function
Weights for age group
7-14 15-29 30-54 55-64 ≥ 65
Livin
g
0.1583 0.2417 0.4083 0.4083 0.2417
Workin
g
0.0278 0.0611 0.2417 0.2417 0.0278
Suppl
y
in
g
0.0611 0.0278 0.1074 0.0611 0.1028
Carin
g
0.1028 0.1028 0.1074 0.1583 0.4083
Learnin
g
0.4083 0.4083 0.0278 0.0278 0.0611
En
j
o
y
in
g
0.2417 0.1583 0.1074 0.1028 0.1583
Sum 1.00 1.00 1.00 1.00 1.00
2.3.4 Preparation of Network Dataset
To generate the pedestrian road data from the raw
road dataset from OSM, features that are accessible to
pedestrians are retained. Hence, the network data
included pedestrian lanes, footbridges, and paths.
Primary and trunk roads were also still utilized, but
only in the areas where there were walkable paths,
such as exterior lanes. Google Maps and Google
Streetview were used to verify walkable paths across
the road network. Roads accessible to vehicles only
are removed, with motorways like expressways,
skyways, and U-turn slots removed from the network.
Road features that were not in the raw OSM network
were added and properly referenced. Extensive
intersections were checked for proper pedestrian
routes. Residential roads were included in the road
network, along with some service roads that access
GISTAM 2025 - 11th International Conference on Geographical Information Systems Theory, Applications and Management
78
residential areas. Service roads that go into
institutional areas like schools and hospitals were
removed from the network.
2.4 Network Analysis
Service areas (SA) from each of the six sets of POIs
were generated via the Network Analyst tool of
ArcGIS using the 15-minute walking time cost as the
impedance on the finalized pedestrian network
dataset. The direction was set away from the
facilities, which were set to be the POIs.
2.5 Calculating the 15-Minute City
Index
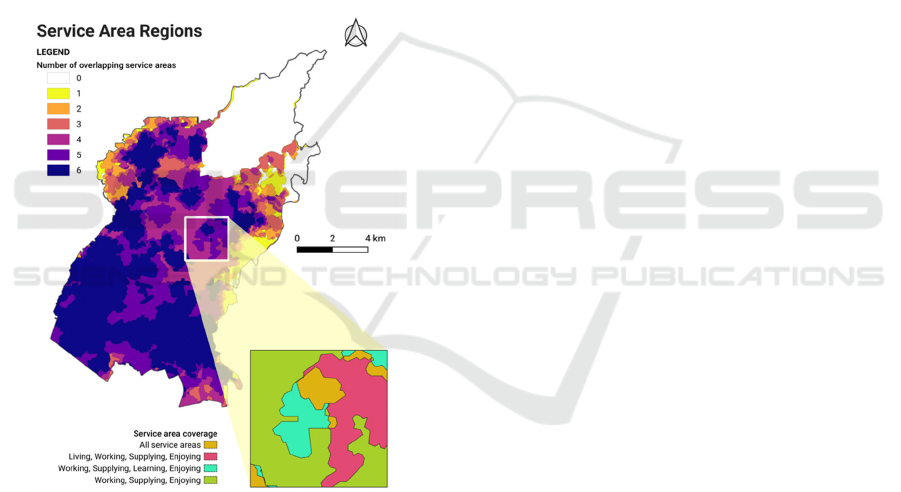
2.5.1 Generation of Regions and Age Group-
Based Scoring
Figure 4: Resulting regions from combining service areas.
Each service area generated from 2.4 is assigned a
score of 1 for the SF it represents and a score of 0 for
the other SFs. In the context of this study, we define
a region as an area covered by a unique set of service
areas. To generate the overlapping regions of the
service area polygons, the six service areas are
combined. Figure 4 visualizes the combination of the
service areas, where the colors of the features in the
larger map show the number of service areas that
cover said location.
This map, however, does not illustrate the regions
themselves. For example, two areas valued “3” on the
map may not be the same region since each may
include different sets of 3 service areas. In contrast,
the colors in the inset map visualize the unique set of
service areas that cover the location. Since each
region combines a set of service areas, it has five
binary scores, each containing 1 (for an SA present in
the region) or 0 (for an SA not in the region). These
binary scores can be transformed into age-based
scores by multiplying them by the scores in Table 5
to obtain age group-based (AGB) scores per region.
2.5.2 Transforming Region Scores to Scores
per Barangay
An area-based overlay operation is used to re-
organize the AGB scores per region into the
barangays. We can compute the percentage of
barangay areas that each region covers by dividing
the region within the barangay's area by the
barangay’s area. The region’s five AGB scores are
multiplied by the percentage of barangay area that the
region covers. Then, the intermediate scores of each
barangay are derived by summing all the
corresponding AGB of the regions belonging to that
barangay. At the end of this step, the barangay has a
set of five intermediate scores corresponding to the
five age groups.
According to Section 2.3.2, each barangay has an
attribute for the population per age group. The
intermediate scores were multiplied by the
corresponding age group percentages. Finally, the 15-
minute city index is obtained from the sum of these
weighted scores.
2.5.3 Clustering Analysis
To further support the FMCI generated per barangay,
its global and local spatial autocorrelation was
assessed through Moran’s I statistics. Similar
parameters were applied for both global and local
spatial autocorrelation. In the analysis, the
Conceptualization of Spatial Relationships was set to
be inverse distance, which imposes a larger influence
on closer features compared to farther features.
Concerning the distance method, Euclidean distance
was applied since, at this point, solely the FMCI are
considered among barangays without regard to roads
and borders, thus only requiring a simple distance
between barangays. Moreover, the standardization
parameter was set as ‘row,’ which is appropriate for
polygon data, and for aggregated data, which applies
to barangays’ FMCIs.
Developing a Geospatial Framework for Calculating a 15-Minute City Index (FMCI): The Case of Quezon City
79
3 RESULTS AND DISCUSSION
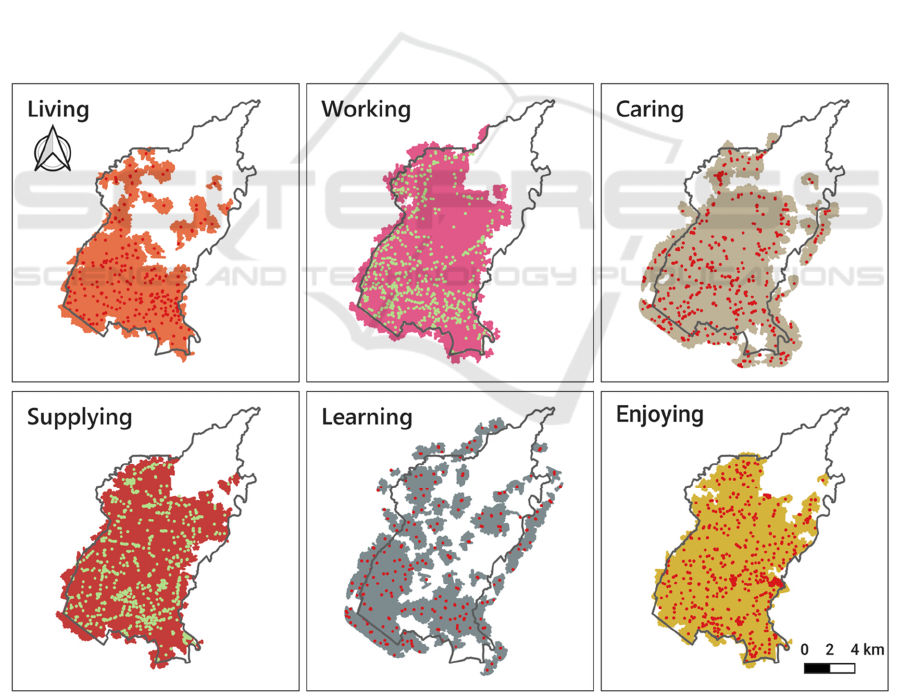
3.1 Service Areas
Six maps representing the coverage area of the six
SFs discussed were made, with a 100-meter tolerance
distance for the network analysis. The generated
maps are in Figure 5. It can be observed that the
location of services is heavily concentrated in the
southern part of the city. Notably, La Mesa Dam, a
watershed area, is in the northern part of Quezon City.
The presence of this watershed reservation explains
the lack of points of interest and, consequently, low
coverage of service areas, as displayed by the large
space in the northern area.
3.2 Scoring Regions and Barangays
As discussed in Section 2.5.1, regions were generated
from overlaying service area datasets, and AGB
scores were obtained by summing corresponding
weights. Intermediate scores were determined
following the methodology detailed in Section 3.5.2.
Higher intermediate scores suggest a closer proximity
to achieving a high 15-minute city index. Similar to
scored regions, the specific needs of different age
groups are considered in this part through the weights
of SF.
The complete results of the intermediate score for
each barangay, categorized by age group, are shown
in Figure 6. Darker areas imply a higher number of
overlapping service area datasets, as AGB scores are
from the summation of weights. However, it is
important to note that this does not necessarily
indicate a higher population served in darker areas, as
the population distribution of each age group has not
yet been taken into consideration. Higher
intermediate scores suggest a closer proximity to
achieving a high 15-minute city index. These scores
illustrate the specific needs of different age groups,
which are considered in this part through the weights
of the SFs.
Figure 5: Generated service areas and points of interest for each of the six SFs. Each dot represents a POI.
GISTAM 2025 - 11th International Conference on Geographical Information Systems Theory, Applications and Management
80
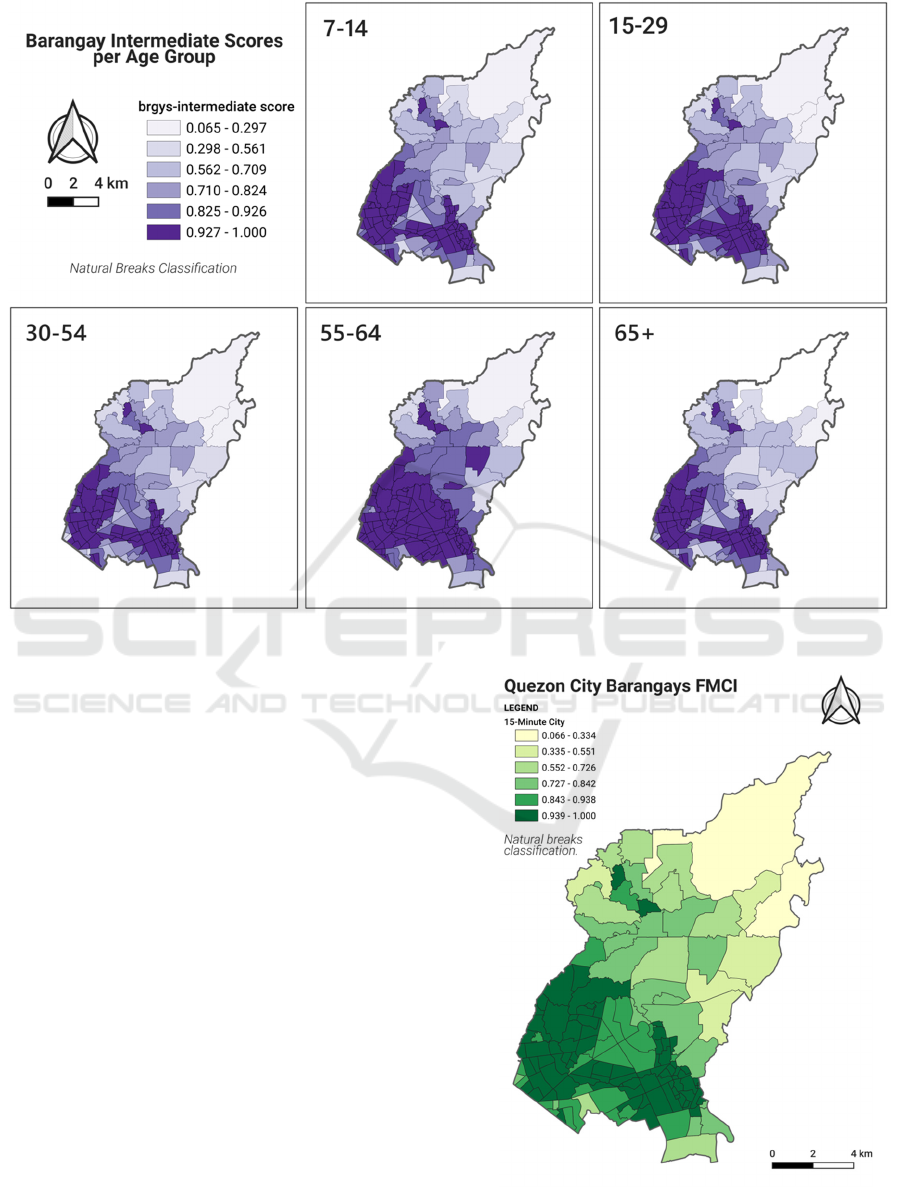
Figure 6: Age-Group-Based Scores per barangay.
3.3 15-Minute City Index
After summing up the products of each calculated
intermediate score by the corresponding barangay
population percentage for each age group, the 15-
minute city index (FMCI) of each barangay is
generated. Figure 8 shows the distribution of
barangays categorized by FMCI ranges. These ranges
are established through the division of the entire
FMCI spectrum into five equal intervals, from the
minimum to the maximum value.
Out of 142 barangays, 56 achieved a perfect
FMCI of one, representing 40% of the total barangays
in Quezon City. This indicates that residents of all age
groups of these barangays have access to the six SFs
within a 15-minute walk. Conversely, the lowest
FMCI of 0.066 was recorded for Pasong Putik.
Situated in the northern part of Quezon City near the
Sierra Madre Mountain Range and La Mesa Dam, the
low FMCI of Pasong Putik implies that this area has
low accessibility to the services defined by the six
SFs. Table 6 shows the complete list of barangays that
achieved a perfect FMCI and those that recorded the
three lowest FMCIs in Quezon City.
Figure 7: FMCI for each barangay in Quezon City.
Developing a Geospatial Framework for Calculating a 15-Minute City Index (FMCI): The Case of Quezon City
81
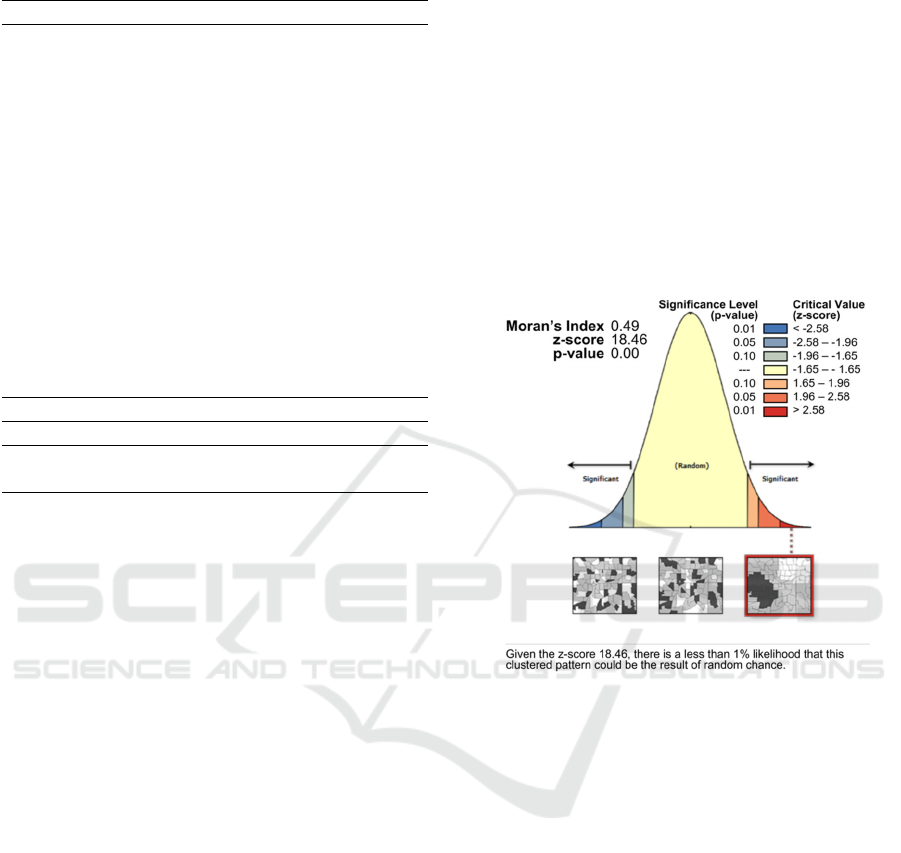
Table 6: Barangays with the highest and three lowest FMCI.
FMCI Barangay Names
1
(highest)
Alicia, Amihan, Bagumbuhay, Balong
Bato, Bayanihan, Blue Ridge B, Bungad,
Claro, Damayan, Del Monte, Dioquino
Zobel, Duyan-duyan, E. Rodriguez, East
Kamias, Escopa I, Escopa II, Escopa III,
Escopa IV, Kamuning, Katipunan, Krus Na
Ligas, Lourdes, Maharlika, Malaya, Mariblo,
Marilag, Masagana, Masambong, Milagrosa,
Obrero, Paraiso, Pinagkaisahan, Quirino 2-A,
Quirino 2-B, Quirino 2-C, Quirino 3-A,
Ramon Magsaysay, Roxas, Sacred Heart,
Saint Peter, San Antonio, San Martin De
Porres, San Roque, San Vicente, Santa
Teresita, Santo Domingo (Matalahib),
Sienna, Sikatuna Village, Silangan,
Tagumpay, Talayan, Tatalon, Teachers
Village East, Veterans Village, Villa Maria
Clara, West Kamias
0.333
Payatas
0.243
Bagong Silangan
0.066
(lowest)
Pasong Putik Proper
3.4 Global and Local Cluster Analysis
With the FMCI already defined for each
administrative division, this section explores
significant geospatial patterns to identify
relationships concerning the index. The spatial
variation of the FMCI across barangays was
examined using spatial autocorrelation techniques.
As shown in Figure 8, the Global Moran’s I statistic
of 0.485244 indicates positive spatial autocorrelation,
suggesting a clustered distribution of FMCI values
among barangays. The statistical significance of this
result, supported by a z-score of 18.46 and a p-value
near zero, confirms a less than 1% likelihood that the
observed clustering occurred randomly. These
patterns are also visually evident in the FMCI
distribution map in Figure 7.
The positive spatial autocorrelation indicated by
the Global Moran's I suggests that FMCI values are
not randomly distributed across barangays but rather
tend to cluster. This implies that areas with similar
levels of access to SFs are geographically proximate,
reflecting spatial dependencies due to factors like
urban infrastructure, socioeconomic conditions, and
geographic location. The significance of this result
reinforces the reliability of the clustering patterns and
provides a robust foundation for understanding
spatial disparities.
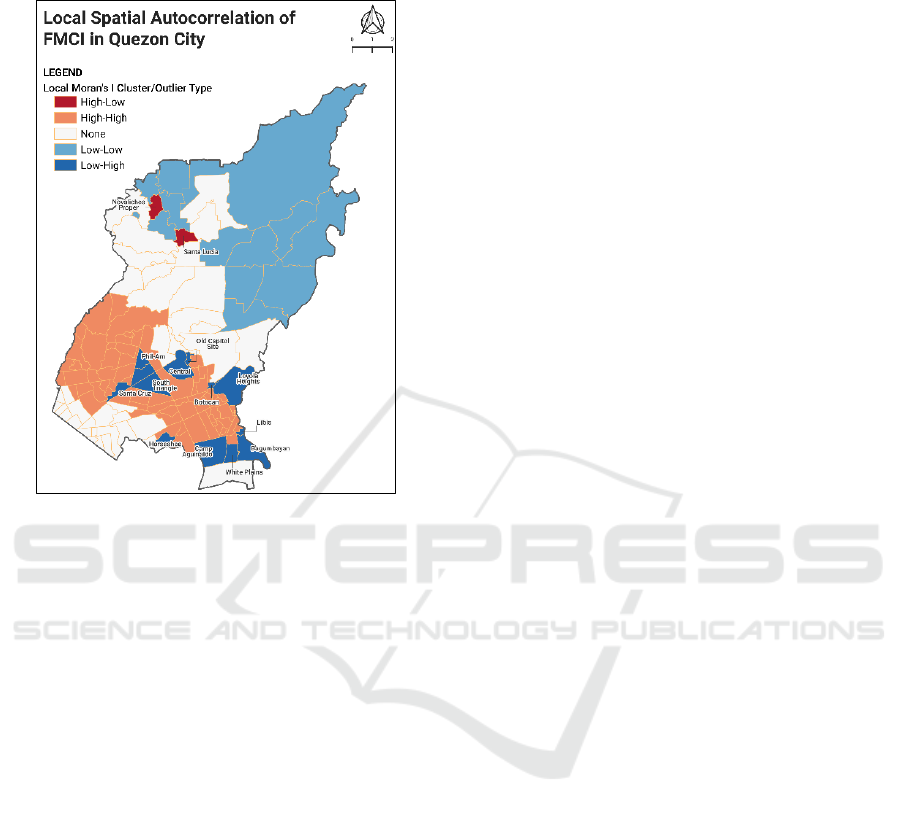
Local Moran’s I provided more granular insights,
identifying barangays as hot spots (High-High or
HH), cold spots (Low-Low or LL), or outliers (High-
Low or HL and Low-High or LH). Figure 9 illustrates
these patterns. Among the 142 barangays, 77 in the
southern part of Quezon City form HH clusters with
high FMCI values, reflecting greater access to the six
SFs. Conversely, 13 northern barangays form LL
clusters. Outliers include 13 LH barangays with open
spaces and 2 HL barangays near the watershed.
Notably, the remaining 37 of 142 barangays are not
statistically significant. Thus, results from the
extensive FMCI hot spots suggest that the 15-minute
city concept is consistently realized throughout most
of the study area.
Figure 8: Global Moran’s I spatial autocorrelation report of
FMCI in Quezon City.
The Local Moran’s I analysis provides a deeper
understanding of the spatial dynamics within Quezon
City. The 77 HH barangays suggest that these areas
benefit from better urban infrastructure, higher
population density, and improved access to essential
SFs. On the other hand, the 13 LL barangays indicate
that natural features such as open spaces and the La
Mesa Watershed limit access to these functions,
creating spatial disparities in service provision. The
outliers suggest that factors like land use (e.g., parks
and cemeteries) and proximity to natural features play
an important role in shaping access to social services
in these areas and highlight the complexity of spatial
patterns and the need for context-specific
interventions to address inequities. The observed
clustering supports the Global Moran’s I results,
emphasizing positive spatial autocorrelation among
barangays. These findings highlight disparities in
accessibility, with southern barangays benefiting
from proximity to Metro Manila's urban core, while
GISTAM 2025 - 11th International Conference on Geographical Information Systems Theory, Applications and Management
82
northern barangays face limitations due to geographic
and land use constraints.
Figure 9: Cluster/Outlier Map based on Local Moran’s I
spatial autocorrelation of FMCI in Quezon City.
4 CONCLUSIONS
This study explores the 15-minute city concept,
emphasizing the importance of providing residents
with accessible essential services within a 15-minute
radius, thereby enhancing urban quality of life. In
Quezon City, service areas for these functions were
generated using points of interest (POIs), producing
maps that revealed a concentration of accessibility in
the city's southern regions. To contextualize these
findings, a 15-minute city index (FMCI) was
developed, integrating geospatial and demographic
data, including population and age distribution. The
FMCI evaluates how well areas achieve ideal
accessibility to the six SFs.
Analysis showed that 57 of 142 barangays,
predominantly in the south, achieved an FMCI of 1,
signifying access to all six functions. In contrast,
northern barangays like Pasong Putik scored the
lowest (0.066) due to geographical and land use
constraints. Spatial autocorrelation using Moran’s I
confirmed clustering patterns of FMCI values,
identifying significant hot spots in the south and cold
spots in the north.
The FMCI, grounded in a geospatial framework,
provides valuable insights for policymakers to
enhance urban life by addressing proximity,
sustainability, and social equity while aligning with
the 15-minute city concept (Moreno, 2019). To
improve future implementations, service area
generation can be refined by incorporating
walkability in paths and adjusting walking speeds per
age group. Additionally, the 1-km buffer can be
implemented as network buffer, not a Euclidean
buffer. Sensitivity analysis should also be performed
for the expert-given weights to reinforce its
reliability. To overcome boundary effects,
tessellation-based calculation can be performed
instead of calculating the FMCI per barangay, as
calculating FMCI at a finer spatial resolution, such as
the household level, may reveal more nuanced spatial
patterns. Lastly, incorporating service prioritization
within each SF can improve the ranking, tailoring
scores more effectively for different age groups.
ACKNOWLEDGMENTS
The authors would like to thank Gerardo Lanuza,
Rhea Lyn Dealca, Ma. Afrecita Nieva, Aurora Llige,
John Abletis, Jonathan Guevarra, Carlyn Ann Ibañez,
Dominique Sasha Amorsolo, and Kristian Karlo
Saguin for sharing their expertise for evaluating the
SFs for each age group. We would also like to thank
the Department of Science and Technology – Science
Education Institute (DOST-SEI) and the Engineering
Research and Development for Technology (ERDT),
and the Office of the Vice Chancellor for Research
and Development (OVCRD) of the University of the
Philippines Diliman for the faculty research
dissemination grant that supported the publication
and presentation of this paper.
REFERENCES
Akrami, M., Sliwa, M. W., & Rynning, M. K. (2024b).
Walk further and access more! Exploring the 15-minute
city concept in Oslo, Norway. Journal of Urban
Mobility, 5, 100077
https://doi.org/10.1016/j.urbmob.2024.100077
ArchDaily. (2024). In Conversation with Professor Carlos
Moreno, on the 15-Minute City Concept. YouTube.
https://youtu.be/n3u9Oax-
dZs?si=QGHvoD0HaNRWmmxo
Birkenfeld, C., Victoriano-Habit, R., Alousi-Jones, M.,
Soliz, A., & El-Geneidy, A. (2023). Who is living a
local lifestyle? Towards a better understanding of the
15-minute-city and 30-minute-city concepts from a
Developing a Geospatial Framework for Calculating a 15-Minute City Index (FMCI): The Case of Quezon City
83

behavioural perspective in Montréal, Canada. Journal
of Urban Mobility, 3, 100048.
https://doi.org/10.1016/j.urbmob.2023.100048
Caselli, B. (2021). From urban planning techniques to 15-
minute neighbourhoods. A theoretical framework and
GIS-based analysis of pedestrian accessibility to public
services. European Transport, 85, 1–15.
https://doi.org/10.48295/et.2021.85.10
Esri. (n.d.). Service area analysis layer. Arcgis.Com.
Retrieved June 4, 2024, from
https://pro.arcgis.com/en/pro-
app/latest/help/analysis/networks/service-area-
analysis-layer.htm
Fazio, M., Borghetti, F., Giuffrida, N., Pira, M. L., Longo,
M., Ignaccolo, M., Inturri, G., & Maja, R. (2023). The
“15-minutes station”: a case study to evaluate the
pedestrian accessibility of railway transport in Southern
Italy. Transportation Research Procedia, 69, 536–543.
https://doi.org/10.1016/j.trpro.2023.02.205
Gaglione, F., Gargiulo, C., Zucaro, F., & Cottrill, C. (2022).
Urban accessibility in a 15-minute city: a measure in the
city of Naples, Italy. Transportation Research Procedia,
60, 378–385.
https://doi.org/10.1016/j.trpro.2021.12.049
Gorrini, A., Presicce, D., Messa, F., & Choubassi, R.
(2023). Walkability for children in Bologna: Beyond
the 15-minute city framework. Journal of Urban
Mobility, 3, 100052.
https://doi.org/10.1016/j.urbmob.2023.100052
Gerilla, G. P., Hokao, K., & Takeyama, Y. (1995).
Proposed level of service standards for walkways in
Metro Manila. Journal of the Eastern Asia Society for
Transportation Studies, 1(3), 1041-1060.
Knap, E., Ulak, M. B., Geurs, K. T., Mulders, A., & Van
Der Drift, S. (2023). A composite X-minute city cycling
accessibility metric and its role in assessing spatial and
socioeconomic inequalities – A case study in Utrecht,
the Netherlands. Journal of Urban Mobility, 3, 100043.
https://doi.org/10.1016/j.urbmob.2022.100043
Mateo-Babiano, I., & Ieda, H. (2007). Street Space
Sustainability in Asia: The Role of the Asian Pedestrian
and Street Culture. Journal of the Eastern Asia Society
for Transportation Studies, 7, 1915–1930.
https://doi.org/10.11175/easts.7.1915
Mateo, J. (2023, June 16). Quezon City eyes ‘15-minute
city’ strategy in barangays. Philstar.com.
https://www.philstar.com/nation/2023/06/17/2274466/
quezon-city-eyes-15 minute-city-strategy-barangays
Moreno, C., Allam, Z., Chabaud, D., Gall, C. L., &
Pratlong, F. (2021). Introducing the “15 Minute City”:
Sustainability, resilience and place Identity in future
Post-Pandemic Cities. mart Cities, 4(1), 93–111.
https://doi.org/10.3390/smartcities4010006
Moreno, C., Gall, C., Chabaud, D., Garnier, M., Illian, M.,
& Pratlong, F. (2023, April 11). The 15-minute City
model: An innovative approach to measuring the
quality of life in urban settings 30-minute territory
model in low-density areas. https://hal.science/hal-
04065455/file/TI%20Chair%20White-Paper-
3%20EN.pdf
Papadopoulos, E., Sdoukopoulos, A., & Politis, I. (2023).
Measuring compliance with the 15-minute city concept:
State-of-the-art, major components and further
requirements. Sustainable Cities and Society, 99,
104875. https://doi.org/10.1016/j.scs.2023.104875
Philippines Age structure - Demographics. (2020).
https://www.indexmundi.com/philippines/age_structur
e.html
Philippine Statistics Authority (PSA). (2023, June 29).
Marriage Statistics in Quezon City: 2021. GOVPH.
https://rssoncr.psa.gov.ph/content/NCRII/marriage-
statistics-quezon-city-
2021#:~:text=Marriages%20Registered%20marriages
%20in%20Quezon,figure%20of%20the%20previous%
20year.
Poorthuis, A., & Zook, M. (2023). Moving the 15-minute
city beyond the urban core: The role of accessibility and
public transport in the Netherlands. Journal of
Transport Geography, 110, 103629.
https://doi.org/10.1016/j.jtrangeo.2023.103629
QGIS Documentation v: 3.34. (n.d.).
https://docs.qgis.org/3.34/en/docs/training_manual/qgi
s_plugins/plugin_examples.html
Schoeppe, S., Duncan, M. J., Badland, H. M., Rebar, A. L.,
& Vandelanotte, C. (2015). Too far from home? Adult
attitudes on children’s independent mobility range.
Children’s Geographies, 14(4), 482–489.
https://doi.org/10.1080/14733285.2015.1116685
Shahid, R., Bertazzon, S., Knudtson, M. L., & Ghali, W. A.
(2009). Comparison of distance measures in spatial
analytical modeling for health service planning. BMC
Health Services Research, 9(1).
https://doi.org/10.1186/1472-6963-9-200
Staricco, L. (2022). 15-, 10- or 5-minute city? A focus on
accessibility to services in Turin, Italy. Journal of Urban
Mobility, 2, 100030.
https://doi.org/10.1016/j.urbmob.2022.100030
Tolentino, N. J. Y., & Sigua, R. G. (2022). Characteristics
of Walking and Cycling in Metro Manila, Philippines.
Philippine Transportation Journal, 5(1), 20-40.
https://ncts.upd.edu.ph/tssp/wp-
content/uploads/2022/12/TSSP2022_Vol5-No1_02-
Tolentino-and-Sigua.pdf
Vaughn, W. (2023, October 6). 15-minute cities: Where
they can be found across the globe. City Monitor.
https://citymonitor.ai/environment/15-minute-cities-
where-are-they
Weng, M., Ding, N., Li, J., Jin, X., Xiao, H., He, Z., & Su,
S. (2019). The 15-minute walkable neighborhoods:
Measurement, social inequalities and implications for
building healthy communities in urban China. Journal
of Transport & Health, 13, 259–273.
https://doi.org/10.1016/j.jth.2019.05.005
Zhang, S., Zhen, F., Kong, Y., Lobsang, T., & Zou, S.
(2022). Towards a 15-minute city: A network-based
evaluation framework. Environment and Planning. B,
Urban Analytics and City Science/Environment &
Planning. B, Urban Analytics and City Science, 50(2),
500–514. https://doi.org/10.1177/23998083221118570
GISTAM 2025 - 11th International Conference on Geographical Information Systems Theory, Applications and Management
84
