
Evaluation of Detection Approaches for Road Anomalies Based on
Accelerometer Data
Edvinas Pocevicius
1
, Donatas Paulauskas
1
, Tomas Eglynas
2a
Valdas Jankunas
2
, Sergej Jakovlev
2
,
Mindaugas Jusis
3
and Dovydas Lizdenis
4
1
Department of Marine Engineering, Klaipeda University, H. Manto g. 84, Klaipėda, Lithuania
2
Marine Research Institute, Klaipeda University, H. Manto g. 84, Klaipėda, Lithuania
3
Department of Informatics and Statistics, Klaipeda University, H. Manto g. 84, Klaipėda, Lithuania
4
Department of R&D, Ltd Inotecha, Danes Street 47, Klaipeda, Lithuania
Keywords: Accelerometers, IoT, Road Anomalies, Containers, Green Transportation Infrastructure, High-Frequency
Filtering, Data Analysis, Shock Detection, Transportation Systems, Smart Algorithms.
Abstract: Current container security systems record vibrations and shocks, but their potential for creating smart
transportation systems remains underutilized. This study analyzes data collected from a truck and discusses a
concept for generating road condition maps from accelerometer data. An experiment was conducted by
mounting an accelerometer on a container door to gather acceleration data in various transport conditions.
The study focuses on analyzing vertical (Z-axis) accelerations as a primary indicator of road anomalies. The
developed concept can be integrated into logistics platforms, enabling vehicle drivers and infrastructure
managers to respond to road defects in a timely manner.
1 INTRODUCTION
Transport infrastructure is a fundamental element of
the economy and societal well-being; however,
monitoring and maintaining its condition is a complex
and resource-intensive process (Yarmukhamedov et
al., 2020). Flaws such as potholes, sunken manhole
covers, or uneven railway crossings can cause vehicle
breakdowns, cargo damage, and an increased risk of
accidents. Therefore, it is crucial to develop
innovative, cost-effective solutions that enable real-
time monitoring and assessment of road conditions.
In this context, next-generation IoT (Internet of
Things) technologies offer significant potential,
enabling data collection and analysis using existing
infrastructure (Ye et al., 2024).
Most modern containers designed for cargo
transportation are equipped with integrated IoT
systems that collect information about the container's
location, vibrations, and impacts. These systems,
based on low-power accelerometers, are primarily
used for ensuring security; however, their potential
a
https://orcid.org/0000-0002-9973-5896
for secondary data utilization remains underexplored
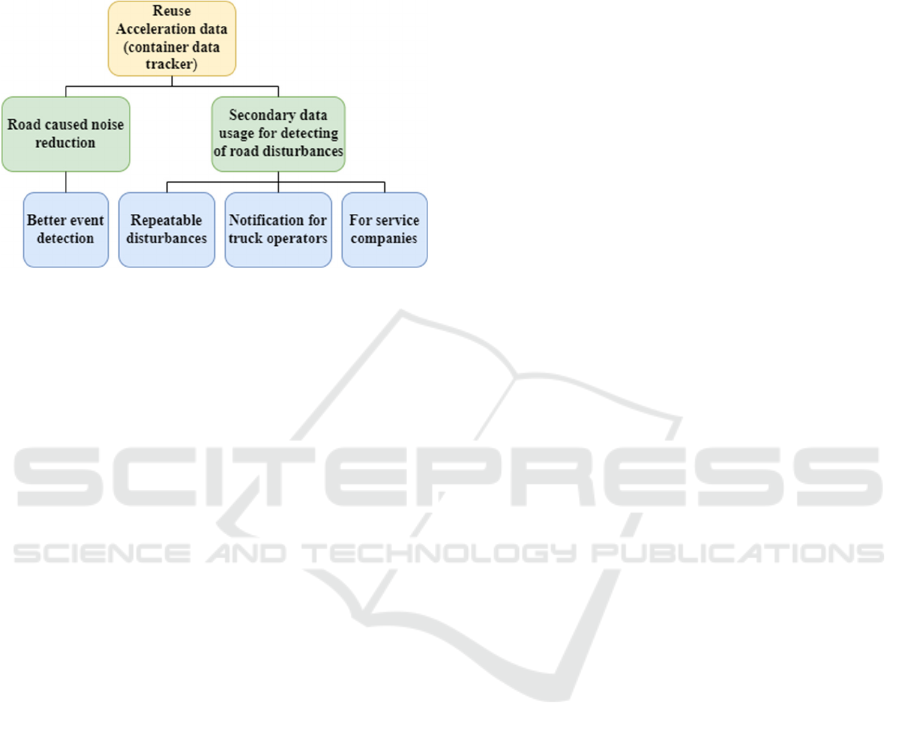
(Barlogis et al., 2025). The simplified process
illustrated in Figure 1 demonstrates how integrated
IoT systems in containers can be adapted to monitor
secondary events, such as detecting and recording
road anomalies. These systems, utilizing existing
accelerometer data, could identify events exceeding
threshold values, such as impacts caused by potholes,
railway crossings, or other uneven surfaces.
Figure 1: Concept of secondary event.
When such an event is detected, the recording
device can analyze the nature of the event and, along
with geolocation data, transmit this information not
only to the owners of the recording devices but also
to centralized data processing systems. Third-party
systems (platforms), using algorithms and artificial
intelligence, could identify recurring events and
determine road anomalies in specific locations. The
588
Pocevicius, E., Paulauskas, D., Eglynas, T., Jankunas, V., Jakovlev, S., Jusis, M. and Lizdenis, D.
Evaluation of Detection Approaches for Road Anomalies Based on Accelerometer Data.
DOI: 10.5220/0013426300003941
In Proceedings of the 11th International Conference on Vehicle Technology and Intelligent Transport Systems (VEHITS 2025), pages 588-595
ISBN: 978-989-758-745-0; ISSN: 2184-495X
Copyright © 2025 by Paper published under CC license (CC BY-NC-ND 4.0)
conclusions obtained, integrated into GIS
(Geographic Information Systems) platforms, could
be forwarded to the responsible authorities tasked
with road maintenance and repair. The figure below
illustrates how accelerometer data can be used for
secondary events (see
Figure 2
).
Figure 2: Secondary data usage model.
This process would ensure not only accurate and
timely detection of road defects but also more
efficient resource utilization for road maintenance.
Additionally, this data could be used to create real-
time road condition maps accessible not only to
institutions but also to the transport sector and the
public. Such a solution would allow logistics
companies and drivers to plan their routes in advance,
avoiding hazardous or poorly maintained road
sections. Based on edge computing methodologies,
these systems could be deployed on a larger scale, for
example, for road condition monitoring [citation
needed]. This approach would not only contribute to
improving infrastructure maintenance but also
support the development of green transportation
infrastructure by reducing the costs and
environmental impact of traditional solutions.
Road condition monitoring typically requires
specialized equipment, such as LiDAR technology or
cameras which are expensive and demand significant
computational power. In this paper, we discuss
alternatives—using accelerometers installed in
containers as an additional data source.
Accelerometers, which detect changes in acceleration
during transport, enable the identification of road
irregularities based on the vibration patterns of the
vehicle. By integrating this data with GPS
information, real-time road condition maps can be
generated, which could be beneficial for both drivers
and infrastructure managers.
2 RELATED WORKS
2.1 Road Damage
Various methodologies have been proposed in recent
studies to assess and predict road damage, each
employing diverse approaches.
For instance, Yang, X. et al. (Yang et al., 2024) in
a recent study, sought to review and analyze
advancements in automated systems for road
maintenance, focusing on detecting road distress. The
study explores the integration of computer vision,
artificial intelligence, and robotics in the context of
road infrastructure, emphasizing developments in
detecting both surface and internal road damages. For
surface distress detection, sensor technology, image
processing, machine learning, and deep learning
techniques like convolutional neural networks
(CNNs) were integrated to enhance accuracy in
identifying cracks and other damages.
Similarly, Deepa, D. (Deepa & Sivasangari,
2023) aimed to create an efficient method for
detecting and classifying road damages using a hybrid
deep learning framework. Their approach utilized a
combination of techniques: pre-processing images
with adaptive histogram equalization, segmenting
damage using fuzzy c-means clustering, and
extracting features with Laplacian edge detection and
wavelet-Walsh transforms. These optimized features
were classified using a hybrid DeepCapsule
Autoencoder-based Convolutional Neural Network
(DCACN) enhanced by Whale Optimization. The
study concluded that "The proposed work attains
98.815% accuracy, and the obtained results
outperform the existing approaches.”
Furthermore, a study by Mattes, P. (Mattes et al.,
2023) introduced Competitive Reconstruction
Networks (CRNs) for detecting road damage in
mobile mapping data, specifically focusing on
anomaly detection within 3D LiDAR-derived point
clouds. The authors set out to develop a semi-
supervised machine learning approach capable of
identifying road anomalies with minimal reliance on
manually labeled data, addressing a major challenge
in road quality evaluation. The study concludes that
CRNs can effectively enhance road quality
assessments by providing accurate, automated
anomaly detection in road imagery derived from
LiDAR point clouds.
Lastly, in a recent study, Boyarchikov Y., &
Martinec T. (Boyarchikov & Martinec, 2024) aimed
to develop a cost-effective, sensor-based solution for
real-time road pavement monitoring, seeking an
alternative to costly methods like LiDAR and labor-
Evaluation of Detection Approaches for Road Anomalies Based on Accelerometer Data
589

intensive manual inspections. Using accelerometers
and gyroscopes mounted on vehicles, the system
captures vibration data, which is then processed
through neural networks to classify road sections as
"damaged" or "undamaged." Showing the potential of
replacing LiDAR based technologies with
accelerometer based devices.
2.2 Accelerometers for Road Anomaly
Detection
Other studies also underlined the affordability and
accuracy of using accelerometer based technologies
to monitor and detect road and bridge damage.
For instance, a recent study by Gupta J. et al.
(Gupta et al., 2024) set out to explore the integration
of IoT-based sensor technology for sustainable road
safety. It examined the role of sensors such as
accelerometers, gyroscopes, and ultrasonic sensors in
enhancing vehicle safety through applications like
driver drowsiness detection, airbag deployment, and
hazard identification on the road. The accelerometer
relies on a MEMS (Micro-Electro-Mechanical
Systems) framework, utilizing piezo resistive
materials to register minute changes in resistance
under strain. The study demonstrated that these
accelerometer-based systems provide high accuracy
and rapid response times, which are critical for
reducing accidents and improving overall road
safety.
Another example of such systems was presented
by Kuladeep Chilamkuri et al. (Chilamkuri & Kone,
2020), who set out to develop a system for real-time
structural health by monitoring vibrations and
displacement of the Varadhi Bridge in India. The
study used the ADXL335 accelerometer integrated
with an Arduino UNO microcontroller to measure
vibrations and displacement on one of the bridge
spans. This setup provided a low-cost, efficient
system for real-time structural health monitoring,
enabling early detection of potential structural issues
on the bridge. Through continuous data collection, the
system identified critical vibration levels, enabling
proactive maintenance alerts when vibrations
exceeded safe thresholds. This study showed that
using such accelerometer based systems can allow
reliable condition monitoring of structures
experiencing high traffic.
Similarly, Fujino Y. et al. (Fujino et al., 2019) in
the study on Japan's infrastructure monitoring,
accelerometers played a crucial role, especially in
assessing the dynamic responses of structures like
long-span bridges and high-rise buildings.
Accelerometers measure vibrations and accelerations
resulting from natural forces such as wind and
seismic activity, providing critical data on structural
behavior under stress. The authors concluded that
Japan's approach to structural monitoring provides
valuable insights, helping maintain resilience and
operational safety in infrastructure. In a further study
Fujino Y. et al. (Fujino & Siringoringo, 2020)
outlined Japan's efforts to improve infrastructure
management through a government-sponsored
research program. In the methodology,
accelerometers were installed at various structural
points to capture real-time data. This setup allowed
researchers to measure natural frequencies, damping
ratios, and vibration patterns, helping to detect
anomalies that could indicate structural weaknesses
or damage. The data was then analyzed to confirm
theoretical models, often aligning well with design
assumptions, thus validating the structures' resilience.
The results underscored the accelerometers'
effectiveness in providing a non-invasive, continuous
monitoring solution.
Furthermore accelerometer based systems were
used by David Krier et al.(Krier et al., 2014), who
aimed to improve the accuracy of vehicle control
systems by directly estimating road-tire forces using
in-tire accelerometers. Typically, these forces are
estimated indirectly, but this study utilized
accelerometers affixed to the tire's inner tread,
capturing detailed tire-road interaction data through a
Principal Component Analysis (PCA) model. The
study concluded that the PCA model provided a
feasible and effective method for capturing the
vertical and longitudinal forces acting on the tire. The
research suggests that this innovative approach could
enhance vehicle safety and performance in real-world
applications, though further work is needed to assess
robustness across varying road conditions. A
continuation of this type of methodology could allow
for more accurate road condition estimation in further
studies.
3 METHODS
3.1 Concept of Accelerometer Usage
for Secondary Event Detection
As we know, perfect roads don't exist, at least not in
our area. Road defects could be monitored using the
vehicles traveling on them.
Smart systems installed in vehicles will generate
timestamps and values of impact events caused by
road defects and detected by sensors (see
Figure 3).
VEHITS 2025 - 11th International Conference on Vehicle Technology and Intelligent Transport Systems
590
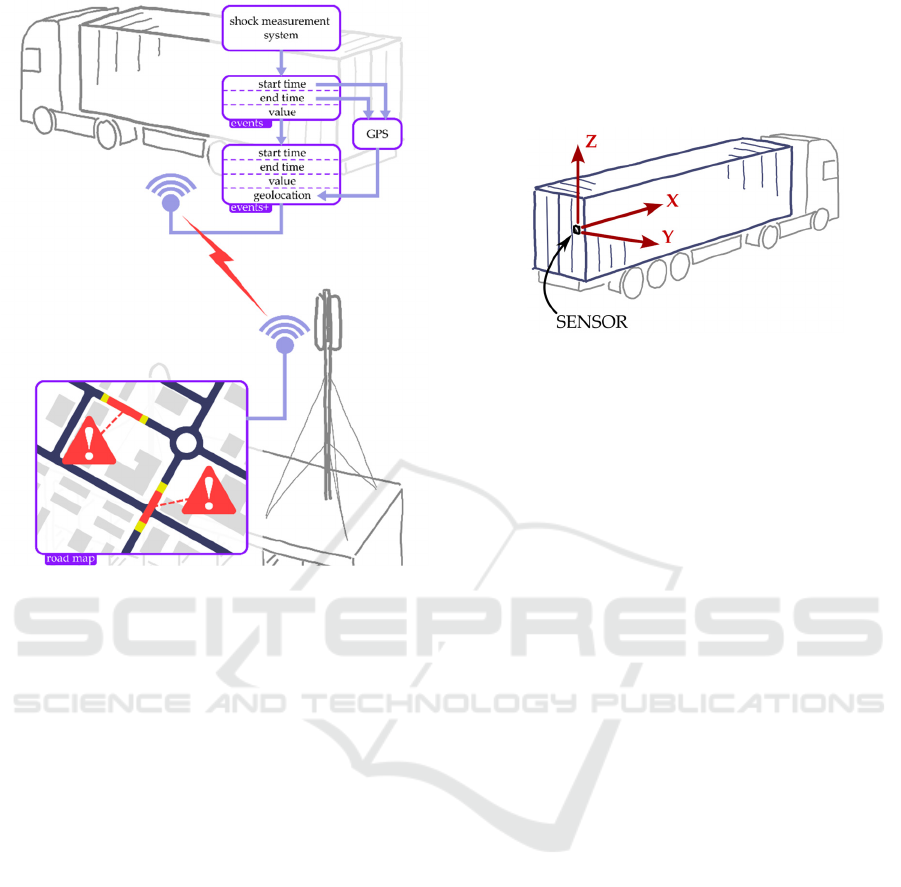
Figure 3: The concept of road monitoring system.
These data, synchronized with global positioning
system (GPS) data, should be forwarded for analysis
to the relevant authorities, who will assess road
conditions in each section, provide this information to
traffic participants, carry out preventive maintenance,
and plan road repair work. Further we focus on
detecting road defects using a sensor mounted on a
container. The study was conducted blindly, meaning
that conclusions about road defects were drawn solely
based on data obtained from the sensor without
knowing the actual physical condition of the road.
3.2 Measurement Method
When a vehicle's wheel enters a road defect zone, the
trajectory of the wheel's axis usually changes
abruptly, resulting in an impact. This generates
vibrations that propagate throughout the entire
vehicle. These impact-induced vibrations can be
recorded by a sensor installed in the vehicle. The
sensor could be installed either in the vehicle itself or
on the transported cargo. For cargo, marine containers
are particularly suitable because of their large mass—
the amplitude of vibrations caused by impacts will be
greater than with smaller masses, increasing the
likelihood of detecting road defects. Additionally, it
is currently a trend to install smart sensors on
containers, and road defect detection could serve as
an additional feature. For our experiment, it was
decided to mount the sensor on the door of a container
transported by a truck (Figure
4
), as smart sensors are
most commonly installed in this location.
Figure 4: Sensor mounting position.
The sensor, using an accelerometer, recorded
accelerations along three axes: X – longitudinally in
the direction of the truck's movement, Y –
transversely to the truck, and Z – vertically relative to
the road surface. The sensor processes this
accelerometer data using a special algorithm that
determines whether an impact event occurred. In this
study, accelerometer data with a 100 Hz sampling rate
was used. The data was collected while the truck
transported an empty container in the city of
Klaipėda. The total duration of the collected data (the
truck's journey) was 31 minutes. Two specific
operational periods of the truck were selected for
analysis: the first from the engine being off to the start
of acceleration, and the second during road travel
without active speed changes.
Approaching the resolution of this hypothesis,
further research was focused on detecting road
irregularities using edge computing-based algorithms.
The sensors used in container security and data
recording systems are low-power devices, which also
means that their edge computing capabilities are very
limited. Usually, these limitations are tied to device-
level functionality. For example, in the case of FSM
(Finite State Machine) algorithms, only predefined
features can be used to implement the algorithm. All of
this contributes to the complexity of solving this
hypothesis. Classical detection methods, as mentioned
earlier, cannot essentially be applied, making it
necessary to seek simpler approaches and methods. To
find these solutions, it is first necessary to understand
the data (acceleration data), its nature and
characteristics, identify its distinctive features, and find
a method to extract them using predefined features.
Considering this, a field experimental study was
conducted, using classical data collection equipment to
gather acceleration data.
Evaluation of Detection Approaches for Road Anomalies Based on Accelerometer Data
591
The equipment was mounted on the door of the
container (transported by the truck), simulating the
typical installation position of data recorders. This is
essential for detecting the characteristic properties of
the data from a specific position. Changing the
position is likely to alter the nature of the data (for
example, mounting it at the front of the truck may
affect the suspension impact, resulting in different
patterns for the same anomaly). Therefore, during the
field experiment, the classical device position was
chosen.
4 EXPERIMENTAL RESULTS
4.1 Accelerations at the Start of
Movement
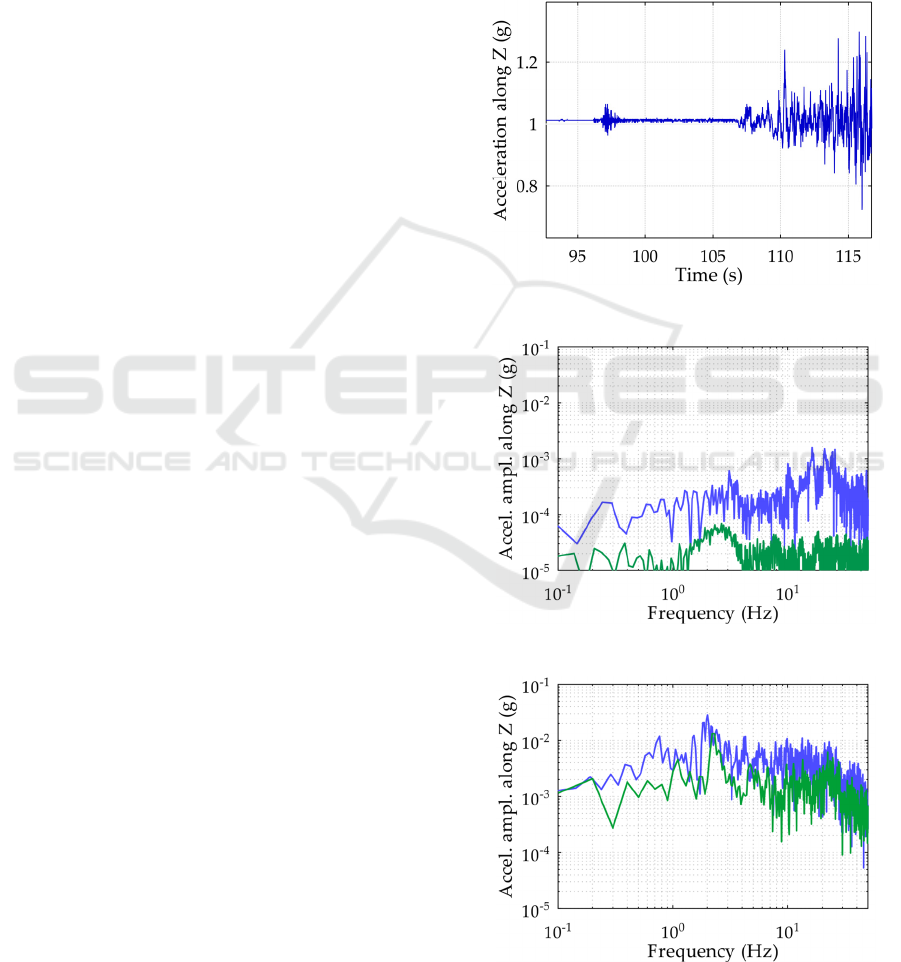
In the vertical acceleration (Z-axis) graph (see Figure
5), during the period from 92.0 s to 96.2 s, the truck's
engine was turned off. In this interval, the
acceleration amplitude was very low, registering only
minor mechanical vibrations (e.g., the driver closing
the door) and the internal noise of the accelerometer.
The constant component of the vertical
acceleration is not exactly 1 g as expected because the
accelerometer is not perfectly oriented; that is, the X-
axis is not perfectly aligned with the zenith, and the
X and Y axes are not perfectly aligned with the
horizontal plane.
At the time point of 96.2 s, the driver started the
truck's internal combustion engine, and during the
period from 96.8 s to 97.2 s, the engine's idle speed
was increased several times. An increase in the
recorded acceleration amplitudes is visible in all
graphs, with the Z-axis showing the highest
amplitude at 0.051 g. While the engine continued to
idle during the period from 97.2 s to 106.7 s, lower
acceleration amplitudes were recorded, with the Z-
axis reaching a maximum of 0.008 g. It can be
observed that, while the truck engine is running, the
sensor registers the strongest vibrations caused by the
engine on the Z-axis. This is likely due to the
structural characteristics of the truck.
In the acceleration spectrum (Figure 6), the green
color represents the Z acceleration spectrum when the
engine was off (period from 92.0 s to 96.2 s), while
the blue color represents the spectrum when the
engine was idling and revved several times (period
from 96.8 s to 97.2 s). It can be observed that the
strongest influence of engine vibrations on the road
defect detection algorithm occurs in the high-
frequency range starting from 10 Hz, with amplitudes
not exceeding 0.002 g.
In the case of Z-axis accelerations, an increase in
acceleration amplitudes is also observed across the
entire frequency range. A peak can be identified at
approximately 1 Hz. When examining higher
frequencies, it can be noted that, similar to the engine
on/off case (Figure 6), the slope of the acceleration
amplitudes differs from those observed in the X and
Y axes. This can likely be attributed to the structural
characteristics of the truck and the operating
conditions of the engine.
Figure 5: Start of movement: acceleration Z.
Figure 6: Z acceleration spectrum of the engine off and on.
Figure 7: Z acceleration spectrum without acceleration and
with acceleration.
VEHITS 2025 - 11th International Conference on Vehicle Technology and Intelligent Transport Systems
592
Comparing the Z acceleration patterns presented in
Figures 6 and 7 in the high-frequency range, it can be
observed that the envelope characteristics of the
patterns are not identical. Therefore, the influence of
vibrations caused by road irregularities cannot be ruled
out, as the vertical displacement of the truck's wheel
when traveling over road irregularities is expected to
be significantly greater than in the horizontal direction.
This is further confirmed by the observation that, in the
high-frequency range (from ~2 Hz), the acceleration
amplitudes recorded on the Z-axis are significantly
higher than those on the X or Y axes. Thus, it can be
concluded that, for a road defect detection algorithm, it
is sufficient to analyze only the Z-axis accelerations.
4.2 Accelerations While Driving
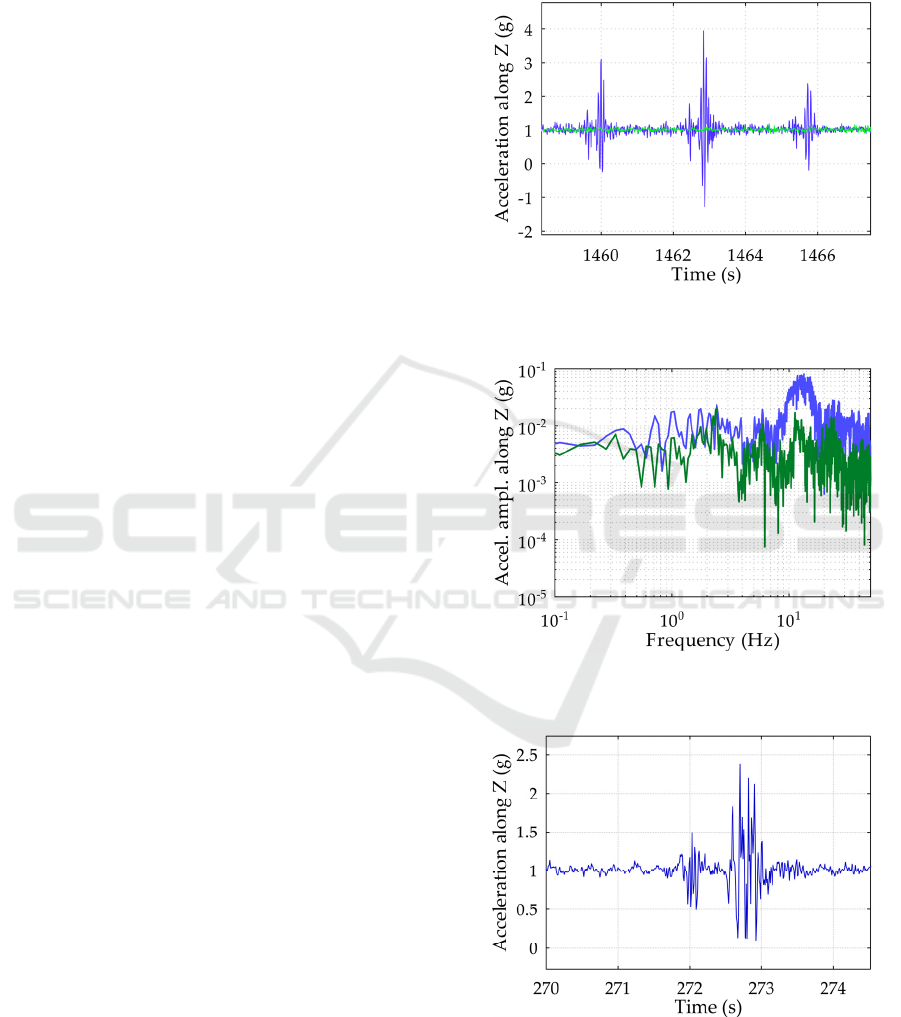
In the vertical acceleration graph (Figure 8), the green
curve represents the accelerations when the truck was
driving on a road without significant defects, while
the blue curve represents the accelerations when the
truck encountered three road defects. The graph
clearly shows vibrations caused by impacts at the
timestamps 1459.6 s, 1462.3 s, and 1465.2 s. It can be
observed that the bursts of vibrations caused by the
impacts occur in two stages, with the first likely
originating from the front axle of the truck.
Looking at the acceleration patterns (Figure 9),
where the green curve represents the truck driving on
a road without significant defects and the blue curve
represents the truck encountering three defects, the
oscillations in acceleration caused by the road defects
clearly stand out in the frequency range from 9 Hz to
17 Hz.
4.3 Results and Analysis of Road
Irregularities
The data is collected at a low frequency of only 100
Hz, which is typical for such systems. This also
presents a significant challenge, especially from the
perspective of classical event detection methods.
During the experiment, a dataset was collected
from a single container journey. The entire experiment
was filmed to more accurately identify road sections
where anomalies were detected. A more detailed
analysis of the recorded impacts is presented below.
A manhole cover that has sunk into the asphalt
was detected (see Figure 10). This is one of the most
common road defects that can affect cargo. In this
case, the defect is minor and has no significant
impact. However, such road defects, where the
manhole has sunk more than 5 cm, can not only
damage the vehicle's wheels but also affect the cargo.
There have been known cases where similar
defects caused pallets with cargo to topple inside a
container (which could also result from improperly
secured cargo).
Figure 8: Z acceleration graph without impacts and with
impacts.
Figure 9: Z acceleration graph without impacts and with
impacts.
Figure 10: Shock detection - manhole cover.
Another commonly encountered impact-causing
infrastructure element is a railway crossing(see Figure
11). Although this is not a critical element, such a
Evaluation of Detection Approaches for Road Anomalies Based on Accelerometer Data
593
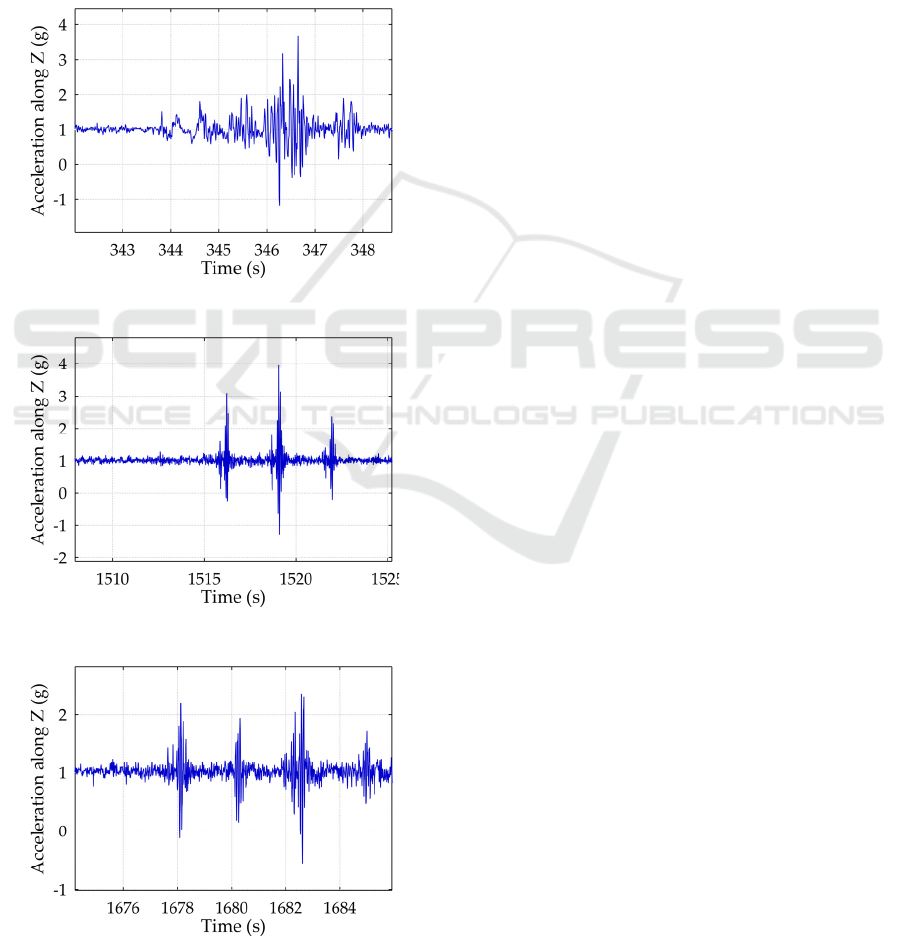
reverse road condition assessment system could help
identify crossings that will require maintenance in the
near future. This would enable the creation of maps of
road sections in need of repair and prioritize them
based on the frequency and intensity of impacts.
Road wear, one of the more common defects, is
observed in this case as recurring road depressions
and potholes. These defects cause the container with
cargo to sway. In this instance (see Figure 12), the
damage is not critical; however, the frequency and
severity of such defects along the road segment may
indicate the need for road reconstruction.
Figure 11: Shock detection – railway crossing.
Figure 12: Shock detection – Pothole/uneven road.
Figure 13: Shock detection – Overpass joints.
Another infrastructure element is overpass joints
(see Figure 13). Damage and potholes often develop
in the joints of older overpasses. Similar to railway
crossings, these areas can be monitored, and as the
risk of accidents increases, they can be identified as
problematic locations.
5 CONCLUSIONS
Since many heavy vehicles transporting containers as
cargo travel on the roads, most modern containers are
equipped with data loggers and tracking systems for
security purposes. This equipment is based on edge
computing, focusing on safety and damage detection
issues, such as critical impacts, deviations from the
route, door openings, or lock damages. A significant
portion of modern detection systems uses low-power
edge computing solutions. One such solution is low-
power accelerometers, which can process data locally
and generate interrupts to data transmission
subsystems when predefined thresholds are exceeded.
These subsystems operate in sleep mode due to higher
energy consumption, so they do not perform complex
computations and rely on interrupts generated by
sensors. Such algorithms are usually based on FSM
(Finite State Machine) models. Limited rules and
capabilities drive the need to develop algorithms
based on logic and data analysis. The currently
recorded events, such as impacts, are no exception.
These are typically recorded when the sensor's value
exceeds predefined g-force thresholds. This area
provides significant flexibility and opportunities to
refine event-based system algorithms. Additionally,
there is potential to collect secondary information.
Imagine transforming the vast amounts of
containers on the road into a road anomaly detection
system. This would enable the creation of road
condition maps based not on a single measurement
but on collective events. Currently, road conditions
are primarily assessed using specialized equipment in
targeted evaluations. This approach produces
accurate road models and assesses their condition, but
it only addresses issues with specific roads and does
not contribute to the broader monitoring of road
conditions, which is essential for advancing green
transportation initiatives.
However, this could change if modern IoT
technologies and existing recorders, supplemented
with new algorithms, enable data collection from
these devices. This data would consist of events that
exceed predefined thresholds on the road, allowing
the identification of road issues such as potholes,
uneven surfaces, inclines, and other irregularities. By
VEHITS 2025 - 11th International Conference on Vehicle Technology and Intelligent Transport Systems
594

combining this data with geolocation information, we
can create a map of such anomalies. This map would
not rely on isolated events but on recurring ones. For
example, if a certain number of recurring events are
detected at the same coordinates, it can be confirmed
that an anomaly exists. By marking and classifying
anomalies in this way, it becomes possible to create
large-scale road maps. Based on the type of anomaly,
road maintenance services can respond accordingly.
As a secondary use, this data would also benefit
truck drivers and logistics companies. The latter
could use this information to prevent transportation
disruptions. It would work similarly to Waze or
Google alerts. When integrated into appropriate GIS
solutions, this information could warn container truck
drivers about upcoming obstacles (such as road
irregularities) on their route. Unlike Waze or Google,
this information would not only rely on user input but
also on data provided by recorders. This approach
would be not only more accurate but also more
reliable. For evaluating event classification, such as
the size of a pothole or the potential risk of damaging
vehicle wheels or suspension, artificial intelligence
(AI) methods could also be employed. Here’s how
they could work:
The recorder's MCU can save accelerometer data
stored in its buffer after an event and transmit it along
with a notification to a data center. Subsequently, the
data about the recurring event and the accelerometer
readings can be sent to mathematical models
(systems/algorithms) that can determine and evaluate
the impact on the vehicle, the type of impact, and
similar aspects (in the context of road irregularities).
This contextual accelerometer information would
thus serve as material for analyzing and processing
specific events.
Integrating all of this would contribute globally to
green transportation by reducing the number of
incidents caused by road defects.
ACKNOWLEDGEMENTS
An artificial intelligence model (OpenAI GPT-4o)
was employed to assist in the editing of this
manuscript. The model was utilized to refine the
linguistic style and ensure clarity, however, the
authors take full responsibility for the scientific
content of the article.
REFERENCES
Barlogis, R., Montarnal, A., Ouedraogo, C., & Gourc, D.
(2025). Predicting container intermodal transport arrival
times: An approach based on IoT data. Internet of Things,
29, 101460. https://doi.org/10.1016/J.IOT.2024.101460
Boyarchikov, Y., & Martinec, T. (2024). Road Pavement
Monitoring and Analysis Approaches Using Gyroscope
and Accelerometer Data. IFAC-PapersOnLine, 58(9),
138–142. https://doi.org/10.1016/J.IFACOL.2024.07.385
Chilamkuri, K., & Kone, V. (2020). Monitoring of varadhi
road bridge using accelerometer sensor. Materials
Today: Proceedings, 33, 367–371. https://doi.org/10.10
16/J.MATPR.2020.04.159
Deepa, D., & Sivasangari, A. (2023). An effective detection
and classification of road damages using hybrid deep
learning framework. Multimedia Tools and Applications,
82(12), 18151–18184. https://doi.org/10.1007/s11042-
022-14001-9
Fujino, Y., & Siringoringo, D. M. (2020). Recent research
and development programs for infrastructures
maintenance, renovation and management in Japan.
Structure and Infrastructure Engineering, 16(1), 3–25.
https://doi.org/10.1080/15732479.2019.1650077
Fujino, Y., Siringoringo, D. M., Ikeda, Y., Nagayama, T., &
Mizutani, T. (2019). Research and Implementations of
Structural Monitoring for Bridges and Buildings in
Japan. Engineering, 5(6), 1093–1119. https://doi.org/
10.1016/J.ENG.2019.09.006
Gupta, J., Gupta, N., Duggal, R., & Saxena, A. (2024). An
Introduction to IoT Based Sustainable Road Safety and
Underlying Sensor Technology. Encyclopedia of
Sustainable Technologies, 711–726. https://doi.org/
10.1016/B978-0-323-90386-8.00029-2
Krier, D., Zanardo, G. S., & Del Re, L. (2014). A PCA-based
Modeling Approach for Estimation of Road-tire Forces
by In-tire Accelerometers. IFAC Proceedings Volumes,
47(3), 12029–12034. https://doi.org/10.3182/20140824-
6-ZA-1003.02293
Mattes, P., Richter, R., & Döllner, J. (2023). Detecting Road
Damages in Mobile Mapping Point Clouds using
Competitive Reconstruction Networks. AGILE:
GIScience Series, 4, 1–13. https://doi.org/10.5194/agile-
giss-4-7-2023
Yang, X., Zhang, J., Liu, W., Jing, J., Zheng, H., & Xu, W.
(2024). Automation in road distress detection, diagnosis
and treatment. Journal of Road Engineering, 4(1), 1–26.
https://doi.org/10.1016/J.JRENG.2024.01.005
Yarmukhamedov, S., Smith, A. S. J., & Thiebaud, J. C.
(2020). Competitive tendering, ownership and cost
efficiency in road maintenance services in Sweden: A
panel data analysis. Transportation Research Part A:
Policy and Practice, 136, 194–204. https://doi.org/10.10
16/J.TRA.2020.03.004
Ye, Z., Wei, Y., Yang, S., Li, P., Yang, F., Yang, B., & Wang,
L. (2024). IoT-enhanced smart road infrastructure
systems for comprehensive real-time monitoring.
Internet of Things and Cyber-Physical Systems, 4, 235–
249. https://doi.org/10.1016/J.IOTCPS.2024.01.002
Evaluation of Detection Approaches for Road Anomalies Based on Accelerometer Data
595
