
Multimodal Pain Assessment Βased on Physiological Biosignals: The
Impact of Demographic Factors on Perception and Sensitivity
Elisavet Pavlidou
1,2 a
and Manolis Tsiknakis
1,2 b
1
Department of Electrical and Computer Engineering, Hellenic Mediterranean University,
Estavromenos, Heraklion, 71410, Greece
2
Computational BioMedicine Laboratory, Institute of Computer Science, Foundation for Research & Technology-Hellas,
Vassilika Vouton, Heraklion, 70013, Greece
Keywords: Multimodal Pain Assessment, Pain Classification, Physiological Signals, Machine Learning, BioVid, ECG,
GSR, EMG, Gender, Age.
Abstract: Pain is a multidimensional and highly personalized sensation that affects individuals’ physical and emotional
state. Visual analog scales, numeric rate indicators, and various questionnaires, all relying on patient-reported
outcome measurements, are considered the “gold” standard methods for assessing the severity of pain.
Nevertheless, self-report tools require cognitive, linguistic, and social abilities, which may manifest variations
in certain populations such as neonates, individuals with intellectual disabilities, and those affected by
dementia. The purpose of this study is to automate the process through multimodal physiological-data-driven
machine-learning models in order to gain deeper insights into pain sensation. We developed a pipeline using
electrocardiogram (ECG), galvanic skin response (GSR), and electromyogram (EMG), along with
demographic information from the BioVid dataset. The Pan & Tompkins algorithm was applied for ECG
signal processing, while statistical analysis was used for feature extraction across all signals. Our study
achieved 82.83% accuracy in the SVM classification task of baseline (BL) vs the highest level of pain (PA4)
for females aged 20-35.
1 INTRODUCTION
Pain is a multidimensional and subjective experience
that affects patients’ physical and psychological state
(Lopez-Martinez & Picard, 2018). According to the
International Association for the Study of Pain, is
defined as “the unpleasant sensory and emotional
experience associated with, or resembling that
associated with actual or potential tissue damage”
(Raja et al., 2020). Medical professionals, scientists,
and official organizations, including the World
Health Organization, have adopted this terminology.
The duration of pain consists of a broad range. For
instance, it may last from a few minutes to even years,
and its intensity varies. It is classified as acute or
chronic (Loeser & Melzack, 1999). The first one is
sudden, intense, and short-term, often caused by
wounds, injuries, or broken bones. In contrast to
acute, chronic pain is an ongoing situation, that lasts
more than three months and can cause distress (Fayaz
a
https://orcid.org/0000-0003-3744-9648
b
https://orcid.org/0000-0001-8454-1450
et al., 2016). This type of discomfort is categorized as
a disease and might be difficult to diagnose. It could
impact on physical status, psychological state, and
overall quality of life. These consequences also
impose a psycho-social burden on individuals, their
families, and society.
Pain consists of three aspects: the intensity, the
duration, and the distribution (Fayaz et al., 2016). The
first one is the level of pain, varying from minor to
unpleasant or severe. The second aspect concerns the
period that pain lasts and is defined as acute or
chronic, as previously explained. The distribution of
pain indicates exactly where the patient experiences
discomfort. In order to address and manage pain
appropriately, it is important to identify all of them.
The current clinical tools in order to estimate and
evaluate the level of pain depends on patient-reported
outcome measurements (Takai et al., 2015). The most
typical methods contain scales for patients to assess
the pain experience on a range of 0-10 or 0-100.
320
Pavlidou, E. and Tsiknakis, M.
Multimodal Pain Assessment Based on Physiological Biosignals: The Impact of Demographic Factors on Perception and Sensitivity.
DOI: 10.5220/0013426800003938
Paper published under CC license (CC BY-NC-ND 4.0)
In Proceedings of the 11th International Conference on Information and Communication Technologies for Ageing Well and e-Health (ICT4AWE 2025), pages 320-329
ISBN: 978-989-758-743-6; ISSN: 2184-4984
Proceedings Copyright © 2025 by SCITEPRESS – Science and Technology Publications, Lda.

However, these processes are time-consuming and
financially burdensome for healthcare facilities. Self-
reports also demand cognitive, linguistic, and social
abilities that may vary in children, and other
populations such as newborns, and individuals with
dementia (Susam et al., 2022).
There is growing evidence that the autonomic
nervous system (ANS), a part of the peripheral
nervous system, is interconnected with pain
perception (Hohenschurz-Schmidt et al., 2020).
Consequently, several studies have explored and
documented changes in the ANS that occur when
subjects are exposed to painful stimuli. The main role
of the ANS in the pain response is to point out
physiological biomarkers for investigation
(Fernandez Rojas et al., 2023). The pain process is
often initiated by unpleasant mechanical, heat, or cold
stimuli of an endogenous or exogenous origin,
activating the sensory neural pathway. As a result,
physiological biosignals typically stem from this
process, making them excellent choices for
automated pain recognition and assessment.
Accurate pain assessment remains one of the
strongest challenges in medical and research studies.
The objective of our study was to develop a
framework for automated pain recognition and
assessment using multimodal physiological
biosignals. We employed the BioVid dataset and
conducted unimodal and multimodal experiments in
order to compare the performance of each approach.
Finally, we explored the role of demographic
characteristics, such as gender and age, on pain
perception and sensitivity and their influence on the
experimental outcomes.
2 RELATED WORK
Most studies in pain research focus on biological
signals because of the difficulties in interpreting
imaging and audiovisual modalities, especially in
clinical settings where individuals may feel
uncomfortable about recording. As a result,
researchers have explored in depth the correlation
between pain and various physiological responses,
such as cardiovascular activity, muscle function,
electrodermal activity (EDA), brain function, and
respiratory rate. Indicate such studies and their results
are reported in what follows.
Walter et al. (2013) were the initial researchers to
employ the BioVid Heat Pain dataset. Lopez-
Martinez and Picard (2018) also used this dataset to
investigate personalized nociceptive pain
recognition. They extracted 17 time-domain features
from skin conductance (SC) and ECG they developed
logistic regression, support vector machines (SVMs)
with various kernels (Linear/RBF kernels), multitask
neural networks (MT-NN), and single-task neural
networks (ST-NN) with 10-fold cross-validation.
They reported that MT-NN performed better than
other approaches in the binary classification task of
baseline (BL) versus pain level 4 (PA4).
Additional integrations of similar signals have
been recognized in the scientific community. Thiam
et al. (2019) developed a 2D model using these
modalities. They used early fusion and delivered it
into a 9-layer 2D convolution neural network (CNN).
They reported a strong association between EDA and
pain severity. The interesting observation was that the
multimodal approach did not result in higher scores
than EDA alone. In their following study, they
suggested a multimodal data fusion approach for
binary classification using biosignals from the same
dataset, relying on deep denoising convolutional
autoencoders (DDCA). Subramaniam and Dass
(2021) explored ECG and GSR modalities from the
BioVid and created a hybrid deep learning (DL)
network. They implemented CNN to extract pain
information from physiological signals and an LSTM
network for feature concatenation to map nociceptive
pain from input data to detection. They reported that
GSR provided the highest performance in unimodal
experiments, achieving 85.66% between the BL vs
PA1 task. The multimodal approach increased their
results by reporting 94.12% in the same classification
task.
There is a critical need for a precise and reliable
method of assessing acute discomfort and level of
pain, especially in postoperative patients or
hospitalized individuals. This entails continuous
monitoring of various biological indicators. Chu et al.
(2017) employed linear discriminant analysis, k-
nearest neighbors (k-nn), and SVMs in a dataset of
six subjects with no medical history. They
categorized patients’ pain into five different levels
using a multimodal approach that included ECG,
blood volume pulse, and GSR. According to their
results, SVMs performed better. Aqajari et al. (2021)
used the Empatica E4 wristband in order to collect
GSR data from 25 post-operative patients. They
applied two machine-learning algorithms and used
four binary classification tasks to discriminate
between the BL and the four pain intensities. Despite
challenges in assessing actual clinical information,
their models outperformed the BioVid paper
approach for the first three pain models. In a different
study, Naeini et al. (2021) gathered a group of 25
postoperative patients aged between 18 and 65. They
Multimodal Pain Assessment Based on Physiological Biosignals: The Impact of Demographic Factors on Perception and Sensitivity
321

extracted 19 time-domain HRV features and devised
an automated framework to evaluate the subjects
pain. The highest accuracy was achieved using
SVMs, between the BL and pain level 2 (PA2).
Recent studies on automated pain estimation and
evaluation have focused on demographic factors and
how they could affect the level of pain discomfort.
This shift is driven by the realization that nociception
contains social aspects, underling the need to examine
pain from both physiological and psychosocial
perspectives (Bartley & Fillingim, 2013). In this
context, Gkikas et al. (2022) analyzed ECG and
employed SVMs to categorize pain intensity by
exploiting gender and age. Their study showed
substantial variations between genders. Especially in
higher intensities of pain, males reported less
sensitivity. In their subsequent work (Gkikas et al.,
2023), they suggested neural networks with single
task learning. For binary and multiclass tasks, they
reported accuracies of 71.67% and 31.53% in the
females and 71.33% and 29.73% for males in the 20-
35 age group.
3 METHODOLOGY
Given what was referred to previously, multimodal
approaches yielded better results. However, further
investigation of the dataset is still required. This study
explored all the available physiological biosignals in
the BioVid and combined demographic data in order
to draw conclusions regarding the influence of these
factors on pain perception and sensitivity.
This section presents a comprehensive overview
of the dataset, feature extraction, along with the
experimental pipeline.
3.1 BioVid Dataset
The BioVid Heat Pain Database (Walter et al., 2013)
incorporates physiological biosignals along with
frontal video material for detecting and classifying
heat-induced pain. The data collection process
involved 90 subjects, equally divided between the
ages of: 20-35, 36-50, and 51-65. In order to provoke
pain, a thermode, a device attached to the skin, was
used. The experiment was conducted in five phases,
during which four different temperature stimuli were
applied for 25 minutes. Each temperature setting
underwent 20 repetitions and lasted 4 seconds.
BioVid consists of five datasets, each one includes a
different variety of sources. We used the Part A
dataset, which encompasses physiological biosignals
such as ECG, GSR, and EMG (Trapezius muscle).
Part A is the most well-known and referenced dataset
in pain research. Before the experimental process,
each subject’s medical history was reviewed. The
exclusion criteria covered brain-related conditions,
long-lasting pain, heart-related conditions, and the
intake of painkillers right before the trial.
The initial sample size for the study was 90
subjects; however, three patients’ samples were
excluded due to technical troubles during data
collection, creating a dataset of 87 subjects. BioVid
includes pre-segmented intervals with duration of 5.5
seconds, and a 3-second delay. The intensities were
determined based on data collected at a baseline
temperature T
0
of 32
0
C. Each temperature was
applied 20 times, with 100 data samples per
participant, resulting in 8.700 samples used as input
in our experimental pipeline.
3.1.1 ECG Features
The first step involved implementing the Pan and
Tompkins algorithm (1985) in order to identify QRS
complex in the ECG signal.
The algorithm is structured into the following
phases: the preprocessing and the decision-making
phase. The first one involves noise cancellation,
signal filtering, and QRS’s complex amplitude and
slope improvement. The application of a band-pass
filter serves to mitigate the impact of noise. A filter
within the range of 5 to 15 Hz was achieved by
sequentially cascading the Low Pass Filter (LPF) and
High Pass Filter (HPF). The LPF was employed to
eliminate high-frequency noise components, such as
power line interference, and T-wave interference,
thus capturing the low-frequency signals. On the
other hand, the HPF was used to diminish low-
frequency noise, including baseline wander.
Following the application of the filtering process,
the signal is isolated, with a specific emphasis on
determining the slope characteristics of the optimal
QRS complex. During the differentiation stage, the
low-frequency P and T-waves were eliminated. As a
result, all the sample points become positive. The
final step is to apply the moving window integration
(MWI).
The peaks are located in the integrated signal to
identify a QRS complex. To decrease the chances of
choosing the wrong peak as a QRS complex, we
compare the peaks with a limit value. This limit value
changes automatically after identifying a new peak. If
the process fails to detect a QRS complex, an
additional search begins. In case no QRS is found in
a specific time, the half value of the limit is used in
order to detect the highest peak that falls within that
ICT4AWE 2025 - 11th International Conference on Information and Communication Technologies for Ageing Well and e-Health
322

time as possible QRS complex. Adaptive thresholds
improve the dependability of R peak identification.
The band-pass filter optimizes the waveform ratio for
low thresholds, with the higher of the two thresholds
in each set initially applied to the signal. In instances
where no QRS complex is identified within a
specified window, the lower threshold is applied, and
a search-back method begins to search for any missed
peaks.
After the application of the algorithm, we
extracted the following six (6) features:
• Mean of Inter-beat intervals (IBIs):
μ =
1
𝑁
(𝑅𝑅
− 𝑅𝑅
)
(1)
• The heart rate:
Heart Rate =
60 ∙ 𝐹𝑠
𝜇
(2)
• The root mean square of the successive
differences:
RMSSD =
1
𝑁−1
(RR
− RR
)
(3)
• The standard deviation of the NNs:
SDNN =
1
𝑛−1
(RR
− RR
)
(4)
• The slope of the linear regression:
A
A
= A
b
(5)
• Ratio of SDNN to RMSSD, which is a
metric of the heart’s rate acceleration:
RatioSR=
𝑆𝐷𝑁𝑁
𝑅𝑀𝑆𝑆𝐷
(6)
3.1.2 GSR Features
Through the statistical analysis, we calculated the
mean absolute value of first differences (MAVFD),
and he mean absolute value of second differences
(MAVSD) for both raw and standardized signals as
well as the above twelve (12) features:
• Maximum
• Standard Deviation
• Mean
• Root mean square
• Range
• Interquartile range
• MAVFD
1
𝑁−1
|𝑥
− 𝑥
|
(7)
• MAVSD
1
𝑁−2
|𝑥
− 𝑥
|
(8)
• MAVFD of the standardized signal
• MAVSD of the standardized signal
• Skewness
• Kurtosis
3.1.3 EMG Features
First, a Butterworth band-pass filter (20–250 Hz) is
used for the signal. Through the statistical analysis,
we extracted the following six (6) characteristics:
• Maximum
• Standard deviation
• MAVFD
• MAVSD
• MAVFD of the standardized signal
• MAVSD of the standardized signal
3.2 Classification Models
Handling missing values and noisy data was part of
the pre-processing step. Subsequently, we divided our
dataset into three groups: a) based on gender, b) based
on the age group, and c) based on both gender and
age. The next step was the feature extraction phase for
24 features. We developed SVMs with different
kernels (Linear/Gaussian/Polynomial) and LSTM
models aimed at detecting pain as well as assessing
the intensity of it using the leave-one-subject-out
(LOSO) cross validation method, ensuring unbiased
and robust results.
Multimodal Pain Assessment Based on Physiological Biosignals: The Impact of Demographic Factors on Perception and Sensitivity
323
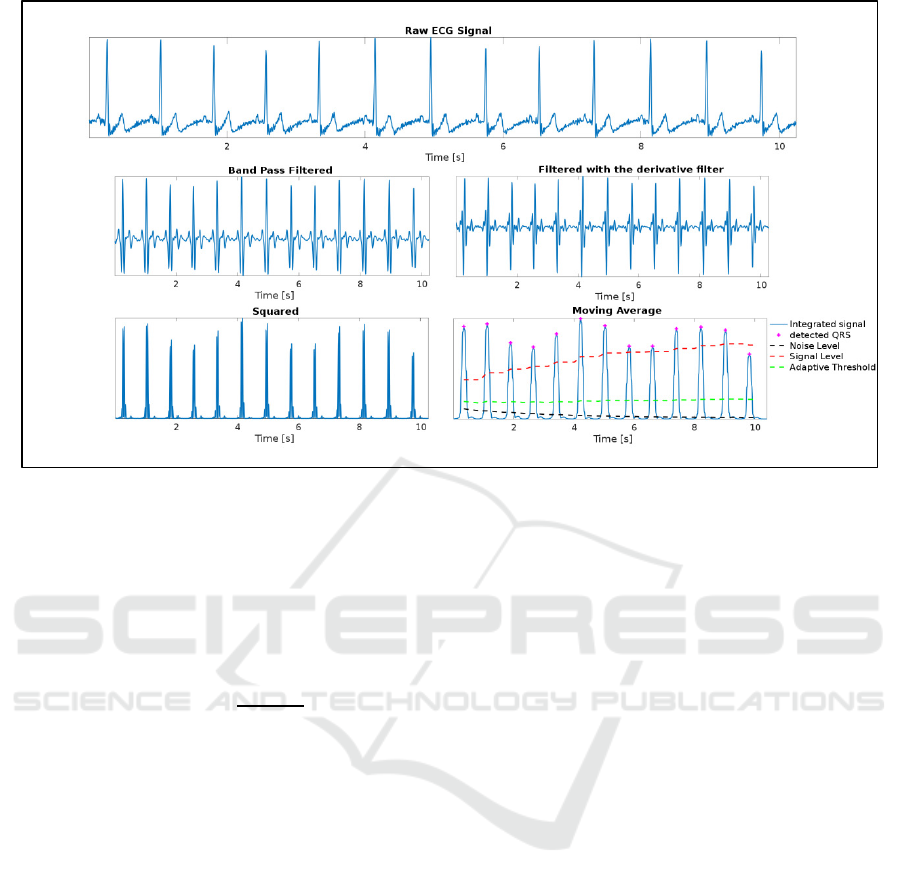
Figure 1: ECG signal preprocessing.
3.2.1 Support Vector Machines
We utilized the following various kernels for our ML
experimental process in order to compare them:
• SVM with Gaussian kernel:
K(𝑥
,𝑥
)=exp (−
|
|
)
(9)
• SVM with Linear kernel:
K(𝑥
,𝑥
)= 𝑥
𝑥
(10)
• SVM with Polynomial kernel:
K(𝑥
,𝑥
)= (𝑥
𝑥
+1)
(11)
3.2.2 LSTM Pipeline
The data was first converted into a three-dimensional
format that model could exploit. The target variable
was encoded with the label encoding in order to
conduct binary and multiclass experiments.
Preprocessing steps involve the reshaping of the input
data to incorporate temporal information from
previous time-steps, thus improving the model’s
capacity to recognize sequential patterns.
We developed stacked LSTMs for our
experimental process. The first layer consists of 5
units and uses the hyperbolic tangent (tanh) activation
function. The following 3-LSTM-layers consist of 64
units. These layers continue to process and analyze
the information, capturing more complex patterns.
The final layer has 5 units. We also included a dense
layer with 5 units for each of the five-categories
(multiclass classification). Each unit in the dense
layer represents a class. For the binary classification
tasks, we have one, producing a single probability
value.
The model’s ability to process sequential input is
its greatest advantage. Physiological signals related to
pain often present time-dependences, necessitating
the development of a model that can learn patterns as
they change. Finally, stacked LSTMs are flexible and
can handle variable-length sequences. Pain is a
personalized sensation, and the model’s capacity to
adjust to different signal lengths contributes to its
robustness.
4 RESULTS
The classification tasks were executed in multiclass
and binary approaches. We conducted five categories
of experiments, each with a distinct objective: 1)
Binary and multiclass experiments for all dataset in
both unimodal and multimodal tasks including BL, 2)
Binary and multiclass experiments between pain
levels categories in both unimodal and multimodal
tasks, 3) Binary and multiclass multimodal gender-
based classification tasks, dividing the dataset into
male and female groups, 4) Binary and multiclass
multimodal age-based classification tasks, based on
subjects’ ages: 20-35, 36-50, and 51-65, and 5)
ICT4AWE 2025 - 11th International Conference on Information and Communication Technologies for Ageing Well and e-Health
324
Binary and multiclass multimodal gender-age based
classification tasks. The results for each classification
task, along with the model used, are presented in
Tables 1-7.
Table 1: GSR accuracy for all dataset.
Si
g
nal Tas
k
SVM* LSTM
GSR
BL vs PA1 51.46% 52.01%
BL vs PA2 57.04% 55.60%
BL vs PA3 65.45% 65.34%
BL vs PA4 75.60% 76.86%
All Pain
Levels
×
35.77%
37.52%
*Polynomial Kernel
×
PA1 vs PA2 vs PA3 vs PA4
Table 2: ECG accuracy for all dataset.
Si
g
nal Task SVM* LSTM
ECG
BL vs PA1 51.86% 51.20%
BL vs PA2 52.84% 52.47%
BL vs PA3 55.14% 54.39%
BL vs PA4 58.39% 57.58%
All Pain
Levels
×
29.06% 28.87%
*Polynomial Kernel
×
PA1 vs PA2 vs PA3 vs PA4
Table 3: EMG accuracy for all dataset.
Si
g
nal Tas
k
SVM* LSTM
EMG
BL vs PA1 49.91% 50%
BL vs PA2 52.67% 53.70%
BL vs PA3 53.67% 53.85%
BL vs PA4 55.37% 56.83%
All Pain
Levels
×
27.38%
28.49%
*Polynomial Kernel
×
PA1 vs PA2 vs PA3 vs PA4
In unimodal experiments has been noted that GSR
demonstrates superior performance compared to
ECG and EMG as shown in Tables 1-3. Specifically,
the highest accuracy percentages in binary
experiments were observed between BL versus
higher-intensity conditions (PA4). In machine
learning experiments, GSR achieved 75.60% and
35.77%, in binary and multiclass tasks respectively,
while in LSTM experiments, achieved a mean
accuracy of 76.86% and 37.52%.
Multimodal approaches outperform unimodal
methods, in both binary and multiclass experiments.
The combination of biosignals led to a slight
improvement in accuracy performance compared to a
single modality. Experiments with SVM models
reported better results with the polynomial kernel in
all classification tasks, binary and multiclass.
Table 4: Multimodal accuracy for all dataset.
Si
g
nal Tas
k
SVM* LSTM
All
BL vs PA1 52.38% 51.40%
BL vs PA2 58.47% 56.81%
BL vs PA3 65.97% 63.13%
BL vs PA4 76.69% 77.21%
All Pain
Levels
×
37.09% 37.74%
*Polynomial Kernel
×
PA1 vs PA2 vs PA3 vs PA4
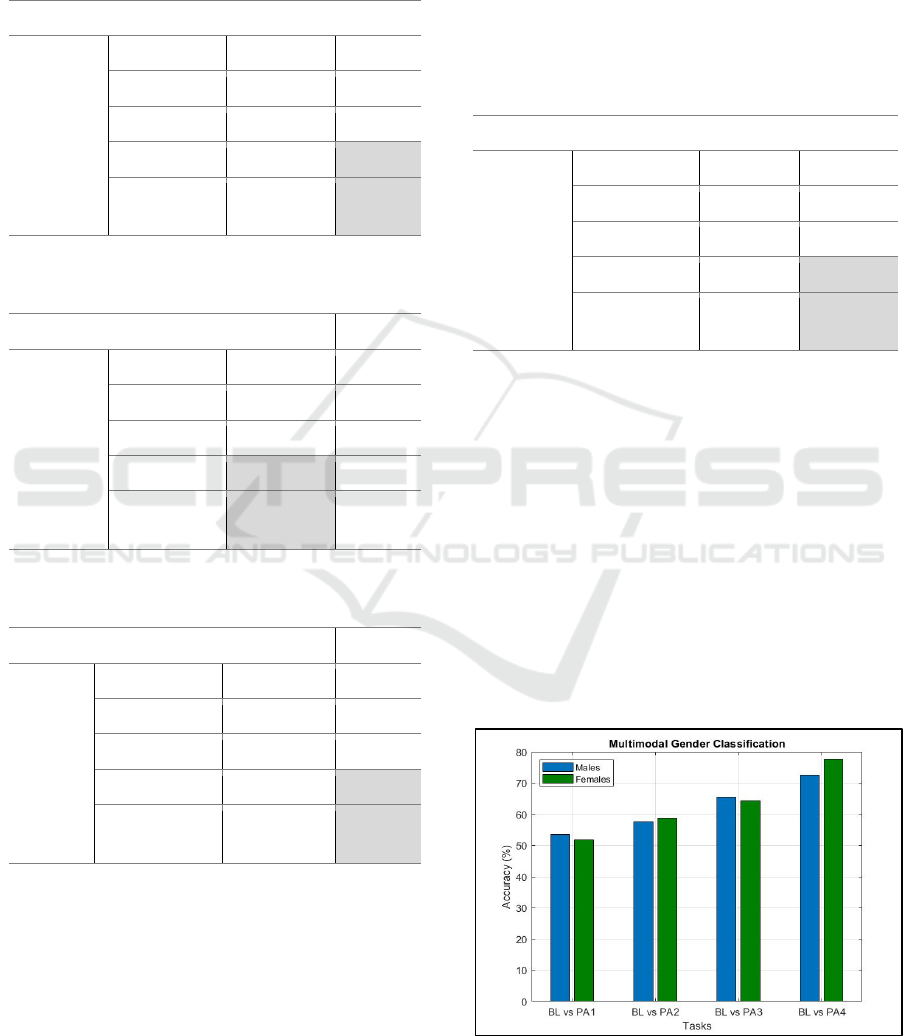
In addition, we explored demographics
emphasizing whether gender affects pain
classification outcomes. We noticed that males were
less sensitive to higher intensities than females. For
instance, in experiments between no-pain conditions
versus the highest level of pain (PA4), female
subjects presented an accuracy rate of 77.61% in
SVM and a mean accuracy of 79.88% in LSTM
models, which were higher than the 72.61% and
70.85% recorded for male subjects, respectively. The
divergence in classification results between genders
was even more pronounced at lower pain intensities,
with women consistently achieving higher accuracy
rates than men.
Figure 2: Multimodal gender classification.
Multimodal Pain Assessment Based on Physiological Biosignals: The Impact of Demographic Factors on Perception and Sensitivity
325
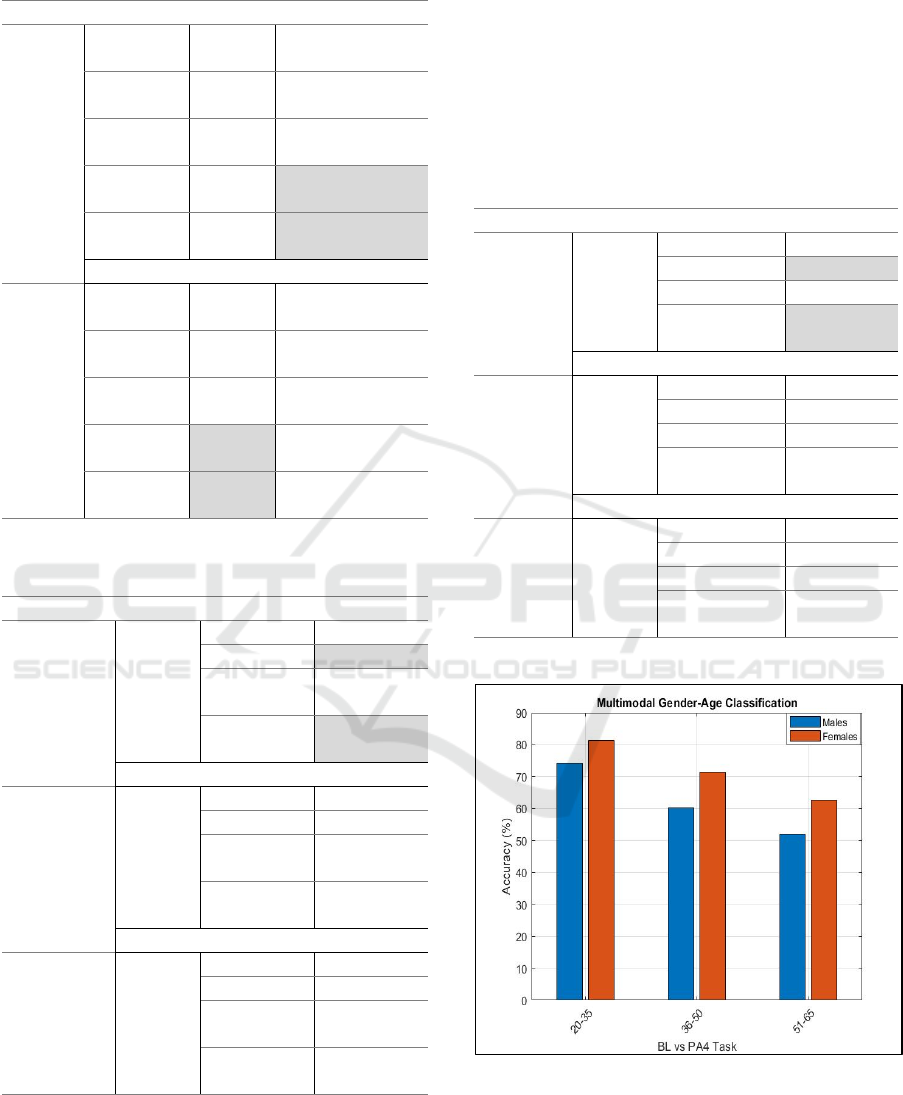
Table 5: Multimodal gender-based classification.
Group Tas
k
SVM* LSTM
Females
BL vs
PA1
51.86% 50.41%
BL vs
PA2
58.83% 58.37%
BL vs
PA3
64.47% 63.95%
BL vs
PA4
77.61%
79.88%
All Pain
Levels
×
38.45%
38.74%
Males
BL vs
PA1
53.63% 52.10%
BL vs
PA2
57.67% 56.70%
BL vs
PA3
65.51% 63.69%
BL vs
PA4
72.61% 70.85%
All Pain
Levels
×
33.86% 33.49%
*Polynomial Kernel
×
BL vs PA1 vs PA2 vs PA3 vs PA4
Table 6: Multimodal female-age-based classification.
Group Si
g
nal Tas
k
SVM*
Females
20-35
ECG
GSR
EMG
BL vs PA1 54.50%
BL vs PA4 82.83%
PA1 vs
PA4
81.33%
All Pain
Levels
˚
33.46%
Females
36-50
ECG
GSR
EMG
BL vs PA1 51%
BL vs PA4 75.83%
PA1 vs
PA4
71.33%
All Pain
Levels
×
27.53%
Females 51-65
ECG
GSR
EMG
BL vs PA1 51.15%
BL vs PA4 60%
PA1 vs
PA4
62.50%
All Pain
Levels
×
23.66%
*Polynomial Kernel
×
BL vs PA1 vs PA2 vs PA3 vs PA4
All models exhibited better performance between BL
and the highest pain intensity task, in unimodal and
multimodal tasks. As the deviation among category
pain levels increases, we noticed high accuracy in
binary tasks. Classifications between the lowest pain
intensities versus the BL (PA1 vs BL) do not present
noticeable differences, thereby complicating the
model’s ability to differentiate the classes. In contrast,
the performance of models between the highest and
the lowest level of pain or the BL (P4 vs PA1 or PA4
vs BL), was higher due to the distinctiveness of the
categories as presented in Table 7.
Table 7: Multimodal male-age-based classification.
Group Si
g
nal Tas
k
SVM*
Males
20-35
ECG
GSR
EMG
BL vs PA1 53%
BL vs PA4 80.16%
PA1 vs PA4 74.16%
All Pain
Levels
×
30.86%
Males
36-50
ECG
GSR
EMG
BL vs PA1 51.78%
BL vs PA4 63.35%
PA1 vs PA4 60.17%
All Pain
Levels
×
23.71%
Males
51-65
ECG
GSR
EMG
BL vs PA1 51.33%
BL vs PA4 55.83%
PA1 vs PA4 52%
All Pain
Levels
×
23.66%
*Polynomial Kernel
×
BL vs PA1 vs PA2 vs PA3 vs PA4
Figure 3: Multimodal gender-age classification.
Regarding the age factor, notable variations were
detected indicating that sensitivity to pain decreases
with age for both males and females. Gender
ICT4AWE 2025 - 11th International Conference on Information and Communication Technologies for Ageing Well and e-Health
326

differences in pain classification were particularly
evident among younger individuals. According to our
outcomes young women (20-35 years old) have
significantly lower thresholds on pain
compared to
men in the same age group. However, as is shown in
Figure 3, these gender-age differences became less
statistically insignificant as age increases. This is an
essential observation, considering that older
individuals may not experience pain as younger ones
and eventually this can contribute to the development
of chronic pain over time.
The conducted experiments
presented variability between genders, with males
demonstrating reduced sensitivity, in cases of higher
pain intensities as shown in Table 5. This
phenomenon warrants further investigation, as it
presents an area of concern that requires closer
attention.
Table 8: Comparison accuracy of across studies utilizing
BioVid dataset, biosignals, demographic data.
Authors Si
g
nal BL vs PA4*
Lopez-Martinez
& Picard (2018)
•
ECG, SC 82.75%
Subramanian et
al. (2021)
ECG 81.71%
Subramanian et
al. (2021)
EDA 76.79%
Gkikas et al.
(2022)
ECG 63.83%
Gkikas et al.
(2023)
ECG 71.67%
Ours
ECG
GSR, EMG
82.83%
*Higher performance in the multimodal gender-age-based
task between BL and PA4
•
Validation method: 10-fold-
cross-validation.
Although BioVid has been extensively employed
as an input in several studies over the years, deeper
investigation into gender and age is warranted. Table
8 illustrates the studies, as referred in section 2,
utilizing the same dataset, focused on physiological
signals and demographic factors, and highlights the
best classification performance between the baseline
and the very intense pain level. In the majority, they
explored one physiological modality with the
integration of demographics and achieved interesting
outcomes with ML and DL techniques. In this
context, we aimed to address a gap in leveraging all
the available biosignal source channels. Our study
emphasizes the introduction of demographics as
influencing variables in the multimodal
physiological-data-driven ML models and their
potential impact on experimental outcomes. Finally,
we applied the LOSO cross validation method,
commonly employed in previous studies for
comparison, and achieved the highest accuracy of
82.83% in the classification task of BL versus PA4
for the female group aged 20-35.
5 CONCLUSIONS
Accurate pain assessment and effective pain
management are fundamental for public health. The
present study focused on the development of ML
models for automated pain recognition and
assessment using multimodal physiological data. We
exploited demographic information of the BioVid
dataset, such as gender and age, to capture possible
alterations in pain sensitivity and result variations.
The experimental pipeline was divided into two
classification tasks: the recognition of pain and the
categorization of its intensity.
To gain a deeper insight into the correlation
between pain and demographics, we made some
observations regarding each classification task
outcome. The conducted experiments revealed
significant disparities between genders, with the male
population tending to report lower accuracy
compared to women. This could suggest that the
physiological signals captured by men were less
distinct, potentially due to gender differences in pain
perception, sensitivity, and the great impact on how
we respond to pain (Keogh & Boerner, 2024).
Moreover, in classification tasks where pain levels
was very intense, younger participants surpassed the
oldest age group (51-65 years old) and the middle-
aged group (35-50 years old). More precisely, young
women achieved an accuracy improvement of 7% and
22%, while men reported 17% and 25%, respectively.
These findings suggest that demographics, among
other factors such as psychological and socio-
contextual variables, play a pivotal role in pain
sensation and in capturing biomarkers across
different populations. Finally, based on what we
presented in unimodal experiments in Tables 1-3 and
the research stated, we infer that the physiological
signal that contributes most to pain research is the
GSR.
In conclusion, the results are promising, but we
are aware that additional investigations are required
to resolve several challenges. The novelty of our
approach lies in the integration of all three
information sources from the dataset, emphasizing
the influence of demographic factors, making our
outcomes noteworthy. The association between pain
Multimodal Pain Assessment Based on Physiological Biosignals: The Impact of Demographic Factors on Perception and Sensitivity
327

sensation, physiological signals and demographics is
challenging and has not yet been widely integrated in
biomedical research; however, it holds potential for
future research findings. Finally, we aspire that the
results stemming from this current work will further
contribute to research in pain estimation and assist in
extracting valuable and efficient information for
personalized pain management strategies.
5.1 Study Limitations
The findings of this work are encouraging but also
reveal several limitations that need to be considered
for future research efforts. BioVid, a well-known and
widely used pain dataset, lacks external factors such
as individual emotional states. Confounding factors
such as emotional state could influence further pain
perception and sensitivity.
This study focuses on physiological biosignals,
excluding image and audio modalities. Our outcomes
showed that EMG did not yield high performance
rates. Therefore, different physiological signals, such
as EEG, may enhance multimodal fusion and provide
further insights into our research. Finally, it is
essential to point out that our work centers on acute
thermal pain in a laboratory research setting. The lack
of further research into long-lasting pain conditions
(e.g. cancer patients, low back pain) is due to the
unavailability of public datasets in the pain research
domain.
ACKNOWLEDGMENT
The study was supported through the EU4Health
project ALTHEA (Grant agreement Number:
101161236).
REFERENCES
Aqajari, S. A. H., Cao, R., Naeini, E. K., Calderon, M. D.,
Zheng, K., Dutt, N., Liljeberg, P., Salanterä, S., Nelson,
A. M., & Rahmani, A. M. (2021). Pain assessment tool
with electrodermal activity for postoperative patients:
Method validation study. JMIR MHealth and UHealth,
9(5), 1–11.
Bartley, E. J., & Fillingim, R. B. (2013). Sex differences in
pain: A brief review of clinical and experimental
findings. British Journal of Anaesthesia, 111(1), 52–58.
Chu, Y., Zhao, X., Han, J., & Su, Y. (2017). Physiological
signal-based method for measurement of pain intensity.
Frontiers in Neuroscience, 11(MAY), 1–13.
Fayaz, A., Croft, P., Langford, R. M., Donaldson, L. J., &
Jones, G. T. (2016). Prevalence of chronic pain in the
UK: A systematic review and meta-analysis of
population studies. BMJ Open, 6(6).
Fernandez Rojas, R., Brown, N., Waddington, G., &
Goecke, R. (2023). A systematic review of
neurophysiological sensing for the assessment of acute
pain. Npj Digital Medicine, 6(1), 1–25.
Gkikas, S., Chatzaki, C., Pavlidou, E., Verigou, F.,
Kalkanis, K., & Tsiknakis, M. (2022). Automatic Pain
Intensity Estimation based on Electrocardiogram and
Demographic Factors. International Conference on
Information and Communication Technologies for
Ageing Well and E-Health, ICT4AWE - Proceedings,
January, 155–162.
Gkikas, S., Chatzaki, C., & Tsiknakis, M. (2023). Multi-
task Neural Networks for Pain Intensity Estimation
using Electrocardiogram and Demographic Factors
Multi-task Neural Networks for Pain Intensity
Estimation using Electrocardiogram and Demographic
Factors. July.
Hohenschurz-Schmidt, D. J., Calcagnini, G., Dipasquale,
O., Jackson, J. B., Medina, S., O’Daly, O.,
O’Muircheartaigh, J., de Lara Rubio, A., Williams, S.
C. R., McMahon, S. B., Makovac, E., & Howard, M. A.
(2020). Linking Pain Sensation to the Autonomic
Nervous System: The Role of the Anterior Cingulate
and Periaqueductal Gray Resting-State Networks.
Frontiers in Neuroscience, 14(February).
Keogh, E., & Boerner, K. E. (2024). Challenges with
embedding an integrated sex and gender perspective
into pain research: Recommendations and
opportunities. Brain, Behavior, and Immunity,
117(April 2023), 112–121.
Loeser, J. D., & Melzack, R. (1999). Pain: An overview.
Lancet, 353(9164), 1607–1609.
Lopez-Martinez, D., & Picard, R. (2018). Multi-task neural
networks for personalized pain recognition from
physiological signals. 2017 7th International
Conference on Affective Computing and Intelligent
Interaction Workshops and Demos, ACIIW 2017, 2018-
Janua, 181–184.
Naeini, E. K., Subramanian, A., Calderon, M. D., Zheng,
K., Dutt, N., Liljeberg, P., Salantera, S., Nelson, A. M.,
& Rahmani, A. M. (2021). Pain recognition with
electrocardiographic features in postoperative patients:
Method validation study. Journal of Medical Internet
Research, 23(5), 1–13.
Raja, S. N., Carr, D. B., Cohen, M., Finnerup, N. B., Flor,
H., Gibson, S., Keefe, F. J., Mogil, J. S., Ringkamp, M.,
Sluka, K. A., Song, X. J., Stevens, B., Sullivan, M. D.,
Tutelman, P. R., Ushida, T., & Vader, K. (2020). The
revised International Association for the Study of Pain
definition of pain: concepts, challenges, and
compromises. Pain, 161(9), 1976–1982.
Subramaniam, S. D., & Dass, B. (2021). Automated
Nociceptive Pain Assessment Using Physiological
Signals and a Hybrid Deep Learning Network. IEEE
Sensors Journal, 21(3), 3335–3343.
Susam, B., Riek, N., Akcakaya, M., Xu, X., De Sa, V.,
Nezamfar, H., Diaz, D., Craig, K., Goodwin, M., &
Huang, J. (2022). Automated Pain Assessment in
ICT4AWE 2025 - 11th International Conference on Information and Communication Technologies for Ageing Well and e-Health
328

Children Using Electrodermal Activity and Video Data
Fusion via Machine Learning. IEEE Transactions on
Biomedical Engineering, 69(1), 422–431.
Takai, Y., Yamamoto-Mitani, N., Abe, Y., & Suzuki, M.
(2015). Literature review of pain management for
people with chronic pain. Japan Journal of Nursing
Science, 12(3), 167–183.
Walter, S., Gruss, S., Ehleiter, H., Tan, J., Traue, H. C.,
Crawcour, S., Werner, P., Al-Hamadi, A., Andrade, A.
O., & Da Silva, G. M. (2013). The biovid heat pain
database: Data for the advancement and systematic
validation of an automated pain recognition. 2013 IEEE
International Conference on Cybernetics, CYBCONF
2013, January 2015, 128–131.
Multimodal Pain Assessment Based on Physiological Biosignals: The Impact of Demographic Factors on Perception and Sensitivity
329
