
Empowering Pharmaceutical Retail Storefronts: An Exploratory Study
on Classification and Association Techniques
Humberto Tozetti Carlos
1 a
, Luciana Lee
2 b
and Mateus Barcellos Costa
1 c
1
Postgraduate Program in Applied Computing (PPComp),
Instituto Federal do Esp
´
ırito Santo, Serra, Brazil
2
CEUNES - Universidade Federal do Esp
´
ırito Santo, S
˜
ao Mateus, Brazil
Keywords:
Recommendation Systems, Association Rules, Classification Algorithms, Retail Analytics.
Abstract:
This work presents a study of association and classification algorithms to support sales in retail stores through
recommendation systems. The study aimed to evaluate these algorithms in terms of their ability to provide
contextual information relevant to sales in retail storefronts. To achieve this goal, two primary objectives
were defined. The first was to explore methods for relating sales items. For this approach, experiments
were conducted using association rule and clustering algorithms. The second objective was to evaluate the
capability of classification algorithms to identify classes of interest present within the data universe. The
experiments utilized a dataset from the pharmaceutical sector. In the case of association rule algorithms,
given the absence of data to enable recommendations based on collaborative filtering, the purpose was to
identify patterns of item associations derived from customer shopping basket data. For the classification
algorithms, the goal was to identify sales with and without medical prescriptions, a fundamental aspect to
monitor consumer behavior regarding the use of drugs. For identifying sales with medical prescriptions, the
MultiLayer Perceptron algorithm achieved the best results. For predicting items based on the shopping basket,
the best results were obtained by combined use of the K-Means, K-Prototype, and FP-Growth algorithms.
1 INTRODUCTION
Even after the normalization of the post-Covid-19
pandemic scenario, physical retail stores, as well as
various virtual commerce models that offer direct cus-
tomer service, face challenges with their frontline
staff, e.g., monotony, insufficient incentives, and in-
adequate training, leading to disengagement and high
turnover rates (Ahmed et al., 2024).
In order to mitigate frontline retail staff hindrances
to dealing with product information, many retail sec-
tors seek support from recommendation systems with
functions such as the suggestion of items based on a
customer’s purchase history or according to the user’s
profile. For the frontline retail staff, however, contex-
tual knowledge is crucial for current purchase (Mo-
hamed et al., 2019; Knyazev and Oosterhuis, 2023).
In this context, this article examines item asso-
ciation algorithms, which focus on generating rec-
ommendations for complementary items in a sale, as
a
https://orcid.org/0009-0009-2052-4083
b
https://orcid.org/0000-0003-1335-074X
c
https://orcid.org/0000-0002-4235-5411
well as classification algorithms designed to identify
sales based on relevant classes within the applica-
tion scenario. However, our focus is on strengthen-
ing the salesperson, pharmacist in the case of drug-
stores, with tools to support decision-making. In the
case of medicines, in addition to mitigating risks, as
it directly involves the consumer’s health, using tools
such as recommendation systems can empower an in-
experienced seller to provide better service.
Both approaches investigated were based on the
analysis of similarity between individual sales and
their items through the evaluation of sale receipts,
along with supplementary data such as the Hu-
man Development Index (HDI) of the store’s loca-
tion and the time of day during which the sale oc-
curred. The study considered the MultiLayer Per-
ceptron classifier with Deep-Learned Embeddings to
predict whether a sale involves a medical prescrip-
tion and the FP-Growth algorithm for product-based
recommendations. The algorithms were implemented
and validated using a dataset from the pharmaceutical
sector, encompassing four geographically dispersed
units within a single metropolitan region in Brazil.
326
Carlos, H. T., Lee, L. and Costa, M. B.
Empowering Pharmaceutical Retail Storefronts: An Exploratory Study on Classification and Association Techniques.
DOI: 10.5220/0013429000003929
In Proceedings of the 27th International Conference on Enterprise Information Systems (ICEIS 2025) - Volume 1, pages 326-334
ISBN: 978-989-758-749-8; ISSN: 2184-4992
Copyright © 2025 by Paper published under CC license (CC BY-NC-ND 4.0)

The results demonstrate that the proposed algorithms
achieve high levels of accuracy, effectively associat-
ing sales items and providing reliable recommenda-
tions.
The remainder of this paper is organized as fol-
lows: Section 2 provides the conceptual background.
Section 3 outlines the experimental process and the
solutions considered for item association and classi-
fication. Section 4 presents and analyzes the exper-
imental results. Section 5 examines the findings in
the light of related work, and Section 6 concludes the
paper with suggestions for future research directions.
2 BACKGROUND
Recommendation systems to support sales in retail
environments aim to establish relationships between
individuals and products. This relationship building
process explores data sources, extracting meaningful
insights through approaches commonly referred to as
filtering. Four types of filtering are frequently em-
ployed: collaborative, content-based, demographic,
and hybrid filtering (Mohamed et al., 2019).
Various methods and different information
sources can support filtering. In virtual buying and
selling environments, where information is abundant,
recommendations for a buyer are typically based on
previous evaluations of their purchasing activities,
either through their preference history or by analyz-
ing similar purchases. Recommendations in such
contexts are generally constructed based on three
mechanisms: cross-selling, direct recommendations,
and gift centers (Lakshmi and Lakshmi, 2014).
In physical retail sales, the amount of informa-
tion, usually available in virtual environments, is of-
ten absent. Recommendations can therefore lead to a
scarcity of data directly related to purchase choices.
Available data, such as sales receipts, may be highly
dispersed, requiring appropriate pre-processing. In
the pharmaceutical retail sector, direct recommenda-
tions are particularly notable, often bypassing filter-
ing methods due to the lack of evaluative data about
purchases.
By leveraging sales receipts as a source of filter-
ing information, such methods can be adapted and
employed. This approach is commonly referred to
as Market Basket Analysis (MBA). MBA employs
data mining techniques to identify relationships be-
tween products frequently purchased together. This
technique proves highly useful in scenarios without
customer data, such as a first-time purchase or the ab-
sence of purchase records. To generate and identify
these relationships, MBA uses algorithms that pro-
duce association rules, incorporating metrics such as
conviction and confidence to establish relationships
between products (
¨
Unvan, 2021).
2.1 Association Rule Algorithms
Association rule algorithms aim at identifying rela-
tionships between items in a dataset, revealing co-
occurrence trends among products even without ex-
plicit correlations (Patil et al., 2014).
The common notation to represent association
rules is (A ⇒ B),where A is the antecedent, i.e., the
item or event that precedes, and B is the consequent,
i.e., the item or event that is likely to occur in the pres-
ence of A.
To evaluate the strength of an association, three
commonly used metrics are support, confidence and
lift (Yazgana and Kusakci, 2016; Sagin and Ayvaz,
2018):
• Support: measures the proportion of transactions
containing both A and B.
• Confidence: evaluates the probability of B be-
ing purchased given that A has already been pur-
chased.
• Lift: This measure evaluates the correlation be-
tween two items, A and B. A value below 1 in-
dicates a negative correlation, implying that the
presence of the first item suggests the absence of
the second. Conversely, a value greater than 1 sig-
nifies a positive correlation, meaning that the oc-
currence of one item suggests the occurrence of
the other.
The FP-Growth algorithm is an efficient alterna-
tive, particularly for large datasets, to generate associ-
ation rules. The algorithm operates in two main steps:
First, it constructs an FP-Tree by filtering out infre-
quent items based on a minimum support threshold
and organizing the remaining items in descending or-
der of frequency, optimizing storage by sharing com-
mon paths. Then, it mines the FP-Tree by generating
conditional FP-Trees from the least frequent nodes to
efficiently extract frequent patterns.
2.2 Classification
Classification algorithms have broad applicability,
widely used in pattern recognition and prediction
tasks. In the context of retail storefronts, which served
as the environment for this study, classifiers were em-
ployed to enable the qualified use of available sales
data. In this sense, they were utilized as an analytical
method to provide deeper insights into sales patterns
and behaviors.
Empowering Pharmaceutical Retail Storefronts: An Exploratory Study on Classification and Association Techniques
327

According to (Dahouda and Joe, 2021), key met-
rics for evaluating classification algorithms include:
• Accuracy: The proportion of correct predictions
out of the total predictions made. While intuitive,
it may produce misleading results in imbalanced
datasets.
• Precision: The proportion of true positives results
out of all positives predicted by the classifier, re-
flecting its ability to avoid false positives.
• Recall: The proportion of true positives out of all
actual positives samples, assessing the classifier’s
ability to identify true positives.
• F1-Score: A harmonic mean of precision and re-
call, providing a balanced measure of these met-
rics.
An MultiLayer Perceptron (MLP), in addition to
being a supervised classification method, is a type
of artificial neural network inspired by the function-
ing of biological neurons (Murtagh, 1991; Savalia and
Emamian, 2018). It consists of interconnected layers,
organized into three or more levels:
• Input Layer: Receives input data, where each
neuron represents a feature in the dataset (Yaacob
et al., 2013).
• Hidden Layer(s): Comprises one or more levels
of neurons that process information from the input
layer. The number of hidden layers and neurons
are configurable parameters (Yaacob et al., 2013).
• Output Layer: Outputs the results of the model,
with each neuron representing a predicted class
(Savalia and Emamian, 2018).
To introduce non-linearity into the model, MLP
uses an activation function that applies a weighted
sum of the inputs for each neuron (Murtagh, 1991;
Yaacob et al., 2013). Learning is typically achieved
using the backpropagation algorithm to update con-
nection weights during training, minimizing predic-
tion errors (Murtagh, 1991).
Categorical data, such as demographic attributes,
are challenging for machine learning algorithms due
to their lack of numerical values. MLP facilitates the
handling of categorical data by using techniques like
Deep-Learned Embeddings, which convert such data
into vector representations suitable for the algorithm.
2.3 Clustering
Clustering is an unsupervised machine learning tech-
nique, meaning it does not rely on predefined labels
to identify groups (B
´
ejar Alonso, 2013).
Clustering can be applied to a wide variety of ap-
plications. In the context of retail, it is particularly rel-
evant for customer segmentation, allowing customers
to be grouped based on their purchasing behavior
(Jridi et al., 2020). It can also be applied to sales
data to group transactions according to the items in
the shopping cart.
There are several algorithms for clustering, in-
cluding:
• K-Means: This algorithm groups data by initializ-
ing k centroids randomly and uses Euclidean dis-
tance to assign points to the nearest centroid. The
centroids are updated iteratively as the mean of
the points in each group, continuing until they no
longer change (Kuzelewska, 2014). It is simple
and efficient for numerical data.
• K-Prototype: An extension of K-Means, it han-
dles mixed data types (numerical and categor-
ical). It combines distance measures for each
type: Euclidean distance for numerical and 0 for
equal, 1 for different values for categorical at-
tributes. Centroids are updated with the mean for
numerical and the most frequent value for categor-
ical attributes (Jridi et al., 2020; Haj et al., 2015;
B
´
ejar Alonso, 2013).
To optimize clustering, especially in selecting the
optimal number of clusters, the elbow method is fre-
quently employed. This technique plots the within-
cluster sum of squared errors (WSS) against the num-
ber of clusters. While WSS decreases as more clus-
ters are added, the improvement eventually plateaus,
creating an “elbow” in the graph that shows the ideal
number of clusters (Syakur et al., 2018).
3 EXPERIMENTS
This section illustrates the proposed experiments and
the database used.
3.1 Dataset
For the experiments, a real-world sales transaction
database was utilized, representing a network of phar-
macies geographically distributed across a large and
diverse metropolitan area in Brazil, with 282,513
sales, carried out in 2019, in 4 stores, with a total
of 2,546 unique products. The experimental dataset
comprises anonymized data from this database, free
of sensitive information and thoroughly cleaned. The
columns described in Table 1 are included.
In addition to Table 1 columns, the dataset also
includes one column for each item sold at least once.
ICEIS 2025 - 27th International Conference on Enterprise Information Systems
328
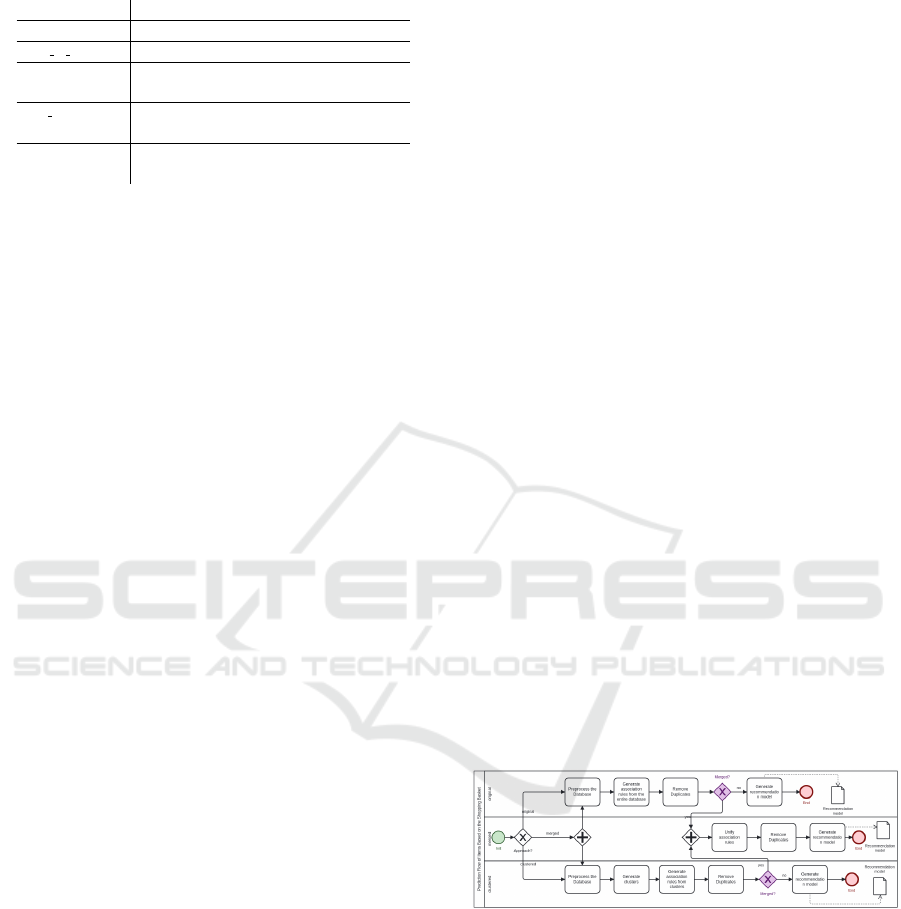
Table 1: Dataset Columns.
Column Description
quarter Identifies the sales quarter
day of week Identifies the day of the week
period Identifies the time shift (morning, afternoon,
or evening)
has prescription Indicates whether a medical prescription was
issued.
hdi Human Development Index (HDI) of the
stores location
These columns use binary values to indicate the pres-
ence of an item in a sale. Each row in the dataset cor-
responds to a transaction conducted within the phar-
macy network. The values for these columns are de-
fined as follows:
1. A value of 0 indicates that the item is not present
in the sale;
2. A value of 1 indicates that the item is present in
the sale.
3.2 Prediction of Items Based on the
Market Basket
To enhance product recommendations at retail store-
fronts and support decision-making, association rules
were applied. Their primary purpose was to uncover
correlations between products in transaction records.
In the experiment, the technique was specifically used
to develop a recommendation system that relies exclu-
sively on product transaction history, without requir-
ing customer-specific data.
To generate the association rules, the FP-Growth
algorithm was employed to create a model capable of
suggesting the next item for a customer’s cart based
on the current basket.
Given the variety of items that may be present in
sales, as well as the numerous combinations of these
items in each transaction, clustering techniques were
applied to group transactions with similar character-
istics into the same cluster. This facilitated the gener-
ation of association rules among the products.
Several libraries support clustering algorithms,
with the primary requirement being the definition of
the number of clusters to generate. To determine this
number, the elbow curve method was used. Based on
its results, clustering was performed to create five dis-
tinct groups. The elbow curve method graph was gen-
erated using the K-means clustering algorithm. This
choice was made due to the need to analyze the items
specifically—since they are the objects of associa-
tion—and because K-means is well-suited for numer-
ical data. However, for grouping transactions, the K-
Prototype algorithm was used to better handle the cat-
egorical data in the dataset. In the case of transaction
clustering, categorical data can help identify sales pat-
terns based on period, location, or even day of the
week. These measures were implemented to enhance
the richness and accuracy of transaction clusters.
Following this, the data were processed, as the as-
sociation rules required only item-level information
without necessarily considering attributes like HDI,
day of the week, or other details. While these at-
tributes were relevant initially for clustering, they
were not essential for generating the associations.
The FP-Growth algorithm was used to create the
association rules, as it is a strong alternative for han-
dling the cardinality and complexity of the dataset.
For generating associations, a confidence threshold of
30% was used as an input parameter. This algorithm
was implemented for both the clustered and original
datasets to maximize the potential relationships be-
tween items, thereby increasing the possibilities for
recommendations.
Given the number of association rules generated
using the original database, it was found that most of
the items did not have rules to present results in the
model. In order to achieve parity between the models,
the support value for generating the association rules
was reduced in order to obtain a sufficient quantity to
compare the results of the recommendation models.
Three recommendation models can be generated:
the first model is achieved from association rules de-
rived from the dataset without clustering . The sec-
ond, from association rules derived from the clustered
dataset. Finally, the third model is obtained from the
integration of both previous strategies. The Figure 1
illustrates the workflow of the model generation pro-
cess in terms of a BPMN diagram.
Figure 1: Association Experimentation flow.
3.3 Identification of Sales with Medical
Prescriptions
The MultiLayer Perceptron (MLP) classifier was used
in combination with Deep-Learned Embeddings in
order to address the problem of identifying medi-
cal prescriptions in sales. The objective was to cre-
ate a model capable of predicting, based on the in-
put shopping cart, whether the sale involves a medi-
cal prescription, even when a prescription is not pro-
Empowering Pharmaceutical Retail Storefronts: An Exploratory Study on Classification and Association Techniques
329

vided. The choice of MLP was motivated by its inte-
gration with Deep-Learned Embeddings, enabling the
use of categorical data present in the dataset to en-
hance the classification process. Moreover, the Mul-
tiLayer Perceptron has demonstrated its performance
when compared with statistical approaches, as pro-
posed by (Murtagh, 1991). This information is not
only valuable for understanding consumer behavior
regarding medications but can also be useful for fil-
tering items to recommend to the customer.
To enable the combined use of these algorithms,
initial preprocessing of the dataset was necessary.
This requirement stemmed from the presence of cat-
egorical data in the transaction records and an im-
balance in the has prescription class. Each sale
record included not only the products sold but also
data categorizing the day, time period, location, and
quarter in which the sales occurred. Incorporating
this information enhances the pattern recognition pro-
cess among transactions. To integrate these categor-
ical features into the classifier, a transformation was
performed using Deep-Learned Embeddings, with the
resulting embeddings serving as input for training the
classification model.
In addition to categorical data, it was necessary
to address the imbalance in the has prescription
class, as only approximately 11% of sales include a
registered medical prescription. Although this indi-
cates the presence of such records in the dataset, it
does not mean the sale was conducted with a prescrip-
tion, as the registration of this information is optional
in cases where the prescription is not mandatory. Im-
plementing the classifier and model with such a dis-
parity between classes would result in poor outcomes.
To mitigate this, the compute class weight function
from the Python sklearn library was employed. The
output of this function is used to create a dictionary,
which is further used by the fit function of the classi-
fier model.
For building the model, the MLP algorithm was
implemented using Python and the Keras library, as
its solution for the MultiLayer Perceptron works ide-
ally with the preprocessed categorical data. The in-
put parameters included a maximum of 50 epochs for
training, a split of 70% of the records for training and
30% for testing, and an early stopping mechanism to
accelerate model training when improvements cease.
Following this process, the classification results
were evaluated, achieving an accuracy of 97.97%.
With the classification process completed and
yielding favorable results, it was possible to develop
a prototype. This prototype receives data from a sale,
identifying the items present in a transaction and cal-
culates the likely class of the sale. Figure 2 illustrates
the flowchart of the described process.
Figure 2: Classification Experimentation Flow.
The experiments were conducted on a workstation
equipped with an Intel i7 11th generation processor,
32GB of RAM, and a GeForce RTX 3060 GPU with
6GB of memory. All algorithms were implemented
in Python using libraries such as NumPy, Pandas,
Scikit-Learn, Seaborn, Matplotlib, Pyarrow, Kmodes,
OS, Mlxtend, GC, TensorFlow, Random, and Yellow-
Brick.
4 ANALYSIS OF RESULTS
This section discusses the results of the algorithms
and solutions implemented in the experimental phase.
4.1 Prediction of Items Based on the
Market Basket
In order to validate the product recommendation
model, the ten most frequently sold items were se-
lected. For each item, sales transactions that included
the product and at least one additional item were fil-
tered. These transactions were used to assess recom-
mendations based on historical sales data. The model
also allows setting the number of items to recom-
mend. In this experiment, the top five recommenda-
tions were analyzed.
Three approaches were employed to rank the most
recommended items. The first approach measured the
correlation strength between items. The second ap-
proach relied on the confidence level of the associa-
tion. Finally, the third approach used rule support as
the ranking criterion.
In addition to ranking methods, three sources of
association rules were used to generate recommen-
dations. The first source derived rules directly from
the database without clustering. The second source
generated rules from five clusters created using the
K-Prototype algorithm. Finally, the third source com-
bined the rules from the previous two methods into a
unified set of association rules.
To evaluate the performance of the recommenda-
tion models, the fulfillment rate was employed. The
ICEIS 2025 - 27th International Conference on Enterprise Information Systems
330
following equation demonstrates its calculation.
Fulfillment Rate (%) =
N
r
N
t
(1)
Where:
• N
r
: Number of transactions containing recom-
mended items.
• N
t
: Total number of transactions.
The resulting fulfillment rates for each dataset are
presented in Tables 2, 3, and 4.
Table 2: Fulfillment rates by product based on orderings by
Confidence, Lift, and Support in the original dataset.
Product
Confidence Lift Support
(%) (%) (%)
Product 1 7.59 7.59 6.24
Product 2 31.28 31.28 42.73
Product 3 40.86 40.86 53.10
Product 4 15.24 15.24 7.58
Product 5 50.21 50.21 46.86
Product 6 22.43 22.43 54.51
Product 7 6.44 6.44 13.95
Product 8 6.37 6.37 6.12
Product 9 27.84 27.84 38.99
Product 10 14.83 14.83 30.73
Table 3: Fulfillment rates by product according to the
metrics of Confidence, Lift, and Support in the clustered
dataset.
Product
Confidence Lift Support
(%) (%) (%)
Product 1 6.09 7.59 5.13
Product 2 28.66 20.61 45.45
Product 3 50.19 40.82 53.10
Product 4 20.61 18.32 13.29
Product 5 42.54 38.42 47.42
Product 6 43.98 36.71 54.51
Product 7 13.08 13.08 7.68
Product 8 4.95 7.55 8.29
Product 9 18.51 23.13 40.76
Product 10 14.58 26.80 34.26
Table 4: Fulfillment rates by product according to the met-
rics of Confidence, Lift, and Support in the merged dataset.
Product
Confidence Lift Support
(%) (%) (%)
Product 1 9.94 7.59 6.74
Product 2 20.52 5.24 45.22
Product 3 50.19 40.82 53.10
Product 4 17.47 18.32 13.29
Product 5 39.17 38.42 47.42
Product 6 43.98 36.71 54.51
Product 7 6.09 6.09 7.68
Product 8 6.06 6.37 8.29
Product 9 27.11 19.05 40.76
Product 10 14.58 22.36 34.26
As can be observed, regardless of the source of the
rules, ordering by support consistently delivers better
results. This is evident when analyzing the number
of items with higher fulfillment rates when sorted by
Support across each dataset.
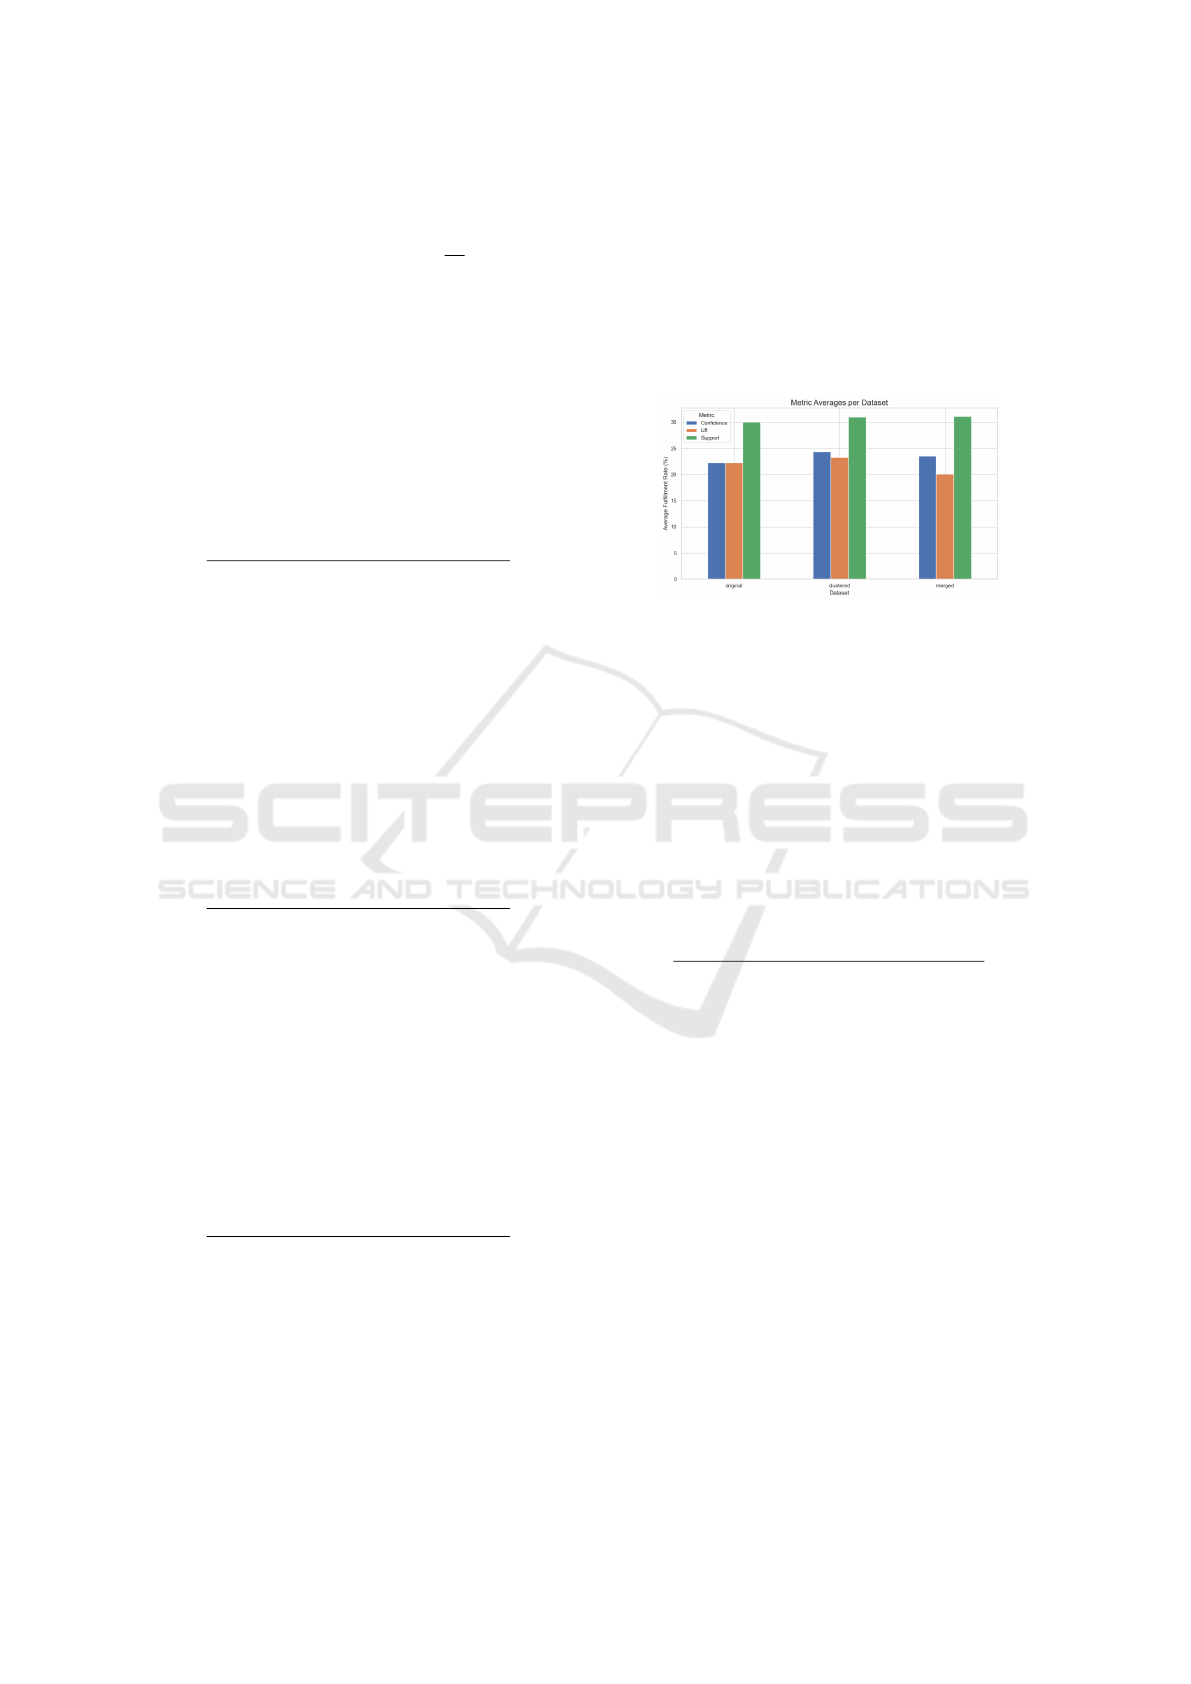
The support metric also exhibits a higher average
fulfillment rate by products across all datasets, as il-
lustrated in Figure 3.
Figure 3: Comparative graph of the average fulfillment rate
for each dataset, sorted by metric.
In addition to analyzing the sorting metric with
the best results, the relevance of each database was
assessed. This evaluation considered the highest-
ranking values from each source to generate associa-
tion rules for each product. Specifically, only the best
fulfillment rate per item was used for each ranking.
Table 5 presents the highest-ranking values from each
source and product.
Table 5: Highest Values Among Metrics by Database and
Product.
Product
Original Clustered Merged
(%) (%) (%)
Product 1 7.59 7.59 9.94
Product 2 42.73 45.45 45.22
Product 3 53.10 53.10 53.10
Product 4 15.24 20.61 18.32
Product 5 50.21 47.42 47.42
Product 6 54.51 54.51 54.51
Product 7 13.95 13.08 7.68
Product 8 6.37 8.29 8.29
Product 9 38.99 40.76 40.76
Product 10 30.73 34.26 34.26
By identifying the best fulfillment rates for each
item across databases, it is possible to determine, for
a given item, the scenarios in which each database
would deliver the best performance. For this analysis,
a database was counted as the best performer when-
ever its fulfillment rate was the highest among all
databases. Building on the results from Table 5, Table
6 was created to summarize the number of items for
which each database showed the greatest relevance.
It is worth noting that in cases like Product 3,
where all databases exhibit the same fulfillment rate,
Empowering Pharmaceutical Retail Storefronts: An Exploratory Study on Classification and Association Techniques
331
the best-performing status is attributed to each of
these databases. This approach ensures a comprehen-
sive view of which databases would most effectively
satisfy the majority of recommendations.
Table 6: Predominance Count by Database.
Dataset
Predominance
Count
Original 4
Clustered 7
Merged 6
Based on these findings, the clustered database
demonstrates the highest relevance, even outperform-
ing the merged strategy, which integrates rules from
both the clustered and original databases. This superi-
ority arises from the fact that, in percentage terms, the
clustered database delivers more satisfactory results
in most scenarios. Conversely, the original database
exhibits the weakest performance, showing low rele-
vance in the majority of cases. Thus, clustering tech-
niques have proven to be a valuable tool for uncover-
ing meaningful association rules, thereby contributing
to the development of more effective item recommen-
dation models.
4.2 Identification of Sales with Medical
Prescriptions
In addition to accuracy, precision, recall, and F1-score
metrics were used to assess the model’s performance.
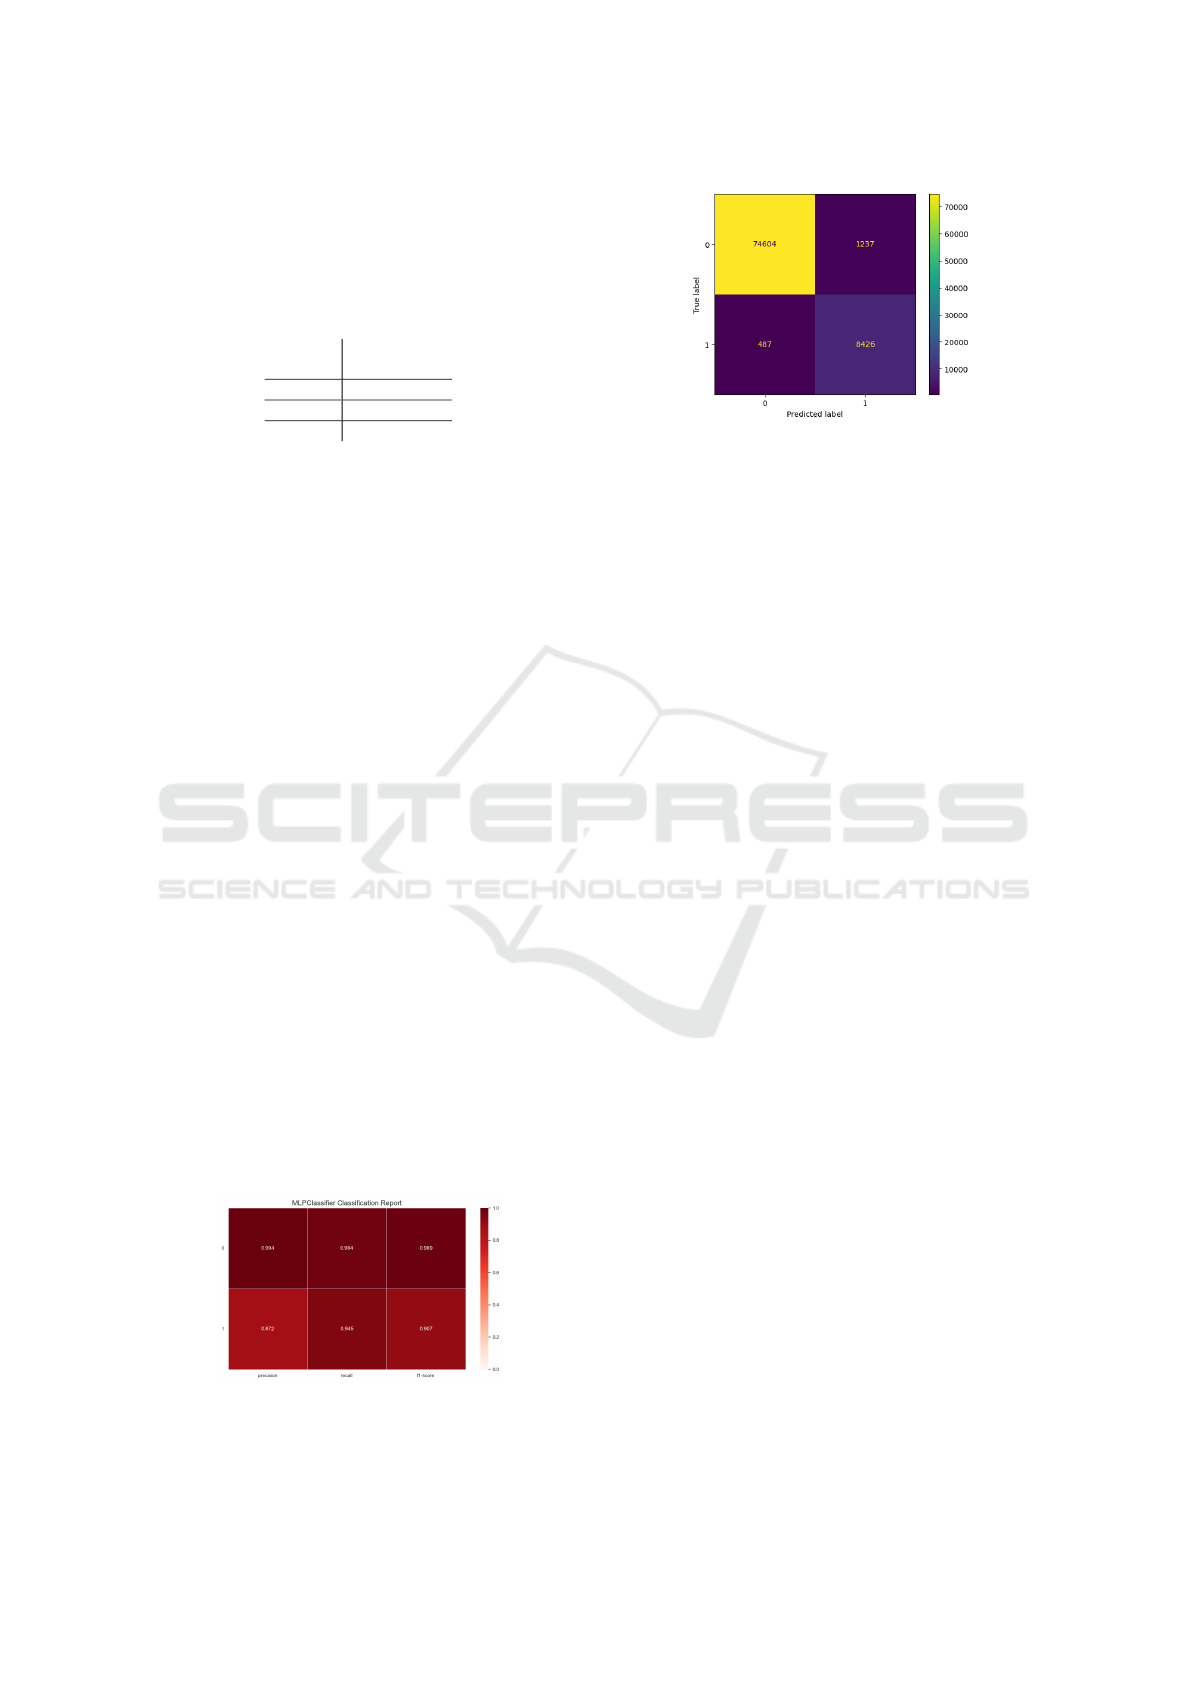
Figure 4 provides the report summarizing these three
metrics, while Figure 5 displays the confusion matrix
produced by the model.
The Classification Report highlights precision, re-
call, and F1-score, offering a detailed assessment of
the model’s performance. In this experiment, the
model showed stronger performance in classifying
class 0 but also achieved solid metrics for class 1,
which represents sales with reported revenue. Al-
though the false-positive rate was higher for class 1,
this outcome is expected, as many sales in this cate-
gory were not labeled at the retail storefront.
Figure 4: Classification metrics results.
The methodology for validating the generated
Figure 5: Confusion matrix generated by the model.
classification model consisted of two stages. In the
first stage, manual testing was conducted with ex-
pected results to verify whether the model performed
as anticipated. Upon obtaining positive outcomes, the
second stage was initiated, which focused on assess-
ing the model’s ability to generalize and classify sales
as medical prescription transactions.
In the manual testing stage, several sales trans-
actions excluded from the training and testing pro-
cesses were selected and manually input into the
model to observe the results. The primary objective
was to validate whether transactions involving prod-
ucts requiring mandatory prescription retention—i.e.,
those that cannot be sold without a prescription un-
der any circumstances—were correctly classified as
prescription-required. Additionally, the goal was to
verify if the model’s behavior in this controlled envi-
ronment aligned with its performance during training.
For transactions requiring mandatory prescrip-
tions, the model accurately identified all such cases
as prescription-required. For other transactions, the
model’s performance was consistent with its training
results, correctly classifying sales as either requiring
or not requiring a prescription.
A test was conducted with two specific products to
assess the model’s ability to classify transactions as
prescription-required, even when initially labeled as
non-prescription. These products, while not manda-
torily prescribed, are seldom sold without a doctor’s
recommendation due to their use in treating hyper-
tension and diabetes. In this test, 314 transactions
involving both items were analyzed, of which 243
lacked prescription records, accounting for approxi-
mately 77.4% of the sales.
Focusing on the 243 transactions without prescrip-
tion records, the model’s predictions were further ex-
amined. It determined that 184 of these transactions
should have included a prescription, accounting for
approximately 75.8% of the sales.
The model suggests that, instead of the observed
22% of transactions involving a prescription, the ac-
tual proportion is likely closer to 81%, offering a more
ICEIS 2025 - 27th International Conference on Enterprise Information Systems
332

precise representation of expected medication con-
sumption patterns.
5 RELATED WORK
Yoosofan et al. (2015), Kusumo et al. (2021) and
¨
Unvan (2021) have applied association rules in the
retail sector using the FP-Growth and A Priori algo-
rithms. These techniques aimed to support storefront
operations by organizing inventory and shelves and
associating items to design sales campaigns. Yooso-
fan et al. (2015) and Kusumo et al. (2021) applied
association rules to medication databases, neither de-
veloped recommendation systems. In contrast, Guru-
dath (2020) proposed a collaborative filtering-based
recommendation system that, in addition to utilizing
association rule algorithms, leverages item relation-
ship information through techniques such as market
basket analysis.
Lakshmi and Lakshmi (2014), Mohamed et al.
(2019) and Ricci et al. (2015) address challenges and
solutions in recommendation systems, outlining types
of filtering, application examples, and their limita-
tions. Mohamed et al. (2019) and Ricci et al. (2015)
discuss the relevance of these systems in enhancing
customer satisfaction and increasing revenue through
boosted sales. Additionally, Mohamed et al. (2019)
and Ricci et al. (2015) emphasize the importance of
techniques such as classification, clustering, and as-
sociation rules in the context of recommendation sys-
tems, which were fundamental to the work presented
in this study.
Nistal-Nuno (2022) discusses recommendation
systems for pharmaceutical e-commerce based on
Bayesian User Modeling to suggest items to cus-
tomers. The justification lies in providing conve-
nience for customers to find all necessary medications
on the website. The application was user-oriented
rather than product-oriented, employing clustering
techniques to group similar users. Notably, associ-
ation rule techniques were not applied. Conversely,
Tercan et al. (2021) implemented recommendation
systems using embedding techniques and product
similarity, in addition to artificial neural networks
trained with the user’s browsing history.
Murtagh (1991) examines the approach of the
Multilayer Perceptron algorithm, describing its con-
cepts, functionality, and applications in various fields,
while comparing its efficiency by referencing other
authors and studies.
In the work discussed by Dahouda and Joe (2021),
the use of Deep-Learned Embeddings is demon-
strated, comparing its efficiency to other techniques
for handling categorical data, such as the One-Hot En-
coding algorithm.
Potolea and Lemnaru (2011) address the effect of
imbalance classes and how they impacted the perfor-
mance of classifiers. According to the authors, the use
of balancing methods was crucial for developing the
proposed model. The authors also discuss the effect
of class imbalance and its impact on the performance
of classifiers. In our work, the use of balancing meth-
ods was also crucial to identify the presence of med-
ical prescriptions in medication sales, given the class
imbalance as discussed in Section 3.
6 CONCLUSION
This study explored the use of data mining and ma-
chine learning algorithms to support retail pharmacy
storefront operations. The primary objective was to
provide actionable insights to employees, particularly
customer service staff, by analyzing customers’ shop-
ping baskets. For instance, classifying a sale as orig-
inating from a medical prescription enables profes-
sionals to guide customers more confidently or follow
specific procedures as required.
The application of association rule techniques,
leveraging the FP-Growth algorithm supported by
clustering mechanisms, proved effective in develop-
ing a recommendation system, achieving an average
success rate of over 30% when recommending items
based on past transactions. Additionally, the use of a
MultiLayer Perceptron classifier in combination with
Deep-Learned Embeddings to label sales based on
their items yielded an accuracy of 97.97%.
Currently, the prediction model relies on associa-
tions between items already present in the database.
While this is feasible due to the database’s com-
prehensiveness, it may become a limitation as the
database evolves, with items being added or removed.
To address this, implementing fuzzy comparison tech-
niques—generating similarity scores for item descrip-
tions—could be a viable solution.
For further improving storefront support, accurate
and well-contextualized item predictions are critical.
Incorporating additional relevant information to en-
hance the model’s ability to suggest subsequent items
is key. A potential improvement to the proposed rec-
ommendation model involves integrating sales classi-
fication into the recommendation process. This would
allow for generating recommendations tailored to sce-
narios involving or not involving medical prescrip-
tions, better aligning item associations. The perfor-
mance of this enhanced model could then be com-
pared to the one presented in this study.
Empowering Pharmaceutical Retail Storefronts: An Exploratory Study on Classification and Association Techniques
333

ACKNOWLEDGEMENTS
We would like to thank the Graduate Program in Ap-
plied Computing at Ifes Serra (PPCOMP) and the
Capixaba Open University Program (UnAC) of the
Secretariat for Science, Technology, Innovation, and
Professional Education (SECTI) of the Government
of the State of Esp
´
ırito Santo, Brazil, for their support
in the development of this work. We also extend our
special thanks to the Esp
´
ırito Santo Research and In-
ovation Support Foundation (FAPES) for its financial
support of this study.
REFERENCES
Ahmed, M. N., Akaak, A. S., et al. (2024). Integrated role
of human resource management in mitigating the post-
covid-19 challenges in retail. Business Ethics and Lead-
ership, 8(1):1–14.
B
´
ejar Alonso, J. (2013). Strategies and algorithms for clus-
tering large datasets: a review.
Dahouda, M. K. and Joe, I. (2021). A deep-learned embed-
ding technique for categorical features encoding. IEEE
Access, 9:114381–114391.
Gurudath, S. (2020). Market basket analysis & recommen-
dation system using association rules. Master of Science
in Big Data Management and Analytics, Griffith College,
Dublin.
Haj, K. M. B., Essoussi, N., et al. (2015). “mapreduce-
based k-prototypes clustering method for big data. In
2015 IEEE International Conference on Data Science
and Advanced Analytics (DSAA). Paris: Campus des
Cordeliers.
Jridi, H., Ben HajKacem, M. A., and Essoussi, N. (2020).
Parallel k-prototypes clustering with high efficiency and
accuracy. In Big Data Analytics and Knowledge Dis-
covery: 22nd International Conference, DaWaK 2020,
Bratislava, Slovakia, September 14–17, 2020, Proceed-
ings 22, pages 380–395. Springer.
Knyazev, N. and Oosterhuis, H. (2023). A lightweight
method for modeling confidence in recommendations
with learned beta distributions. In Proceedings of the
17th ACM Conference on Recommender Systems, pages
306–317.
Kusumo, H., Marlina, D., Novita, M., and Anwar, M.
(2021). Analysis of transaction patterns at drug store
with apriori algorithm. In Journal of Physics: Confer-
ence Series, volume 1869, page 012070. IOP Publishing.
Kuzelewska, U. (2014). Clustering algorithms in hybrid
recommender system on movielens data. Studies in logic,
grammar and rhetoric, 37(1):125–139.
Lakshmi, S. S. and Lakshmi, T. A. (2014). Recommenda-
tion systems: Issues and challenges. International Jour-
nal of Computer Science and Information Technologies,
5(4):5771–5772.
Mohamed, M. H., Khafagy, M. H., and Ibrahim, M. H.
(2019). Recommender systems challenges and solutions
survey. In 2019 international conference on innovative
trends in computer engineering (ITCE), pages 149–155.
IEEE.
Murtagh, F. (1991). Multilayer perceptrons for classifica-
tion and regression. Neurocomputing, 2(5-6):183–197.
Nistal-Nuno, B. (2022). Medication recommendation sys-
tem for online pharmacy using an adaptive user interface.
Computer Methods and Programs in Biomedicine Up-
date, 2:100077.
Patil, P. H., Thube, S., Ratnaparkhi, B., and Rajeswari, K.
(2014). Analysis of different data mining tools using
classification, clustering and association rule mining. In-
ternational Journal of Computer Applications, 93(8).
Potolea, R. and Lemnaru, C. (2011). A comprehensive
study of the effect of class imbalance on the performance
of classifiers. In ICEIS (1), pages 14–21.
Ricci, F., Rokach, L., and Shapira, B. (2015). Recom-
mender systems: introduction and challenges. Recom-
mender systems handbook, pages 1–34.
Sagin, A. N. and Ayvaz, B. (2018). Determination of asso-
ciation rules with market basket analysis: application in
the retail sector. Southeast Europe Journal of Soft Com-
puting, 7(1).
Savalia, S. and Emamian, V. (2018). Cardiac arrhythmia
classification by multi-layer perceptron and convolution
neural networks. Bioengineering, 5(2):35.
Syakur, M. A., Khotimah, B. K., Rochman, E., and Satoto,
B. D. (2018). Integration k-means clustering method and
elbow method for identification of the best customer pro-
file cluster. In IOP conference series: materials science
and engineering, volume 336, page 012017. IOP Pub-
lishing.
Tercan, H., Bitter, C., Bodnar, T., Meisen, P., and Meisen, T.
(2021). Evaluating a session-based recommender system
using prod2vec in a commercial application. In ICEIS
(1), pages 610–617.
¨
Unvan, Y. A. (2021). Market basket analysis with asso-
ciation rules. Communications in Statistics-Theory and
Methods, 50(7):1615–1628.
Yaacob, H., Abdul, W., and Kamaruddin, N. (2013). Clas-
sification of eeg signals using mlp based on categorical
and dimensional perceptions of emotions. In 2013 5th
International Conference on Information and Communi-
cation Technology for the Muslim World (ICT4M), pages
1–6. IEEE.
Yazgana, P. and Kusakci, A. O. (2016). A literature survey
on association rule mining algorithms. Southeast Europe
Journal of soft computing, 5(1).
Yoosofan, A., Ghajar, F. G., Ayat, S., Hamidi, S., and
Mahini, F. (2015). Identifying association rules among
drugs in prescription of a single drugstore using apriori
method. Intelligent Information Management, 7(5):253–
259.
ICEIS 2025 - 27th International Conference on Enterprise Information Systems
334
