
A Luminance-Based Lane Marking Candidate Quality Assessment
for Autonomous Driving in GIS Contexts
Pathum Rathnayaka
a
, Young Hun Kim
b
, In Gu Choi, Gi Chang Kim
c
and
Duk Jung Kim
d
U1 Geographic Information System, 282, Hagui-ro, Dongan-gu, Anyang-si, Gyeonggi-do, Republic of Korea
{pathum, yhkim, igchoi, gckim, djkim}@u1gis.com
Keywords:
Computer Vision, Geo Information Systems, Image Processing, Lane Detection, Luminance, Lane Marking
Quality, Contrast Ratio, Binary Ratio.
Abstract:
The detection of lane marking candidates is crucial for autonomous vehicles and advanced driver-assistance
systems ADAS as they deliver essential information for accurate lane following, localization, and route plan-
ning. Detecting these candidates becomes difficult when road conditions deteriorate or the marking paint is
faded, sometimes making identification nearly impossible. While deep/machine learning (DL/ML) methods
perform well in reliable detection, they often come with the need for extensive labeled datasets, substantial
computational power, and intricate parameter adjustments. In this research, we present a method purely based
on digital image processing to identify and evaluate lane marking candidates, thus avoiding the use of spe-
cialized reflectivity equipment (such as luminance meters) and bypassing complex DL/ML methodologies.
Our pipeline initially identifies lane marking regions using a collection of image-processing techniques. It
then subsequently evaluates their quality using two conditional metrics: a luminance-based contrast ratio and
a white-to-black pixel ratio. Each candidate is categorized as good, bad, or ambiguous by comparing these
metrics to empirically determined thresholds. Evaluations conducted on large sets of road images from con-
ventional and urban highways in South Korea confirm the effectiveness of our proposed method. The system
significantly reduces the dependence on time-consuming labor-intensive annotation, high-end hardware, and
DL/ML expertise. We thus claim that our lightweight, deployable method effectively addresses a significant
gap in luminance-centric lane candidate quality evaluation and can serve either as an independent solution or
as a supplementary option to more sophisticated DL/ML systems in GIS and ADAS applications.
1 INTRODUCTION
Autonomous driving and ADAS systems represent the
forefront of modern transportation technology. By in-
tegrating diverse sensors, powerful computing hard-
ware, and sophisticated algorithms, these systems
promise to enhance driver safety, alleviate traffic con-
gestion, and ultimately enable fully self-governing
vehicles. Within this ecosystem, lane markings are
fundamental; they serve as reliable visual cues for
both human drivers and onboard perception systems,
facilitating tasks such as lane-keeping, lane-changing,
and path planning. Consequently, improvements
in detecting and evaluating lane markings directly
enhance the accuracy and robustness of vehicular
a
https://orcid.org/0000-0003-3422-9770
b
https://orcid.org/0000-0002-0665-2822
c
https://orcid.org/0000-0002-8751-3743
d
https://orcid.org/0000-0001-7016-4594
decision-making.
Despite their importance, lane markings are of-
ten subject to adverse real-world conditions. In-
clement weather (e.g., rain or snow) and prolonged
wear due to traffic can degrade markings to the point
where detection becomes nearly impossible. Al-
though deep learning models (DL), particularly con-
volutional neural networks (CNNs), have shown re-
markable performance in lane detection tasks (Aly,
2008), these approaches require substantial annotated
data, significant computational resources, and fine-
tuning of parameters. Such demands can challenge
resource-limited environments, such as small munici-
pal projects or research laboratories with constrained
budgets.
In contrast, several luminance-based lane detec-
tion strategies have emerged that directly measure
visual characteristics such as, brightness, reflectiv-
ity, and contrast. While some of these approaches
Rathnayaka, P., Kim, Y. H., Choi, I. G., Kim, G. C. and Kim, D. J.
A Luminance-Based Lane Marking Candidate Quality Assessment for Autonomous Driving in GIS Contexts.
DOI: 10.5220/0013430400003935
Paper published under CC license (CC BY-NC-ND 4.0)
In Proceedings of the 11th International Conference on Geographical Information Systems Theory, Applications and Management (GISTAM 2025), pages 85-94
ISBN: 978-989-758-741-2; ISSN: 2184-500X
Proceedings Copyright © 2025 by SCITEPRESS – Science and Technology Publications, Lda.
85

use specialized instruments (e.g., luminance meters)
or incorporate elements of machine learning (ML),
fully luminance-driven pipelines remain relatively un-
common despite their potential compatibility with
standard RGB cameras. By leveraging fundamen-
tal image processing principles and mimicking hu-
man brightness perception, luminance-based methods
eliminate the need for expensive hardware and large-
scale data annotation.
Against this background, this paper introduces a
practical and deployable luminance-based solution.
We propose a high-quality digital image processing
pipeline that first isolates lane marking candidates and
then classifies them using two straightforward yet in-
formative metrics: (1) a contrast ratio (CR) that com-
pares the mean luminance of the marking with that of
its surroundings, and (2) a binary ratio (BR) that mea-
sures the proportion of white pixels within a thresh-
olded image. This dual-metric approach yields an
interpretable quality label—Good, Bad, or Ambigu-
ous—that can be readily integrated into ADAS mod-
ules and GIS platforms.
In regions such as South Korea, official road as-
sessments often rely on reflectivity-based devices or
hybrid DL/ML approaches to evaluate marking con-
ditions (Lee et al., 2010; Park, 2019). Some other
technical materials mostly consider identifying pave-
ment markings and street markings as in (Lee et al.,
2024). These methods can be prohibitively expensive
and logistically challenging, especially when dealing
with diverse road geometries, variable weather condi-
tions, or frequent repainting cycles. Our pipeline ad-
dresses these issues by operating with minimal hard-
ware such as a single monocular camera and employ-
ing straightforward computer vision techniques. We
anticipate that this approach will facilitate large-scale
deployment and reduce overall system overhead, ul-
timately contributing to improved traffic safety and
driver comfort.
The remainder of this paper is organized as fol-
lows. Section 2 reviews relevant literature on lane de-
tection and marking quality assessment, emphasizing
gaps in luminance-based approaches and their impor-
tance as an adaptable measuring approach. Section
3 details our proposed algorithm. The section is di-
vided into subsections; stating our system architec-
ture and motivation, defining the image processing
steps for luminance computation and edge processing
for lane marking candidate region extraction, and the
luminance-based and binary-based pixel analysis for
quality classification criteria. Section 4 presents ex-
perimental results obtained under varied illumination
conditions, while Section 5 discusses the challenges
encountered and potential avenues for future research.
Finally, Section 6 summarizes our key findings and
their broader implications for GIS and ADAS appli-
cations.
2 RELATED WORKS
2.1 Global Overview of Lane Detection
Approaches
Lane detection has long been a central topic in com-
puter vision and robotics. Early approaches fre-
quently employed geometric constraints, such as In-
verse Perspective Mapping (IPM), to project a 2D
image onto a top-down view for easier extraction of
lane lines (Bertozzi and Broggi, 1998; Yoo et al.,
2017; Youjin et al., 2018). Classical techniques re-
lied on methods like the Canny edge detector (Canny,
1986), the Sobel operator (Kanopoulos et al., 1988),
and other gradient-based techniques to highlight lane
boundaries, with the Hough transform (Kiryati et al.,
1991) subsequently grouping these edges into co-
herent lines or curves. For example, Aly (Aly,
2008) combined intensity thresholding with perspec-
tive transformations to achieve real-time lane marker
detection under controlled urban conditions.
In recent years, DL/ML paradigms, primarily
CNNs, have become prevalent. Models, such as
LaneNet (Garnett et al., 2019), perform lane detection
as a pixel-wise segmentation problem (Neven et al.,
2018), and architectures like the spatial convolutional
neural network (SCNN) (Pan et al., 2018) employ spe-
cialized layers to capture row-wise dependencies in
lane structures. More advanced techniques leverage
Transformers (Yang et al., 2024) or generative adver-
sarial networks (GANs) to manage occlusions, curves,
and lane merges. Although these data-driven ap-
proaches often yield superior performance on bench-
marks such as TuSimple (TuSimple Inc., 2017), CU-
Lane (Pan et al., 2018), and LLAMAS (Garnett et al.,
2019), they introduce high requirements for domain-
specific training data, GPU processing power, and pa-
rameter optimization.
Hybrid methods have also been explored, integrat-
ing geometric heuristics with CNN-based feature ex-
traction to reduce computational overhead while en-
hancing resilience to noise. However, these tech-
niques generally presuppose stable road layouts or
favorable lighting conditions. In adverse scenarios,
such as nighttime or inclement weather, these hybrid
methods may struggle to distinguish lane markings
from environmental artifacts.
GISTAM 2025 - 11th International Conference on Geographical Information Systems Theory, Applications and Management
86

2.2 Practicality of a Luminance-Based
Approach
Luminance-based lane detection offers a simple yet
effective alternative by relying on pixel intensity vari-
ations. This approach is computationally efficient and
circumvents the extensive training datasets and high
computational demands associated with DL/ML mod-
els. Furthermore, because luminance-based meth-
ods utilize standard cameras and fundamental image
processing techniques, they provide increased inter-
pretability and easier debugging compared to black-
box AI methods.
Recent studies, such as those reported in (Lee
and Cho, 2023), highlight the importance of retro-
reflectivity and luminance in improving lane detec-
tion. However, these approaches typically require
additional hardware sensors, increasing system com-
plexity and cost. Similarly, LiDAR-based methods
(Certad et al., 2022) remove dependencies on ambient
lighting but at the expense of high-cost sensors and
prolonged data processing times. Also, the channel
number of generated LiDAR sensor scans could lead
to erroneous qualitative analyses, whereas compli-
cated LiDAR fusion should be implemented to check
a particular region as a whole.
On the other hand, luminance-based methods
(particularly for mobile platforms like single-board
computers with a single camera and simple sen-
sor integrations) enable real-time lane detection with
minimal computational demands. Their potential
for seamless integration and cost benefits makes
these methods highly attractive for use in resource-
constrained environments.
2.3 Luminance-Based Quality
Estimation
A growing body of literature (Smadi et al., 2008;
Burghardt et al., 2021; Zhu et al., 2021; Zhu
et al., 2024) emphasizes the role of luminance, or
brightness-related metrics, in evaluating road infras-
tructure quality. Early works as of (Balali et al.,
2015) and (Roman et al., 2015) demonstrated the
correlation between luminance levels and driver re-
sponse, while (Zhu et al., 2021) extended these prin-
ciples to assess nighttime pavement markings, show-
ing that reduced reflectivity directly impacts driver re-
action times.
In the context of lane markings, Sultana et al. (Sul-
tana et al., 2022) have addressed all kind of real-life
environmental challenges to detect road lane mark-
ings and categorized them into four types. Munir
et al. (Munir et al., 2021) proposed an encoder-
decoder architecture for lane marking detection us-
ing event camera images, which they tend to extract
higher-dimensional features from images, robust to
illumination variations. Huang et al. (Huang and
Liu, 2021) further illustrated illumination invariant
Hough-based technique, evaluating the robustness of
brightness comparisons as cues for road network ex-
traction.
However, one major research gap that persists
in most of these researches is the application of
luminance-based algorithms is only limited to lane
marking candidate detection. The approach is not
only for detection but also for the quantitative assess-
ment of marking quality. Road maintenance agencies
require objective metrics to flag deteriorated markings
for repainting or to assess safety risks. While special-
ized reflectivity meters exist (for Testing and Materi-
als., 2005; Commission Internationale de l’Eclairage,
2001), their high cost and labor-intensive operation
limit their scalability. Our approach addresses this by
using contrast ratio (CR) and binary ratio (BR) met-
rics—correlating closely with human perception of
clarity—to provide an interpretable and efficient qual-
ity assessment for lane markings.
3 ALGORITHM PIPELINE
Input image
Lane Marking
Detection
Processing Module
Luminance
Computation
White-to-Black Ratio
Computation
Quality Assessing
Module
Contrast Ratio
Computation
Figure 1: Overview of our proposed algorithm. The input
image is processed in the first module–Processing Module–
and it extracts all the lane marking candidates using ad-
vanced image processing techniques. All these candidates
are then passed to and processed in the second module–
Quality Assessing Module–to evaluate their quality.
3.1 Motivation and System Architecture
The proposed pipeline, illustrated in Figure 1, com-
prises two primary modules. The first module em-
ploys advanced image processing techniques to detect
potential lane marking candidates, while the second
module assigns quality labels based on combined lu-
minance contrast and binary ratio evaluations. This
dual-layer approach not only identifies lane markings
but also quantitatively measures their clarity in real-
world conditions.
Our rationale for adopting an exclusively
luminance-based approach is twofold:
A Luminance-Based Lane Marking Candidate Quality Assessment for Autonomous Driving in GIS Contexts
87
Input RGB road image
Luminance image
Color applied Luminance image
Bilateral filtered image
‘V’ channel extracted &
normalized to grayscale
Create YUV
Otsu threshold
Binarization
Speckle filter & sky filter image
Contour
detection
& filtering
Lane marking candidate
Contour image
Hough
Transform
Canny Edges
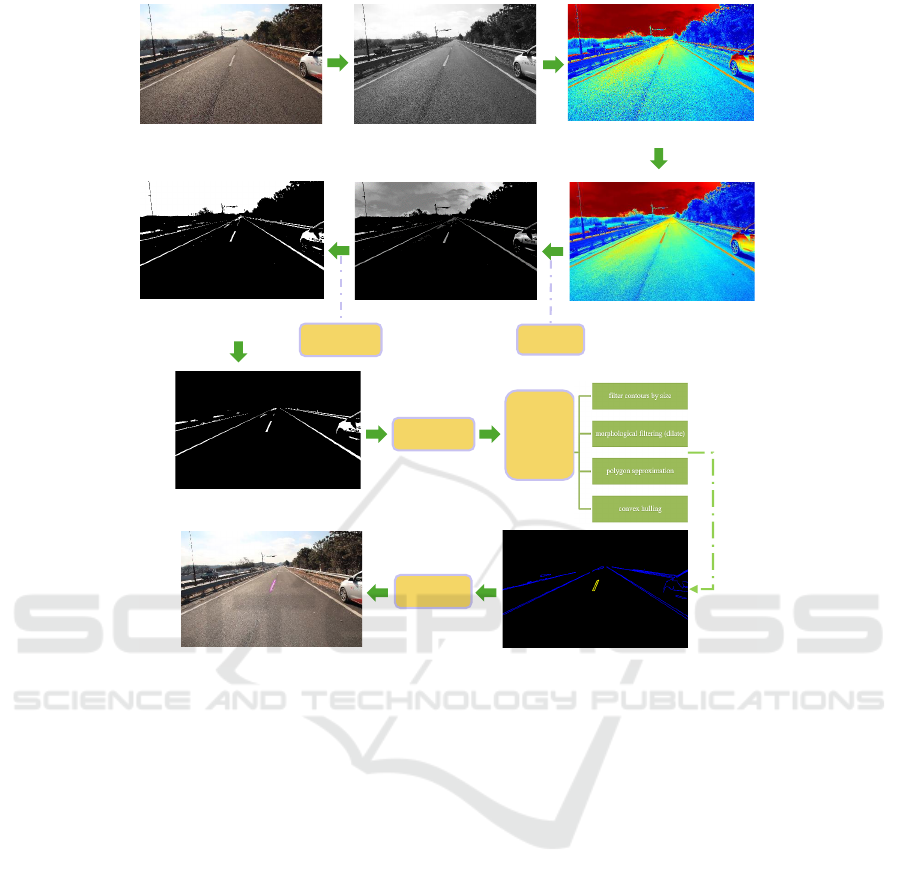
Figure 2: Overview of the first module: lane marking candidates are detected using image processing techniques. The
luminance image is created and new color values are applied as a LUT and normalized to make marking candidates more
distinguishable. The ’V’ channel is extracted from the normalized image, where binarization, edge detection, n, and contour
extraction methods are applied to identify the proper candidate region. Hough transformation is next applied to identify the
lane marking as the final output of the first module.
• Hardware Minimization: The method avoids
the need for specialized reflectivity meters, facil-
itating widespread adoption in standard camera-
based ADAS or onboard vehicle systems. This
makes this method a suitable approach, even if ad-
ditional equipment, such as LiDARisre required
to be integrated for further intensity-based pro-
cessing.
• Algorithmic Simplicity: By relying on estab-
lished computer vision operations, such as fil-
tering, thresholding, and morphological analy-
sis, we eliminate the requirement for large an-
notated datasets, extensive GPU training, and
complex optimization procedures/parameter tun-
ing required in many AI approaches.
The subsequent briefly explains our proposed method
w.r.t two processing modules described in Figure 1.
3.2 Detecting Lane Marking Candidates
The process of lane marking candidate detection is
depicted in Figure 2 (First Module in Figure 1). In
this, we prefer generating a luminance image to detect
lane marking candidates, instead of using raw RGB
camera images directly. Luminance images are pre-
ferred over RGB images as they leverage inconsisten-
cies that could hinder the detection of lane marking
candidates where clear distinctions should be made
between lane surfaces and road surfaces at varying
lighting conditions.
The luminance L can be computed as:
L = sB × 0.0722 + sG × 0.7152 + sR × 0.2126, (1)
This enables us to have a clear idea of the percep-
tual relativity of the human non-linear response curve.
Thus, a more suitable luminance calculation suffice
for the requirements of this research can then be de-
rived by
GISTAM 2025 - 11th International Conference on Geographical Information Systems Theory, Applications and Management
88

1. normalizing sRGB values into decimal within the
range of 0.0 ∼1.0,
Norm
(R,G,B)
=
sChannel
255
(2)
eliminating the limitations of 8-bit quantization.
2. computing gamma-encoded RGB values from
normalized sRGB values,
=
Norm
(R,G,B)
12.92
if Norm ≤ 0.03928
Norm
(R,G,B)
+0.055
1.055
2.4
otherwise
(3)
following established sRGB protocols (Poynton,
2012).
3. And using gamma-encoded values to compute lu-
minance values which align with human visual
sensitivity as of:
L = 0.2126 R
′
+ 0.7152G
′
+ 0.0722B
′
. (4)
Once the luminance for every pixel is computed,
the image is recolored as a look-up table (LUT) to
identify the regions of our interest. Once recolored,
it was witnessed that the imagecontainedin unneces-
sary noise; which could degrade our image process-
ing pipeline. A bilateral filter (Tomasi and Manduchi,
1998) is applied to suppress these high-frequency
noise data while preserving important boundaries of
lane lines. The image is converted to the YUV color
space, and the V channel is extracted to isolate bright-
ness or chrominance data useful in identifying reflec-
tive or bright candidate’s paint information.
A min-max normalization is applied to standardize
V channel intensities to [0, 255], followed by a gamma
correction (Poynton, 2012) to align the brightness per-
ception more closely with human vision. The Otsu’s
thresholding (Otsu et al., 1975; Otsu, 1979) is used to
segregate brighter lane markings from the darker road
surface. Small noise artifacts are further eliminated
using morphological opening and speckle filtering.
The Canny edge detector (Canny, 1986) is used
to identify the edge boundaries of lane candidates.
A morphological dilation is applied to connect all
the disjoint dashed candidates. By this, we man-
aged to minimize the effect of mildly faded lane
markings. Edge contours are approximated using the
Ramer–Douglas–Peucker (RDP) algorithm (Douglas
and Peucker, 1973; Ramer, 1972) to reduce polygon
complexity, and convex hulls are computed to ensure
continuous bounding while eliminating irregular clus-
ters. Contours failing to meet minimum area or width
criteria are discarded.
Next, a probabilistic Hough transform (Kiryati
et al., 1991) is applied to refine lines that approximate
typical lane geometry (straight and gently curved),
adhering to parallel or near-parallel constraints. The
surviving polygons, which are lane marking candi-
dates, are superimposed on the original RGB image
for real-time validation. These lane marking candi-
dates are subsequently assessed for quality, as dis-
cussed next.
3.3 Lane Marking Quality Assessment
After extracting lane marking candidates, their quality
is quantified using two conditional metrics:
1. mean luminance comparison (contrast ratio : CR)
2. white-to-black pixel comparison (binary ratio :
BR).
By integrating these measures, we obtain a holistic
assessment of how distinct or faded each marking is
relative to its background.
The first criterion is inspired by human visual per-
ception of brightness differences and obviates special-
ized reflectivity measurements, whereas the latter is
a justification of white pixel count w.r.t black pixel
count inside the detected lane marking. To assess the
visual distinctiveness of a candidate lane marking re-
gion, we compute the contrast ratio between the av-
erage luminance inside the region and the average lu-
minance of the surrounding background. The process
proceeds as follows:
1. Region Isolation
• A binary mask is created from the polygon that
bounds the candidate lane region. Pixels within
this polygon are set to white (255), and all other
pixels remain black (0).
• We apply this mask to the luminance image
and crops the resulting masked region using
the polygon’s bounding rectangle, ensuring that
only relevant pixels (i.e., those within the poly-
gon) are retained.
2. Lane vs. Background Accumulation
• Within the bounding rectangle, each pixel’s
value is added to a lane or background sum de-
pending on whether it lies inside (> 0) or out-
side (= 0) the polygon. The total luminance for
each category is tracked, along with the number
of pixels in each category.
3. Mean Luminance Computation
• After processing all pixels, the total luminance
of the lane region is divided by the lane-pixel
count to obtain the average lane luminance
(
¯
L
lane
).
L
lane
=
∑
(lane intensities)
lane pixel count
+ 0.05 (5)
A Luminance-Based Lane Marking Candidate Quality Assessment for Autonomous Driving in GIS Contexts
89
Lane marking candidate image
Create Mask images
Reference mask & Image mask
Compute Mean pixel values
for lane region & its
Background
𝐶𝑜𝑛𝑡𝑟𝑎𝑠𝑡 𝑟𝑎𝑡𝑖𝑜 =
𝑀𝑒𝑎𝑛 𝑙𝑎𝑛𝑒
𝑀𝑒𝑎𝑛 𝑏𝑎𝑐𝑘𝑔𝑟𝑜𝑢𝑛𝑑
Contrast ratio comparison
Final verdict image
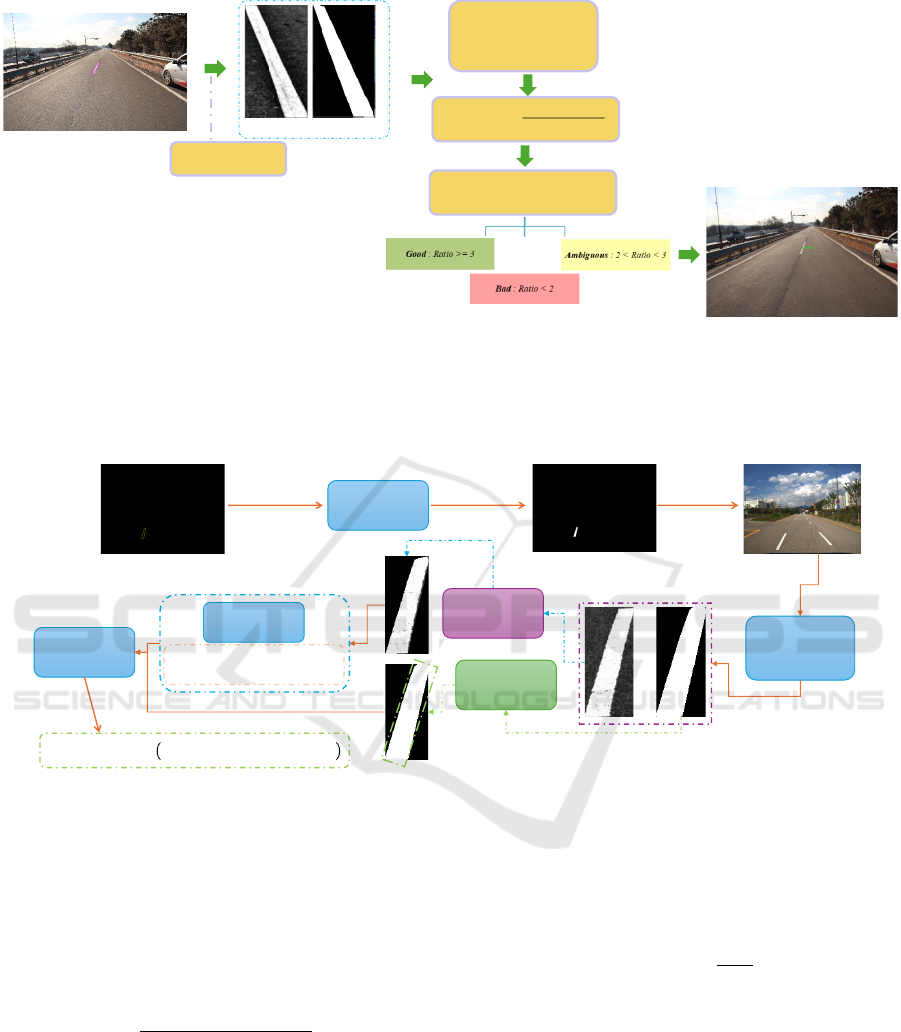
Figure 3: Overview of the second module: evaluating the contrast ratio (CR) for each candidate. An ROI from the lane
candidate found at the first module is extracted and a simulated pure black-and-white region (0s and 255s only) is created
to distinguish pixel values above the lane marking from its surrounding road surface. Mean values are used to compute the
contrast ratio and the outcome is compared with pre-determined threshold values. This is the first qualitative conditional
metric of our proposed quality evaluation.
Polygon
Approximation
Contours Img
Create
Mask
Apply Mask
on Image
Extract contour
corners
Mask Img
Extract
Image Region &
Create
Reference Mask
Compute
𝐵𝑙𝑎𝑐𝑘 Pixels
ቊ
𝑊ℎ𝑖𝑡𝑒 | 𝑖𝑓𝑓 𝑃𝑖𝑥𝑒𝑙 𝑉𝑎𝑙≥𝐶𝑢𝑡_𝑜𝑓𝑓
𝐵𝑙𝑎𝑐𝑘 | 𝑖𝑓𝑓 𝑃𝑖𝑥𝑒𝑙 𝑉𝑎𝑙 <𝐶𝑢𝑡_𝑜𝑓𝑓
Polygon Region with
Background
Reference
Mask
Retain only
Polygon Area
Calculate full
pixel count in
white region
𝐵𝑖𝑛𝑎𝑟𝑦 𝑅𝑎𝑡𝑖𝑜=1.0 − ൗ
𝐵𝑙𝑎𝑐𝑘 𝑝𝑖𝑥𝑒𝑙 𝑐𝑜𝑢𝑛𝑡
𝑊ℎ𝑖𝑡𝑒 𝑝𝑖𝑥𝑒𝑙 𝑐𝑜𝑢𝑛𝑡
Calculate
Binary ratio
Figure 4: Overview of the second module: assessing the binary ratio (BR) for additional clarity analysis. The candidate
region with the surrounding road surface area is extracted. A simulated ROI of the same size with only having 0s and 255s is
created as a reference mask, and the total number of white pixels is calculated. The total white and black pixels from the real
candidate polygon area is estimated by comparing them g with a pre-assigned threshold value. The final white-to-black ratio
is computed using these two values.
• Likewise, the total luminance of the back-
ground region is divided by the background-
pixel count to obtain the average background
luminance (
¯
L
bg
).
L
bg
=
∑
(ground intensities)
ground pixel count
+ 0.05 (6)
• A small offset (e.g., 0.05) is added to both val-
ues to avoid division by zero and to mitigate
extremely low pixel intensities.
4. Contrast Ratio
• We define the contrast ratio, CR, as the ratio of
the average lane luminance,
¯
L
lane
, to the aver-
age background luminance,
¯
L
bg
:
CR =
¯
L
lane
¯
L
bg
(7)
• A larger contrast ratio implies that the lane re-
gion is significantly brighter than its surround-
ings, enhancing its detectability. Conversely,
values below a chosen threshold (e.g., 2.0) sug-
gest that the lane may be difficult to discern
from the background.
5. Binary Ratio
• To further assess the region’s distinctiveness,
the cropped mask is thresholded via Otsu’s
method to produce a binarized mask.
GISTAM 2025 - 11th International Conference on Geographical Information Systems Theory, Applications and Management
90

• The number of white pixels (whiteCount) and
black pixels (blackCount) are then computed.
• The binary ratio, BR is determined by:
BR = 1.0 −
blackCount
whiteCount
(8)
• This ratio captures how many pixels remain
bright (white) relative to dark (black) pixels
within the thresholded candidate region. Val-
ues closer to 1.0 indicate a more clearly distin-
guished (i.e., whiter) region after thresholding.
6. Quality Verdict Classification
• Equations 1 ∼ 8 ensure that intensity values
within the candidate lane region and the local
background context are accounted for, yielding
a robust measure of how clearly the lane mark-
ings stand out from their surrounding back-
ground. This combination provides a good
conditional criterion to make a distinct verdict
whether the candidate is of good condition, bad
condition, or in a state in between.
• Experimenting with a multiple of input im-
ages, and with thorough condition evaluations
by naked human eye, a cut-off value range suit-
able for making verdicts of lane markings is de-
termined for both CR and BR.
• If CR < 2.0; the region is deemed to exhibit in-
sufficient contrast and thus, assessed as of Bad
CR.
• If 2.0 ≤ CR < 3.0; the region possesses border-
line contrast and thus, assessed as of Ambigu-
ous CR.
• If CR ≥ 3.0; the region is considered to have
sufficiently high contrast and thus, assessed as
of Good CR.
• After the CR evaluation, then it is checked
against the BR condition. If BR < 0.17; the re-
gion is assessed as of Bad BR.
• If 0.17 ≤ BR < 0.49; the region is assessed as
of Ambiguous BR.
• If BR ≥ 0.5; the region is assessed as of Good
BR.
• A candidate is classified as Good Quality only
if both CR and BR meet the “good” thresh-
olds, Bad Quality if both fail, and Ambigu-
ous Quality in all other cases. These thresh-
olds were established after extensive pilot test-
ing and visual inspections across a diverse set
of road images.
4 EXPERIMENTS AND RESULTS
To rigorously assess the performance of our pipeline,
we compiled a dataset of approximately 5,000+ im-
ages captured under varying traffic and illumination
conditions in South Korea. Images were recorded us-
ing a standard monocular camera mounted on a test
vehicle at three distinct times: 10 a.m., 1 p.m., and
5 p.m. This sampling strategy covers scenarios with
high sun angles, partially overcast skies, and early-
evening shadows. All experiments were conducted on
a standard desktop (Intel(R) Core(TM) i7-9700 CPU
@ 3.00GHz, 32GB RAM), demonstrating that the
proposed method is computationally feasible without
dedicated GPU infrastructure.
4.1 Implementation Details and
Parameters
Key parameters of the pipeline include:
• Bilateral Filter Kernel Size: Selected between 5
and 9 pixels to balance noise reduction with edge
preservation.
• Morphological Dilation Size: Typically set be-
tween 3×3 and 5×5, ensuring that dashed or
slightly faded markings merge into continuous
contours.
• Minimum Polygon Area: Set to 100 pixels to
filter out minor noise or artifacts.
• Probabilistic Hough Transform Settings: A
minimum line length of 30 pixels and a gap
threshold of 5 pixels facilitate the detection of par-
tial or dashed lines.
4.2 Quantitative Evaluation
Manual annotation was performed on a subset of
1,000 images to validate detection and quality label-
ing. Human evaluators rated each detected marking as
visually good, borderline, or visually poor and used as
ground truth evaluations in our work.
Throughout the experiments, it was observed that
the proposed bilateral filtering plus morphological ap-
proach was able to effectively isolate lane edges in the
presence of moderate wear or dashed patterns, even
when shaded occlusion was available. The contrast
ratio reliably distinguished freshly painted (“Good”)
markings from heavily faded or unclear (“Bad”) ones,
with borderline scenarios marked as “Ambiguous” for
further inspection. Unlike ML-based approaches, ex-
tensive annotated data sets or specialized reflectome-
try equipment were not needed.
A Luminance-Based Lane Marking Candidate Quality Assessment for Autonomous Driving in GIS Contexts
91
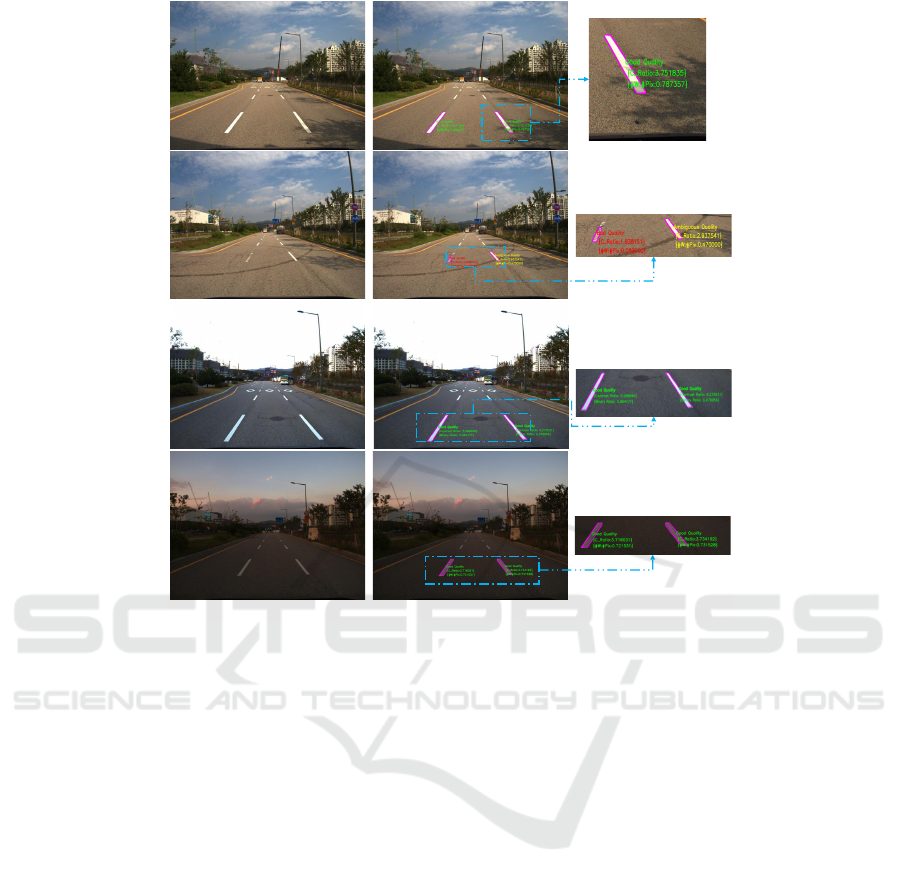
Input RGB Final Verdict
Figure 5: Some of the representative results of our proposed lane marking detection and quality assessment algorithm. The
top row shows the correct detection and analysis of road markings even when partially shadowed regions exist; the second
row depicts the distinction between “Bad” and “Ambiguous” quality assessment; the third row shows the successful detection
under overcast/evening conditions; the bottom row depicts the robust performance of our method even in bad and dim lighting
conditions.
The pipeline’s classifications were compared with
these ground-truth labels:
• Detection Rate: Over 90% of clearly visible lane
markings were successfully localized, with most
missed cases occurring under severe occlusions or
extreme fading (since lane marking candidate de-
tection was extremely difficult in such regions).
• Quality Label Accuracy: Approximately 86% of
the classifications matched the human-labeled cat-
egories (i.e., Good, Ambiguous, Bad), indicating a
strong correlation between our luminance-based
metrics and human perception.
Figure 5 illustrates some of the representative out-
comes. In many cases, even faint or partially occluded
markings were detected due to the effective use of bi-
lateral filtering and morphological operations. The
contrast ratio (CR) reliably differentiated between
newly painted and heavily worn markings, while the
binary ratio (BR) validated the overall whiteness of
the candidate regions. Markings labeled as “Ambigu-
ous” typically exhibited moderate wear or incomplete
paint coverage, reflecting the inherent challenges in
achieving consistent classification.
4.3 Performance and Timing
On our CPU-based system, the pipeline processed
1936×1464 resolution images at an average rate of
8 ∼ 12 frames per second (fps). While further op-
timization (e.g., code-level improvements, vectoriza-
tion, or parallelization using OpenMP) could enhance
this performance, the current throughput indicates
that near-real-time operation is feasible on standard
hardware.
5 CHALLENGES AND FUTURE
DIRECTIONS
Despite promising results, the proposed pipeline faces
several limitations and opportunities for further im-
provement:
GISTAM 2025 - 11th International Conference on Geographical Information Systems Theory, Applications and Management
92

1. Nighttime Glare and Harsh Lighting: Although
the system performs well under partially shad-
owed and overcast conditions, nighttime scenes
with strong headlight glare or streetlight reflec-
tions can introduce artifacts that impair threshold-
ing. As for future work, we are planning to incor-
porate adaptive exposure techniques and special-
ized nighttime preprocessing.
2. Curved Lane Detection: The current approach
primarily handles relatively straight lane seg-
ments. Incorporating polynomial and spline-
fitting methods is under development to enhance
detection on winding roads or at highway inter-
changes.
3. Detection of Crosswalks and Road Symbols:
Road markings are not limited to lane lines; fea-
tures such as crosswalks, directional arrows, and
textual signs also influence safe navigation. We
are currently extending the morphological and
shape approximation modules to enable effective
detection and classification of these additional el-
ements.
4. Harsh Shadows and Occlusion Robustness: Se-
vere shadows, such as those cast by bridges, tun-
nels, or dense foliage can distort CR and BR met-
rics by darkening both the lane markings and the
background. We are developing to implement
local region-based thresholding with multi-frame
data fusion to improve robustness in these chal-
lenging scenarios.
5. Temporal Smoothing and Tracking: Process-
ing each frame independently may result in occa-
sional flickering detections. Incorporating tempo-
ral smoothing or short-term tracking across con-
secutive frames could enhance detection stability
and reduce transient artifacts.
Addressing these challenges will further improve
the reliability and extend the applicability of our
pipeline, from rural two-lane roads to complex urban
highways.
6 CONCLUSION
This paper presents a comprehensive digital im-
age processing and luminance-based pipeline for de-
tecting lane marking candidates and assessing their
quality, which avoids the complexities associated
with deep/machine learning models and the neces-
sity for specialized reflectivity sensors. By using ad-
vanced image processing techniques such as bilateral
filtering, thresholding, morphological filtering, and
Hough-based line refinement, the system manages to
effectively identify the regions of lane marking candi-
dates. It then employs a dual-metric approach, utiliz-
ing contrast ratio (CR) and binary ratio (BR), to cate-
gorize each candidate as ”Good,” ”Bad,” or ”Ambigu-
ous.”
Experimental evaluations conducted on a diverse
dataset from South Korea demonstrate that the pro-
posed method aligns well with human assessments of
lane marking quality and performs efficiently on stan-
dard computing hardware. This solution offers a cost-
effective alternative to sophisticated deep/machine
learning methods and experiments that depend on us-
ing expensive reflectometers, making it particularly
suitable for resource-constrained environments.
From the perspective of GIS systems, integrating
techniques that detect and assess lane markings based
on luminance allows to evolve from traditional static
mapping frameworks to advanced, real-time monitor-
ing systems. This advancement enhances the preci-
sion and reliability of road network databases, sup-
ports proactive road maintenance strategies, boosts
the effectiveness of navigation systems, and lays a
solid foundation for more informed and strategic ur-
ban planning decisions.
In future work, we plan to address nighttime-
specific challenges, improve curved lane detec-
tion, and incorporate advanced shadow compensation
strategies, thereby broadening the system’s applica-
bility in many GIS and ADAS contexts.
ACKNOWLEDGMENTS
This study was conducted with the support of the
“Road Traffic Infrastructure Monitoring and Emer-
gency Recovery Support Service Technology Devel-
opment (RS-2021-KA160853)” project of the Min-
istry of Land, Infrastructure and Transport.
REFERENCES
Aly, M. (2008). Real time detection of lane markers in ur-
ban streets. In 2008 IEEE intelligent vehicles sympo-
sium, pages 7–12. IEEE.
Balali, V., Sadeghi, M. A., and Golparvar-Fard, M. (2015).
Image-based retro-reflectivity measurement of traffic
signs in day time. Advanced Engineering Informatics,
29(4):1028–1040.
Bertozzi, M. and Broggi, A. (1998). Gold: A parallel real-
time stereo vision system for generic obstacle and lane
detection. IEEE Transactions on Image Processing,
7(1):62–81.
A Luminance-Based Lane Marking Candidate Quality Assessment for Autonomous Driving in GIS Contexts
93

Burghardt, T. E., Popp, R., Helmreich, B., Reiter, T., B
¨
ohm,
G., Pitterle, G., and Artmann, M. (2021). Visibility
of various road markings for machine vision. Case
Studies in Construction Materials, 15:e00579.
Canny, J. (1986). A computational approach to edge de-
tection. IEEE Transactions on Pattern Analysis and
Machine Intelligence, 8(6):679–698.
Certad, N., Morales-Alvarez, W., and Olaverri-Monreal,
C. (2022). Road markings segmentation from lidar
point clouds using reflectivity information. In 2022
IEEE International Conference on Vehicular Elec-
tronics and Safety (ICVES), pages 1–6. IEEE.
Commission Internationale de l’Eclairage (2001). CIE
54.2-2001: Retroreflection: Definition and measure-
ment.
Douglas, D. H. and Peucker, T. K. (1973). Algorithms for
the reduction of the number of points required to rep-
resent a digitized line or its caricature. Cartograph-
ica: The International Journal for Geographic Infor-
mation and Geovisualization, 10(2):112–122.
for Testing, A. S. and Materials. (2005). Standard test
method for measurement of retroreflective pavement
marking materials with cen-prescribed geometry us-
ing a portable retroreflectometer (astm e 1710-05).
Garnett, H., Cohen, R., Pe’er, T., Lahav, Y., and Shashua,
A. (2019). 3d-lanenet: End-to-end 3d multiple lane
detection. In Proceedings of the IEEE/CVF Interna-
tional Conference on Computer Vision (ICCV), pages
2921–2930. IEEE.
Huang, Q. and Liu, J. (2021). Practical limitations of lane
detection algorithm based on hough transform in chal-
lenging scenarios. International Journal of Advanced
Robotic Systems, 18(2):17298814211008752.
Kanopoulos, N., Vasanthavada, N., and Baker, R. L. (1988).
Design of an image edge detection filter using the
sobel operator. IEEE Journal of solid-state circuits,
23(2):358–367.
Kiryati, N., Eldar, Y., and Bruckstein, A. M. (1991). A
probabilistic Hough transform. Pattern Recognition,
24(4):303–316.
Lee, S. and Cho, B. H. (2023). Evaluating pavement
lane markings in metropolitan road networks with a
vehicle-mounted retroreflectometer and ai-based im-
age processing techniques. Remote Sensing, 15(7).
Lee, S., Koh, E., Jeon, S.-i., and Kim, R. E. (2024).
Pavement marking construction quality inspection
and night visibility estimation using computer vision.
Case Studies in Construction Materials, 20:e02953.
Lee, S., Son, H., and Min, K. (2010). Implementation of
lane detection system using optimized hough trans-
form circuit. In 2010 IEEE Asia Pacific Conference
on Circuits and Systems, pages 406–409. IEEE.
Munir, F., Azam, S., Jeon, M., Lee, B.-G., and Pedrycz,
W. (2021). Ldnet: End-to-end lane marking detec-
tion approach using a dynamic vision sensor. IEEE
Transactions on Intelligent Transportation Systems,
23(7):9318–9334.
Neven, D., De Brabandere, B., Georgoulis, S., Proesmans,
M., and Van Gool, L. (2018). Towards end-to-end
lane detection: An instance segmentation approach. In
2018 IEEE Intelligent Vehicles Symposium (IV), pages
286–291. IEEE.
Otsu, N. (1979). A threshold selection method from gray-
level histograms. IEEE Transactions on Systems,
Man, and Cybernetics, 9(1):62–66.
Otsu, N. et al. (1975). A threshold selection method from
gray-level histograms. Automatica, 11(285-296):23–
27.
Pan, X., Shi, J., Luo, P., Wang, X., and Tang, X. (2018).
Spatial as deep: Spatial CNN for traffic scene under-
standing. arXiv preprint arXiv:1712.06080.
Park, H. (2019). Lane detection algorithm based on
hough transform for high-speed self driving vehi-
cles. International Journal of Web and Grid Services,
15(3):240–250.
Poynton, C. (2012). Digital Video and HD: Algorithms and
Interfaces. Morgan Kaufmann Publishers.
Ramer, U. (1972). An iterative procedure for the polygonal
approximation of plane curves. Computer graphics
and image processing, 1(3):244–256.
Roman, F. J. B., Mendez, J. A. G., Gallo, A. M., Machin,
D. O. D. L., and Garcia, A. S. P. (2015). Method for
determining the luminance of traffic signs and device
for implementing same. US Patent 9,171,362.
Smadi, O., Souleyrette, R. R., Ormand, D. J., and Hawkins,
N. (2008). Pavement marking retroreflectivity: Anal-
ysis of safety effectiveness. Transportation Research
Record, 2056(1):17–24.
Sultana, S., Ahmed, B., Paul, M., Islam, M. R., and Ah-
mad, S. (2022). Vision-based robust lane detection
and tracking under different challenging environmen-
tal conditions. arXiv preprint arXiv:2210.10233.
Tomasi, C. and Manduchi, R. (1998). Bilateral filtering for
gray and color images. In Proceedings of the 6th IEEE
International Conference on Computer Vision, pages
839–846.
TuSimple Inc. (2017). TuSimple Lane Detection Challenge.
https://github.com/TuSimple/tusimple-benchmark.
Accessed: [Month Day, Year].
Yang, Z., Shen, C., Shao, W., Xing, T., Hu, R., Xu, P., Chai,
H., and Xue, R. (2024). Ldtr: Transformer-based lane
detection with anchor-chain representation. Computa-
tional Visual Media, 10(4):753–769.
Yoo, J. H., Lee, S.-W., Park, S.-K., and Kim, D. H. (2017).
A robust lane detection method based on vanishing
point estimation using the relevance of line segments.
IEEE Transactions on Intelligent Transportation Sys-
tems, 18(12):3254–3266.
Youjin, T., Wei, C., Xingguang, L., and Lei, C. (2018). A
robust lane detection method based on vanishing point
estimation. Procedia computer science, 131:354–360.
Zhu, B., Song, C., Guo, Z., Zhang, Y., and Zhou, Z. (2021).
Effectiveness of active luminous lane markings on
highway at night: A driving simulation study. Sus-
tainability, 13(3):1043.
Zhu, S., Li, Z., Long, K., Zhou, S., and Zhou, Z. (2024).
Study of illumination and reflection performances on
light-colored pavement materials. Construction and
Building Materials, 456:139239.
GISTAM 2025 - 11th International Conference on Geographical Information Systems Theory, Applications and Management
94
