
Multimodal Route Planning Integrating Soft Mobility: A Real-World
Case Study for Student Mobility
Rekia Abdellaoui
1,2 a
, Simon Caillard
1 b
, Myriam Foucras
3 c
and David Baudry
4 d
1
CESI LINEACT, Campus de Strasbourg, Lingolsheim, France
2
ENSAM, Paris, France
3
CESI LINEACT, Campus de Toulouse, Lab
`
ege, France
4
CESI LINEACT, Campus de Rouen, Saint-
´
Etienne-du-Rouvray, France
Keywords:
Multimodal Route Planning, Public Transport, Soft and Active Mobility, Susbtainable Mobility, Student
Mobility.
Abstract:
Soft and active mobility (SAM) integration into multimodal route planning is a critical innovation for advanc-
ing sustainable transportation. This study explores the inclusion of shared (SSAM) and personal (PSAM) soft
and active mobility modes within public transport systems. Leveraging a time-expanded model, the proposed
approach optimizes route planning by introducing reliability as a novel metric for selecting transportation
options. The methodology is tested on real-world data from student commutes in Strasbourg, providing a
practical demonstration of its applicability. Results highlight the significant benefits of integrating SSAM and
PSAM, including improved route efficiency, enhanced reliability, and seamless transitions within multimodal
networks. This case study underlines the potential of combining innovative models with real-world data to
address contemporary transportation challenges effectively.
1 INTRODUCTION
In the context of reducing greenhouse gas emissions,
sustainable mobility planning is a major challenge.
In France, daily travel, especially between home
and study/working locations, significantly contributes
to CO
2
emissions, largely due to private car usage
(Drouin et al., 2010). Student mobility is particu-
larly important, as students frequently travel for aca-
demic purposes. Their rigid schedules and financial
limitations make them an important target for sus-
tainable mobility strategies. However, their prefer-
ence for public transport and active modes like cy-
cling and walking makes them ideal candidates for
cost-effective, eco-friendly transport solutions. As
such, student mobility presents a valuable opportunity
to advance sustainable transportation initiatives.
Integrating multimodal transport is one of the
most effective ways to reduce the carbon footprint
of daily commutes. This approach combines various
transport modes, such as trains, buses, and trams, to
a
https://orcid.org/0009-0005-1582-5245
b
https://orcid.org/0000-0002-9175-171X
c
https://orcid.org/0009-0002-3673-8528
d
https://orcid.org/0000-0002-4386-4496
meet users’ needs flexibly. With the rising ecological
awareness, multimodal systems have been expanded
to include soft and active mobility (SAM) options
like bicycles and scooters (ADEME, 2023), allow-
ing transitions between the different modes of trans-
portation. While studies have explored incorporat-
ing shared-SAM (SSAM) as an independent mode of
transport (Horstmannshoff and Ehmke, 2022; Delling
et al., 2013; Alessandretti et al., 2023) or as a transfer
solution between modes (Potthoff and Sauer, 2021;
Phan and Viennot, 2019), a notable gap remains in
their ability to seamlessly integrate SSAM into tran-
sitions between transport systems. Furthermore, there
is a lack of integration of personal-SAM (PSAM)
throughout the journey while respecting the various
constraints of the trip. This limitation prevents the full
optimization of the overall SAM into user’s journey.
In the modeling of transport networks, two main
approaches are commonly used to address temporal
constraints in public transport (PT) systems: time-
dependent and time-expanded models. Temporal con-
straints are crucial in PT, where travel times are gov-
erned by fixed schedules and vary depending on the
time of day. The time-dependent model (Brodal and
Jacob, 2004) represents stations as nodes and connec-
596
Abdellaoui, R., Caillard, S., Foucras, M. and Baudry, D.
Multimodal Route Planning Integrating Soft Mobility: A Real-World Case Study for Student Mobility.
DOI: 10.5220/0013431400003941
In Proceedings of the 11th International Conference on Vehicle Technology and Intelligent Transport Systems (VEHITS 2025), pages 596-604
ISBN: 978-989-758-745-0; ISSN: 2184-495X
Copyright © 2025 by Paper published under CC license (CC BY-NC-ND 4.0)

tions as arcs, with travel times defined by a mono-
tonic function f
e
(t) of the departure time. This en-
sures consistent travel times and avoids logical incon-
sistencies. However, the model assumes deterministic
travel times, and does not account for delays and un-
certainties inherent in real-world systems. Since PT
is often affected by operational disruptions, delays,
and fluctuating traffic conditions, the time-dependent
approach may struggle to accurately capture the real-
time dynamics of transport networks. Conversely, the
time-expanded model (Pyrga et al., 2008) introduces
a temporal dimension by duplicating each node for
every vehicle departure and arrival event, offering a
more detailed representation of schedules and trans-
fers. However, a major drawback is the substantial in-
crease in graph size, as the number of nodes and arcs
grows exponentially with the number of time inter-
vals considered. This makes the model computation-
ally expensive and challenging to scale for large, real-
world networks. Despite these limitations, the time-
expanded model is particularly valuable for capturing
variable schedules and the multimodal nature of jour-
neys (Bast et al., 2015; Lienkamp and Schiffer, 2024;
Goel et al., 2016).
This study presents an innovative approach to
route planning, introducing additional considerations
associated with the integration of soft and active mo-
bility. By incorporating both SSAM and PSAM into
a generic model capable of accommodating any num-
ber of SAM, the proposed approach enhances flexi-
bility in selecting transport modes throughout a jour-
ney. The challenges are then to manage transitions
between personal and shared SAMs and optimize
their usage based on the user’s travel requirements.
This approach demands a more nuanced analysis of
transport mode choices, temporal constraints, transfer
times, and the feasibility of journey continuity, par-
ticularly for certain SAMs that require specific autho-
rizations, such as bringing a bicycle onto a bus. This
work forms part of the ”Mon Trajet Vert” (Mon Trajet
Vert, 2025) initiative, which aims to provide dynamic,
multimodal, and sustainable route planning solutions
tailored to the specific needs of students. To ensure
the essential punctuality demanded by students with
strict time constraints and to address the temporal
complexity and multimodal integration of intermodal
journey planning, this work adopts a time-expanded
model as an appropriate approach. The problem is
described in Section 2, along with the correspond-
ing modeling approach 3. The algorithm developed
to solve it is detailed in Section 4. Its results are given
in section 5, using real-world data derived from stu-
dents’ schedules, offering a practical alternative to the
random data generation methods often employed in
existing studies. Finally, section 6 concludes the pa-
per by presenting perspectives and directions for fur-
ther research.
2 PROBLEM DESCRIPTION
The main challenge of this research is to design a
route planning system for the students, that is able of
seamlessly integrating various modes of SAM within
the multimodal solution of the PT. This includes
the integration of SSAM, which requires availability
nearby, and PSAM, that provides flexibility without
the need for retrieval. We propose to categorize SAM
into two types:
• Heavy SAM (HSAM) corresponds to devices
such as bicycles or scooters, which are not always
allowed on PT and cannot be carried in a bag. For
instance, trains and trams often have designated
areas for hanging bicycles. When these spaces
are full, boarding the train with a bicycle is no
longer permitted. Similarly, during peak passen-
ger traffic times, boarding public transport with an
HSAM may be restricted.
• Light SAM (LSAM) is the rollerblades or skate-
boards, and are devices that are unconditionally
allowed on PT and can be easily combined with
HSAM.
Several assumptions are considered in this work:
1. SSAM lies in the HSAM category.
2. We cannot use two HSAM simultaneously, nor
carry one while using the other.
3. PSAM can be Heavy (HPSAM) or Light (LP-
SAM).
4. Because of assumption 1, 2, and 3, SSAM cannot
be used with HPSAM. Indeed, it is useless for a
user that already have a personal bicycle to rent
another bicycle.
Each student has a specific request type, which
can be categorized as either campus-to-home or
home-to-campus. This distinction allows for tailored
optimization of route planning:
• For a home-to-campus request, the objective is to
maximize the departure time while guaranteeing
arrival at a fixed time, such as the start of classes.
• For a campus-to-home request, the goal is to min-
imize the arrival time while respecting a fixed de-
parture time, such as the end of classes or activi-
ties.
Given that our target audience is students, the re-
liability of routes becomes a crucial consideration for
Multimodal Route Planning Integrating Soft Mobility: A Real-World Case Study for Student Mobility
597
home-to-campus trips, where arrival time is known,
and timely arrival is critical. PT systems are subject to
unforeseen events, such as delays or operational dis-
ruptions, while SSAM systems can also suffer from
reliability issues, such as the unavailability of bicycles
or scooters upon arrival at a station. These uncertain-
ties may result in missed schedules or delayed jour-
neys. Consequently, even a well-planned route may
lead to tardiness. To address this, in addition to depar-
ture time, a ranking of possible routes is performed to
propose the most reliable options. This ranking con-
siders factors such as transport frequency, punctuality,
number of transfers, and available spaces for SSAM.
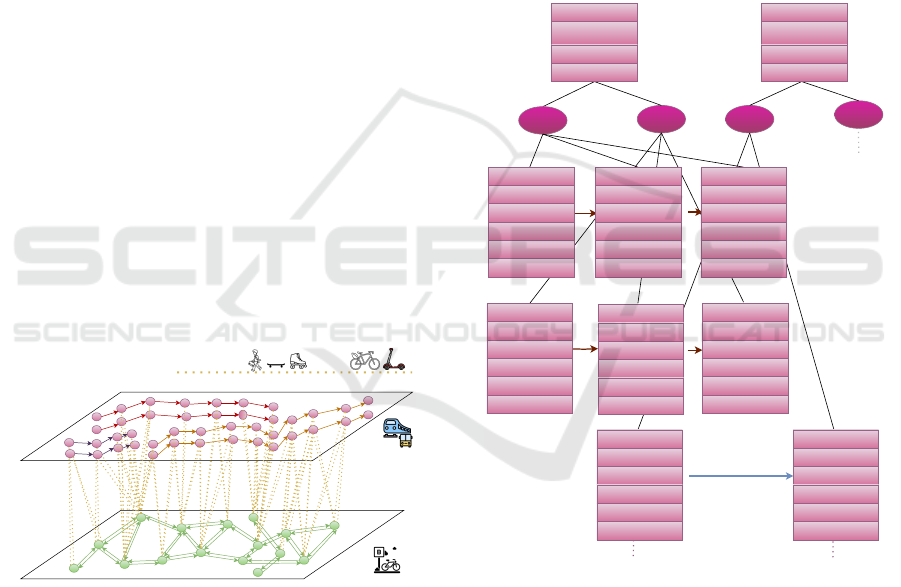
3 MODELIZATION
The proposed model, illustrated in Figure 1, is a di-
rected graph G = (N
PT
∪N
SSAM
, A
PT
∪A
SSAM
∪A
T FR
)
structured into two distinct layers: the public trans-
port layer l
PT
= (N
PT
, A
PT
) and the shared soft and
active mobility layer l
SSAM
= (N
SSAM
, A
SSAM
). Here,
N
PT
and N
SSAM
denote the sets of vertices, while A
PT
and A
SSAM
represent the sets of arcs for their respec-
tive layers. Additionally, a specific subset of arcs
A
T FR
, represented as yellow dotted lines in Figure
1, enables transfers between modes of transport. For
instance, a transfer can occur from a bicycle in the
SSAM layer to a bus in the PT layer, or between a bus
and a train within the PT layer.
e2
e3
e6
e5
e10
e14
e19
e13
e15
e8
e25
e26
e20
e24
e18
e12
e33
e30
e28
e29
e32
e9
e17
e22
e11
e7
e27
e16
e1
e31
e23
e21 e37
e38
e5
e38
b2
b1
b8
b9
b6
b4
b5 b12
b3
b10
b13
b7
s1
s5
s5
e1
e4
e4
e36
e34
e35
b11
PT
SSAM
PSAM : LSAM + HSAM
Figure 1: Representation of the multimodal transportation
network.
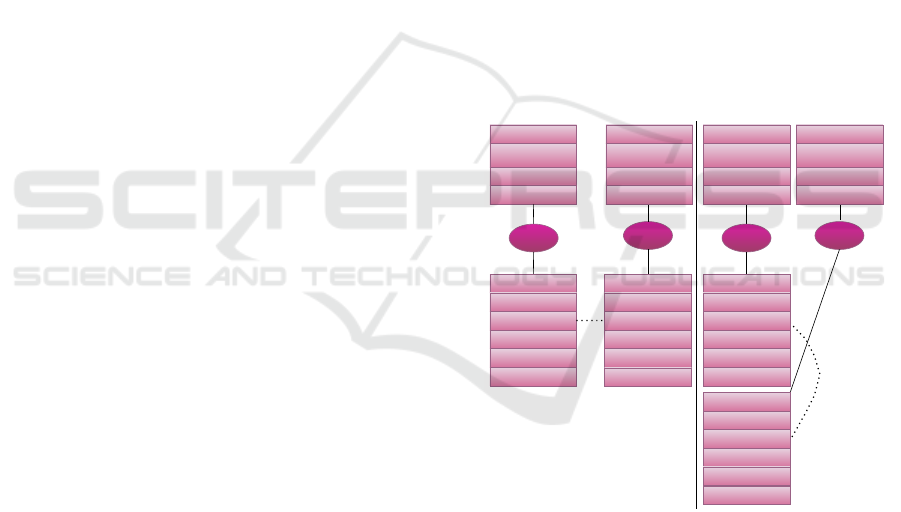
3.1 Public Transport Layer
It represents a time-dependent transportation system
and is structured around predefined events, trip and
routes, as shown in Figure 2. Let be R, T and N
PT
re-
spectively the set of routes, trips and events. An event
n ∈ N
PT
corresponds to an arrival n
arr
and departure
n
dep
times at predefined schedules of a vehicle at a
station n
s
. Each event is associated with a parameter
n
aHSAM
a boolean (true or false) that indicates whether
boarding the vehicle is allowed at this schedule using
a HSAM. Additionally, events are characterized by
a reliability parameter n
rel
, which is detailed further
in Section 4.1. Each event belongs to a unique trip.
A trip t ∈ T is a sequence of events and then corre-
sponds to a specific journey, from station to station at
defined schedules. Finally, each trip follows a unique
route r ∈ R, which corresponds to a specific transit
line r
line
. A route is carried out by a specific type of
vehicle r
type
such as a metro, tram, or bus, and cor-
responds to a path that starts from a departure station
r
start
, stopping at different stations in a predetermined
order, until reaching an arrival station r
end
. We note
r
n
the route to which the event n belongs.
Trip tn
Trip t1
Trip tn
Trip t1
... ...
...
...
...
...
...
...
...
Route r
1
r
type
r
line
Direction(r
start
- r
end
)
Route r
n
r
type
r
line
Direction(r
start
- r
end
)
event n
1
n
s
n
arr
n
dep
n
aHSAM
n
rel
event n
1
n
s
n
arr
n
dep
n
aHSAM
n
rel
event n
1
n
s
n
arr
n
dep
n
aHSAM
n
rel
event n
2
n
s
n
arr
n
dep
n
aHSAM
n
rel
event n
2
n
s
n
arr
n
dep
n
aHSAM
n
rel
event n
n
n
s
n
arr
n
dep
n
aHSAM
n
rel
event n
n
n
s
n
arr
n
dep
n
aHSAM
n
rel
event n
n
n
s
n
arr
n
dep
n
aHSAM
n
rel
Figure 2: Representation of the PT network.
3.2 Shared Soft and Active Mobility
Layer
It captures the stations and potential connections for
shared mobility options such as bicycles and scoot-
ers. N
SSAM
corresponds to the SSAM stations, and
A
SSAM
is the set of arcs between stations. Each sta-
tion n ∈ N
SSAM
is identified by an ID n
id
, and in addi-
tion to its location n
loc
, it has the following attributes:
n
cappick
, which indicates the available capacity for
picking up vehicles, n
capdrop
, which gives the capacity
VEHITS 2025 - 11th International Conference on Vehicle Technology and Intelligent Transport Systems
598
for dropping off vehicles. The values of n
cappick
and
n
capdrop
are dynamically updated in real-time during
each user query, reflecting the actual capacity at the
time of the request. Additionally, each station is char-
acterized by n
type
, which indicates the type of the sta-
tion itself (e.g., bicycle station, scooter station, etc.).
The set of arcs A
SSAM
represents possible transi-
tions between stations. An arc (n
1
, n
2
) ∈ A
SSAM
is
weighted by its travel time τ
SSAM
(n
1
, n
2
). It is an es-
timation of the distance between n
1
and n
2
(using a
route adaptation tool like OSRM) multiplied by the
speed associated to the vehicle type n
1
type
. An edge
(n
1
, n
2
) ∈ A
SSAM
only if:
1. n
1
type
= n
2
type
and n
1
̸= n
2
, meaning that only sta-
tions of the same type are linked. We cannot drop
a scooter to a bicycle station.
2. τ
SSAM
(n
1
, n
2
) ≤ τ
max
, where τ
max
is the maximum
threshold duration, that ensures a device is not
rented for distances considered too far by most
users.
3.3 Transfers Arcs
The management of transfers requires additional ad-
justments to our model. A transfer is the transition
from one mode of transport to another using SAM,
involving a change in the means of transport used to
continue the journey (switch from bus to train), or a
transition into two different route of a same/different
transport type (for example, switch from bus line C1
to bus line E5 or to train n°1235). Instead of adding
a dedicated transfer node, we chose to introduce arcs
between the nodes of different trips when it is feasi-
ble in regards with the operational constraints and the
schedules.
Each arc (n
1
, n
2
) ∈ A
T SF
(the set of transfer arc)
represents the possibility to go from vertex n
1
to n
2
using one or more SAM. Then, arcs are associated
with multiple weights. We note τ
tsam
(n
1
,n
2
)
the time re-
quired to traverse arc (n
1
, n
2
) with the SAM of type
tsam. To generate transfer arcs, and because there
are several constraints to respect that are specific to
HSAM or LSAM, we proceed per stage. First stage,
we generate all feasible arcs with the fastest HSAM
in regard to the constraints. Then we iterate over
type of HSAM to compute weight associated to arcs.
The second stage proceeds identically with LSAM,
but only generates arcs that were not previously cre-
ated during the first step. If the arc already exists,
the LSAM type-specific weight is directly added to it.
Below, the list of constraints to respect according to
the kind of transfers:
First, each arc a ∈ A
T SF
must respect a maximum
threshold duration to avoid transfers deemed too long
(τ
tsam
ts f
(a) ≤ τ
max
). Since the time required to travel an
edge depends on the SAM used, each of which has
specific average speeds, it is possible to reach certain
stations with one type of SAM but not with another.
Similarly, if a station n does not accept HSAM (i.e.,
n
aHSAM
= false), then τ
tsam
ts f
(a) is set to ∞, as transfers
are infeasible in both cases.
We will now describe the various kinds of transfer
that can be performed and their specifics constraints:
Inside PT layer: (n
1
, n
2
∈ N
PT
) to do a transition
from a route to another (r
n
1
̸= r
n
2
). The arrival
time at vertex n
1
plus the time required to go to n
2
must be less or equal to the departure time at n
2
(n
1
arr
+ τ
tsam
(n
1
,n
2
)
≤ n
2
dep
). In addition, if n
1
s
= n
2
s
, the
transfer occurs within the same station. If τ
tsam
(n
1
,n
2
)
is
allowed, then the time considered is τ
walking
(n
1
,n
2
)
. Notably,
even when using a bicycle, transfers within a station
are performed on foot because it is neither permit-
ted nor appropriate to do so by bicycle. Figure 3 il-
lustrates these two cases: an outside-station transfer
(Figure 3a) and an inside-station transfer (Figure 3b).
Route r
i
r
type
r
line
Direction(r
start
- r
end
)
Trip ta
Trip tb
event n
z
n
s2
n
arr
n
dep
event n
y
n
s1
n
arr
n
dep
n
aHSAM
Trip ta
Trip tb
t
t
Route r
j
r
type
r
line
Direction(r
start
- r
end
)
Route r
i
r
type
r
line
Direction(r
start
- r
end
)
Route r
j
r
type
r
line
Direction(r
start
- r
end
)
n
rel
n
aHSAM
n
rel
event n
y
n
s1
n
arr
n
dep
n
aHSAM
n
rel
event n
z
n
s1
n
arr
n
dep
n
aHSAM
n
rel
Figure 3: Representation of Event Transfers within PT layer
outside-station(a) and inside-station(b).
From PT/SSAM to SSAM/PT Stations: (n
1
∈ N
PT
and n
2
∈ N
SSAM
) or (n
1
∈ N
SSAM
and n
2
∈ N
PT
) to
switch from PT to SSAM of any kind in order to reach
the final destination, or a station in PT that is far way
for a light PSAM. In addition, in case of transfer from
SSAM to PT, and if the user wants to keep the SSAM
device with him, n
2
aHSAM
must be true. Indeed, the
user will not be allowed to board in the vehicle during
busy periods. Otherwise, only arcs with light PSAM
are generated. Figure 4 illustrates possible transfer
arcs from a station n
i
in SSAM layer to events related
Multimodal Route Planning Integrating Soft Mobility: A Real-World Case Study for Student Mobility
599
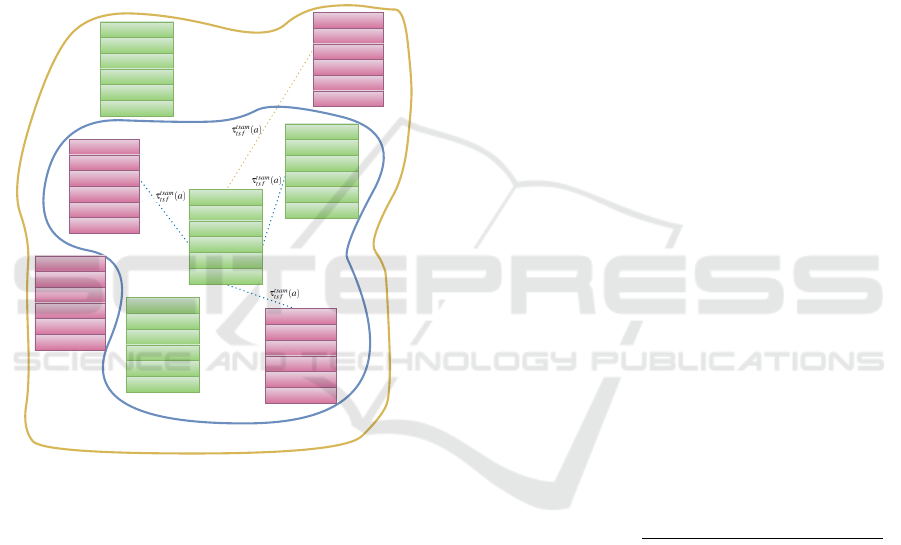
to different stations in PT layer. The fastest LSAM
and HSAM zones represent the maximum distance a
user can travel using LSAM or HSAM, respectively,
within the time threshold τ
max
. Note that station n
2
is accessible using a HSAM since n
2
aHSAM
is true,
whereas this is not the case for station n
1
.
Inside SSAM Layer: (n
1
, n
2
∈ N
SSAM
) to use another
type of SSAM device (n
1
type
̸= n
2
type
). Figure 4 rep-
resents the transfer arcs associated with station n
i
of
type n
i
type1
. We observe that only stations of type2
within the fastest LSAM zone are linked. Indeed, we
chose to not include HSAM in these transfers, as it
would make little sense for a user to rent a bicycle
when they already own and use one.
Fastest
LSAM Zone
Fastest
HSAM Zone
event n
1
n
s1
n
arr
n
aHSAM
=False
n
rel
n
dep
Station n
6
n
id
n
type2
n
loc
n
cappick
n
capdrop
Station n
7
n
id
n
type2
n
loc
n
cappick
n
capdrop
Station n
i
n
id
n
type1
n
loc
n
cappick
n
capdrop
Station n
5
n
id
n
type1
n
loc
n
cappick
n
capdrop
event n
2
n
s2
n
arr
n
aHSAM
={True, False}
n
rel
n
dep
event n
3
n
s3
n
arr
n
aHSAM
=True
n
rel
n
dep
event n
4
n
s4
n
arr
n
aHSAM
={True, False}
n
rel
n
dep
Figure 4: Transfer Arcs in SSAM and PT Layers: Inside
SSAM and Between SSAM and PT Stations.
4 PROPOSED ROUTE PLANNING
ALGORITHM: INTEGRATION
OF SAM WITH RAPTOR
4.1 Description of the Solution &
Objective
The proposed solution is designed to address journey
requests from students, considering their mobility op-
tions and constraints. A student u is characterized by:
• A latest acceptable arrival time (deadline) u
dl
(for
home-to-campus) or a departure time t
dep,u
(for
campus-to-home).
• A personal mobility list u
psam
, which includes
available modes such as HSAM or LSAM. By de-
fault, all students are assigned an LSAM of type
”walking.”
• Departure and arrival locations (u
start
, u
end
), defin-
ing the origin and destination of the journey.
Let be S
u
the set of solutions proposed to the stu-
dent u. A solution s ∈ S
u
is described as a sequence of
events E
u
= {e
1
, e
2
, . . . , e
k
}, which defines the jour-
ney from the starting point to the destination. Each
event e
i
represents a specific action or transition dur-
ing the journey. If the event belongs to the PT layer, it
is characterized by a specific trip t
e
i
, corresponding to
a route r
t
e
i
that defines the transit line and schedule, as
well as the station s
e
i
, with its associated arrival time
t
arr,e
i
and departure time t
dep,e
i
. If the event belongs
to the SSAM layer, it is defined by the mode of trans-
port m
e
i
, such as cycling, along with the start and end
locations s
start,e
i
and s
end,e
i
.
A solution s ∈ S
u
is selected based on the opti-
mization of the journey duration, as described in Sec-
tion 2. Specifically, the optimization focuses on either
maximizing the departure time for home-to-campus
trips or minimizing the arrival time for campus-to-
home trips, while respecting the corresponding time
constraints.
Once the optimal journey in terms of departure or
arrival time has been determined, the total reliability
of the solution is used as a ranking criterion to se-
lect the most robust route. The reliability of a journey
is computed by considering the reliability of public
transport (PT) stations (
∑
F
PT
) and shared soft and ac-
tive mobility (SSAM) stations (
∑
F
SSAM
), penalized
by the number of transport mode changes (N
transfers
),
as defined by Equation (1).
Total Reliability =
∑
F
PT
+
∑
F
SSAM
+ β · N
transfers
N
transfers
+ 1
(1)
In this formulation, β is a positive coefficient that
determines the weight of the penalty applied to the
reliability based on the number of transfers. The reli-
ability of PT stations (F
PT
) is determined as the prod-
uct of a weight α
m
, representing the punctuality of the
specific transport mode m (e.g., metro, train, tram, or
bus), and the service frequency f
′
i
, expressed as the
number of services per hour at a given station. For
SSAM stations, the reliability (F
SSAM
) is calculated
as the ratio between the available capacity (C
available
),
defined as the number of available units (e.g., bicy-
cles or scooters), and the maximum capacity (C
max
),
which represents the total number of units the station
can accommodate.
VEHITS 2025 - 11th International Conference on Vehicle Technology and Intelligent Transport Systems
600
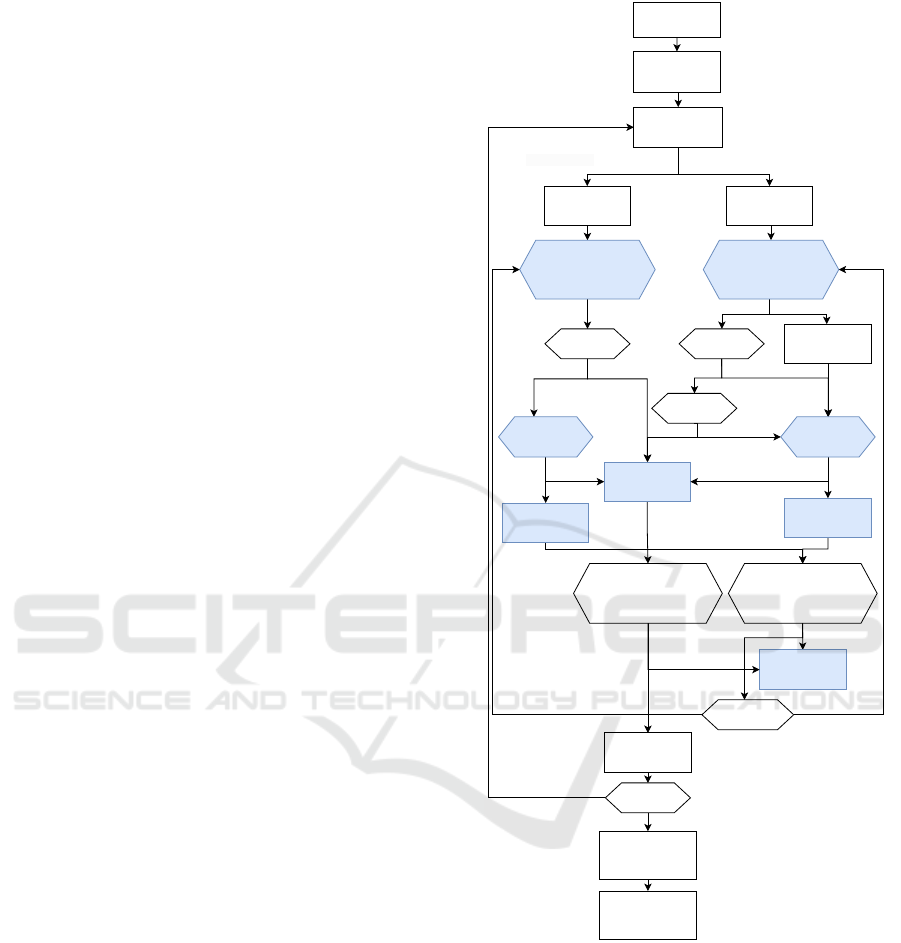
4.2 Resolution Method
Our resolution approach, illustrated by the diagram in
Figure 5, is based on greedy algorithms, with tasks
from the original algorithm depicted in blue and our
contributions shown in white. In our study, we apply
this methodology to the RAPTOR algorithm (Delling
et al., 2015), which is recognized as one of the best
algorithms for public transit networks. RAPTOR op-
erates in rounds, where each round represents a po-
tential transfer. The algorithm traverses each transit
line at most once per round, calculating arrival times
to minimize both travel time and the number of trans-
fers.
In our case, we have enhanced this approach by
integrating the management of soft and active mo-
bility (SAM). The algorithm evaluates specific trans-
fer times based on the mobility modes used, ensuring
a smooth transition between different types of SAM
and public transit. Leveraging this method, our ap-
proach provides feasible and reliable journeys, ad-
dressing the specific constraints of heavy and light
SAM while maintaining the efficiency of RAPTOR
for processing complex networks.
To explain this diagram in more detail, we assume
that each user starts their journey with a PSAM, which
consists of HSAM and LSAM. For each PSAM, the
algorithm calculates a route based on the associated
type of mobility (HSAM or LSAM). If the PSAM is
an LSAM, the algorithm searches for the best route
using both the PT and SSAM layers. Each time the
user passes through an SSAM node, the algorithm as-
signs SSAM = 1 - SSAM. This prevents the algorithm
from proposing routes that pass through SSAM nodes
without taking or dropping off a vehicle, thus avoid-
ing unnecessary transitions. Furthermore, each time
SSAM = 1, the public transport event nodes (n ∈ N
PT
)
must have n
aHSAM
= true, meaning these stations must
allow HSAM onboard. A route is valid if it ends with
SSAM = 0, ensuring that the SSAM is properly re-
turned. If the PSAM is an HSAM, the algorithm uses
only the PT layer and selects only the event nodes
with aSAM = true.
This approach provides optimal routes for each
user by considering the available modes of soft mo-
bility (HSAM or LSAM) and ensuring the necessary
transfer conditions are met.
take PSAM
HeavyMobility(bike, scooter, etc.) LightMobility(walking, Skateboards, etc.)
List PSAM
Start
PSAM = LSAM
SSAM = 0
PSAM = HSAM
SSAM = 1-
SSAM
SSAM nodeTP node
Update the
arrival times for
each station
No
Yes
Ignore the node
No
No
Yes
NoYes
No
Update the
arrival times for
each station
Yes
No
Yes
select the route
No
Yes
No
Return to the most
reliable routes.
Yes
No
End
Yes
Examines the lines
accessible from stations
reached in the previous
round.
Examines the lines
accessible from stations
reached in the previous
round.
Update the
arrival times for
each station
SSAM = 1?aSAM = true ?
Does it improve
the times?
aSAM = true ?
Is the arrival time via
"Calculate Transfer Weights
Between Stations" path
better?
Is the arrival time via
"Calculate Transfer Weights
Between Stations" path
better?
Yes
PSAM = HSAM?
Any other
PSAMs?
Does it improve
the times?
Figure 5: Diagram illustrating the proposed approach.
5 EVALUATION AND RESULTS
5.1 Real-World Data
The data used in this study come from three main
sources for Strasbourg city in France.
Bike-sharing data includes 32 stations located
across the city, with a total of 265 links connecting
stations within a 5 km radius. These stations are
Multimodal Route Planning Integrating Soft Mobility: A Real-World Case Study for Student Mobility
601

equipped with varying numbers of bike docks, and the
data provide insights into the availability of bikes and
docking stations. This network forms the basis for
evaluating the integration of bike-sharing as a trans-
fer mode in multimodal route planning. Additionally,
real-time availability of bikes and docks is obtained
through an API provided by the city of Strasbourg
(Velhop, 2025).
Public transport data for Strasbourg include in-
formation from several sources. GTFS data from the
CTS (Compagnie des Transports Strasbourgeois) net-
work were collected from the national platform for
public transport data in France (Minist
`
ere du parte-
nariat avec les territoires et de la d
´
ecentralisation,
2025b). Additionally, schedules for the TER SNCF
lines were integrated, filtered to retain only sta-
tions within a 100 km radius of Strasbourg (Min-
ist
`
ere du partenariat avec les territoires et de la
d
´
ecentralisation, 2025a). The resulting network in-
cludes 2,513 stops distributed across 115 routes, sup-
porting a total of 31,344 daily trips. It also records
416,124 stop times and 2,418 transfers between stops.
Furthermore, the study uses data collected from
student trips from CESI Strasbourg, comprising a
total of 371,063 instances. This dataset contains rel-
evant information such as the locations of students’
homes and the campus, as well as the course sched-
ules of each student, allowing us to identify the times
when students travel to or from campus. The dataset
includes 987 students, and the selected day, May 21,
2024, shows the highest number of recorded trips,
with 285 trips for the home-to-campus and campus-
to-home journeys.
5.2 Results
For our experimentation, the weights (α
m
) used for
calculating the reliability of public transport (PT) sta-
tions were defined based on the punctuality of specific
transport modes available in Strasbourg. The values
were set as follows: tram = 0.5, bus = 0.25, and train
= 1. It is important to note that there is no metro sys-
tem in Strasbourg, so no α
metro
was considered.
These values were used as approximations while
awaiting real-world data. The actual data will be
derived from the difference between the theoretical
GTFS schedules and the historical GTFS data, which
reflect the real-time operation and delays of the trans-
port system. This will allow for more accurate cali-
bration of the reliability weights (α
m
) in future work.
Table 1 provides a comparison of the different ap-
proaches using real-world data based on three key cri-
teria: the percentage of solutions found (% of Solu-
tions Found), the average journey time (Avg Journey
Time (s)), and the average reliability (Avg Reliabil-
ity).It is important to note that the reliability values
range between 0 and 1, with 1 representing the high-
est possible reliability.
Table 1: Comparison of different approaches in terms of
solution percentage, journey time and reliability.
Approach
% of Sol
Found
Avg Journey
time(s)
Avg
Reliability
PT 93% 2673 0.31
PT + SSAM 93% 1933 0.44
PT + SSAM
+ PSAM
100% 2699 0.51
The results highlight some interesting insights into
the performance of the different approaches. The
slightly higher average journey time for the PT +
SSAM + PSAM approach is explained by the fact that
it considers 100% of the requests, including the 7%
of requests not covered by the other approaches. Be-
cause our approach achieves 100% solution coverage,
it naturally includes more distant locations, which in-
herently require longer travel times.
Furthermore, the fact that the PT + SSAM ap-
proach does not find more solutions than PT alone
is due to the specific context of Strasbourg, where
SSAM stations are generally located close to pub-
lic transport stations. This proximity limits the abil-
ity of SSAM to fill gaps in areas far from public
transport. Nevertheless, the PT + SSAM approach
remains effective in optimizing the average journey
time by leveraging the availability of shared mobility
options near public transport stations.
This demonstrates the effectiveness of integrating
both SSAM and PSAM into the routing methodol-
ogy. Figure 6 provides an example illustrating how
traditional methods (without PSAM) fail to identify
adequate routes for certain complex scenarios. By
incorporating PSAM, our approach successfully pro-
poses efficient and realistic routes tailored to real-
world conditions.
In addition to PSAM, SSAM also led to signifi-
cant route optimizations, providing more effective so-
lutions in terms of travel time and reliability. Figure 7
presents an example where the integration of SSAM
results in improved routes, maximizing the benefits of
shared soft mobility within the multimodal network.
6 CONCLUSIONS
In this study, we proposed an innovative solution for
multimodal route planning tailored to the mobility
needs of students, integrating both shared and per-
sonal soft mobility into public transport systems. By
VEHITS 2025 - 11th International Conference on Vehicle Technology and Intelligent Transport Systems
602
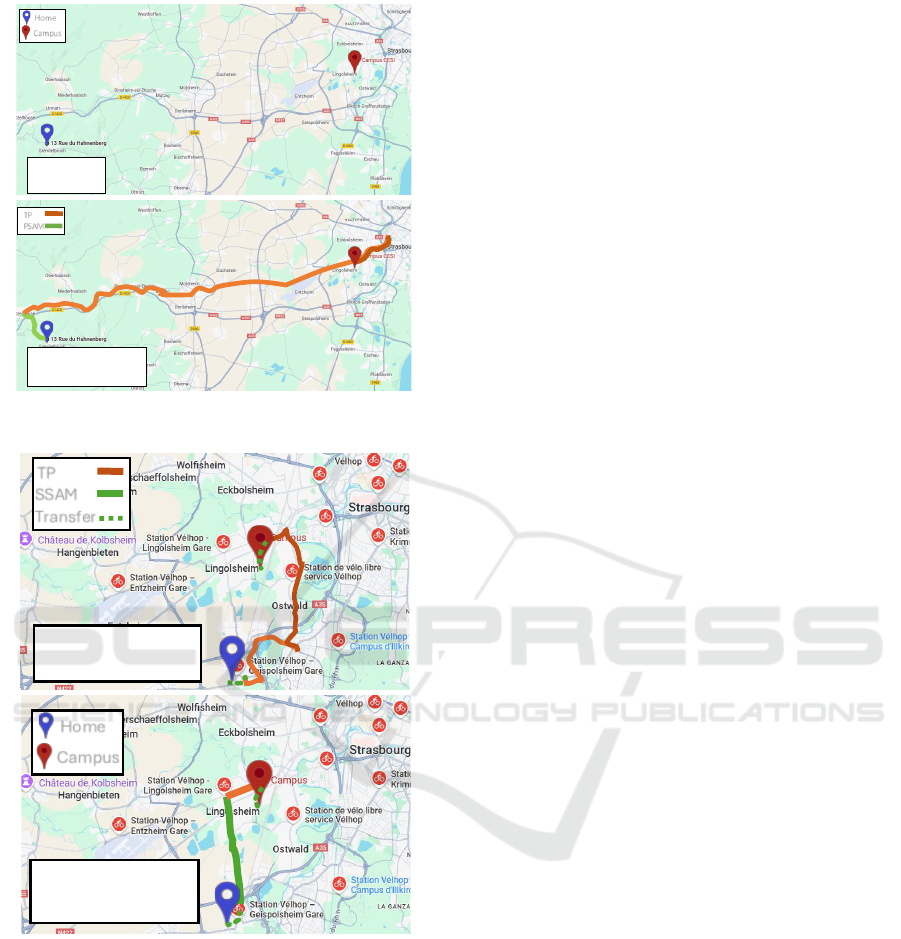
No solution
A feasible and
reliable solution
TP
PSAM
TP
SSAM
Transfer
departure time = 7:43
transfer = 2
Reliability = 0,03
Home
Campus
departure time = 7:50
transfers = 2
Reliability = 0,25
Home
Campus
Figure 6: An example of the limitation of solutions that do
not use PSAM.
No
solution
A feasible and
reliable solution
TP
PSAM
TP
SSAM
Transfer
departure time = 7:43
transfer = 2
Reliability = 0,3
Home
Campus
departure time = 7:50
transfers = 2
Reliability = 0,45
Home
Campus
Figure 7: An example of the difference between a solution
considering the SSAM and one considering only the PT.
focusing particularly on the reliability of journeys,
we aim to provide a comprehensive and practical so-
lution to the challenges faced by students. The ap-
proach also seeks to extend mobility solutions to lo-
cations farther from traditional public transport net-
works. Thus, students living in isolated areas are no
longer forced to rely on personal cars, encouraging a
shift toward more sustainable transport modes. Using
real data from students also allows us to concretely
evaluate the impact of this solution on their daily com-
mutes.
A key direction for future research is to enhance
our approach to reliability by leveraging real-world
data on the punctuality of various transport modes
concerning their schedules. In addition to the tests
conducted in Strasbourg, this project aims to ex-
tend experiments to multiple university campuses
across France, including Paris Nanterre, Rouen, La
Rochelle, Toulouse, and Lyon. This selection will al-
low us to assess the model’s robustness by consider-
ing the diversity of campuses from different perspec-
tives. Expanding the study in this way seeks to ensure
the generalizability of the results and refine recom-
mendations for the broader integration of bike-sharing
as a transfer mode in multimodal route planning.
It would also be relevant to compare the optimized
routes in terms of CO
2
emissions and costs against
traditional transport modes.
ACKNOWLEDGEMENTS
This work has been supported by the Mon trajet vert
project (previously MobE) in the framework of the
French energy saving certificate program (CEE).
REFERENCES
ADEME (2023). Mobilit
´
es actives. https:
//agirpourlatransition.ademe.fr/collectivites/
amenager-territoire/transport-mobilite-durable/
mobilites-actives. Accessed January 2, 2025.
Alessandretti, L., Orozco, L. G. N., Saberi, M., Szell, M.,
and Battiston, F. (2023). Multimodal urban mobil-
ity and multilayer transport networks. Environment
and Planning B: Urban Analytics and City Science,
50(8):2038–2070.
Bast, H., Delling, D., Goldberg, A., M
¨
uller-Hannemann,
M., Pajor, T., Sanders, P., Wagner, D., and Werneck,
R. F. (2015). Route planning in transportation net-
works. MSR-TR-2014-4, Microsoft Research.
Brodal, G. and Jacob, R. (2004). Time-dependent networks
as models to achieve fast exact time-table queries.
Electr. Notes Theor. Comput. Sci., 92:3–15.
Delling, D., Dibbelt, J., Pajor, T., Wagner, D., and Werneck,
R. F. (2013). Computing multimodal journeys in prac-
tice. In Bonifaci, V., Demetrescu, C., and Marchetti-
Spaccamela, A., editors, Experimental Algorithms,
pages 260–271, Berlin, Heidelberg. Springer Berlin
Heidelberg.
Delling, D., Pajor, T., and Werneck, R. F. (2015). Round-
based public transit routing. Transportation Science,
49(3):591–604.
Drouin, N., Deux, R., Chignac, P., Diaz, V., and Delage, A.
(2010). Enqu
ˆ
ete m
´
enages d
´
eplacements - la mobilit
´
e
´
etudiante. Technical report, Universit
´
e de Bordeaux,
Multimodal Route Planning Integrating Soft Mobility: A Real-World Case Study for Student Mobility
603

Bordeaux, France. Report completed in September
2010.
Goel, N., Velaga, N. R., Vedagiri, P., and Mathew, T. V.
(2016). Optimal routing algorithm for large scale
multi-modal transit networks. Transportation Re-
search Procedia.
Horstmannshoff, T. and Ehmke, J. F. (2022). Traveler-
oriented multi-criteria decision support for multi-
modal itineraries. Transportation Research Part C:
Emerging Technologies, 141:103741.
Lienkamp, B. and Schiffer, M. (2024). Column generation
for solving large scale multi-commodity flow prob-
lems for passenger transportation. European Journal
of Operational Research, 314:703–717.
Minist
`
ere du partenariat avec les territoires et de la
d
´
ecentralisation, . (2025a). R
´
eseau national
ter sncf. https://transport.data.gouv.fr/datasets/
horaires-des-lignes-ter-sncf. Accessed January 2,
2025.
Minist
`
ere du partenariat avec les territoires et de la
d
´
ecentralisation, . (2025b). R
´
eseau urbain cts. https:
//transport.data.gouv.fr/datasets/ donnees-theoriques-
gtfs-et-temps-reel-siri-lite-du-reseau-cts. Accessed
January 2, 2025.
Mon Trajet Vert (2025). Mon Trajet Vert: Sustainable and
Multimodal Route Planning. Accessed: 2025-01-02.
Phan, D.-M. and Viennot, L. (2019). Fast public tran-
sit routing with unrestricted walking through hub la-
beling. In Kotsireas, I., Pardalos, P., Parsopoulos,
K. E., Souravlias, D., and Tsokas, A., editors, Analysis
of Experimental Algorithms, pages 237–247, Cham.
Springer International Publishing.
Potthoff, M. and Sauer, J. (2021). Fast multimodal journey
planning for three criteria.
Pyrga, E., Schulz, F., Wagner, D., and Zaroliagis, C. (2008).
Efficient models for timetable information in public
transportation systems. ACM J. Exp. Algorithmics, 12.
Velhop (2025). Data strasbourg. https://data.strasbourg.eu/
api/explore/v2.1/console. Accessed January 2, 2025.
VEHITS 2025 - 11th International Conference on Vehicle Technology and Intelligent Transport Systems
604
