
Using Transformers for B2B Contractual Churn Prediction Based on
Customer Behavior Data
Jim Ahlstrand
1,2 a
, Anton Borg
1 b
, Håkan Grahn
1 c
and Martin Boldt
1 d
1
Blekinge Institute of Technology, 37179, Karlskrona, Sweden
2
Telenor Sweden AB, Karlskrona, Sweden
Keywords:
Churn Prediction, B2B, Machine Learning, Time-Series Data, Telecommunication, Conformal Prediction.
Abstract:
In the competitive business-to-business (B2B) landscape, retaining clients is critical to sustaining growth,
yet customer churn presents substantial challenges. This paper presents a novel approach to customer churn
prediction using a modified Transformer architecture tailored to multivariate time-series data. We suggest
that analyzing customer behavior patterns over time can indicate potential churn. Our findings suggest that
while uncertainty remains high, the proposed model performs competitively against existing methods. The
Transformer architecture achieves a top decile lift of almost 5 and 0.77 AUC. We assess the model’s confidence
by employing conformal prediction, providing valuable insights for targeted anti-churn campaigns. This work
highlights the potential of Transformers to address churn dynamics, offering a scalable solution to identify
at-risk customers and inform strategic retention efforts in B2B contexts.
1 INTRODUCTION
Retaining clients is essential in the competitive
business-to-business (B2B) landscape. Customers
discontinuing their services or switching to competi-
tors, known as churn or customer attrition, poses sig-
nificant challenges for businesses (Ahn et al., 2020).
Churn can occur for various reasons, such as dissatis-
faction with the service or product, better offers from
competitors, changes in client needs, or stagnation
in added value. Compared to business-to-consumer
(B2C), B2B churn is often more complex and costly,
given the smaller customer base and higher value of
individual contracts (Tamaddoni Jahromi et al., 2014;
Janssens et al., 2022).
This article delves into the intricacies of churn
within the B2B context, highlighting some of the
challenges for predicting churn to maintain business
growth. The hypothesis is that customer churn is pre-
dictable by examining the customers’ changing be-
havior over time (Mena et al., 2019). Furthermore, we
evaluate the hypotheses using real-world telecom data
and conformal prediction, demonstrating that product
a
https://orcid.org/0000-0002-0179-5090
b
https://orcid.org/0000-0002-8929-7220
c
https://orcid.org/0000-0001-9947-1088
d
https://orcid.org/0000-0002-9316-4842
usage does provide a churn signal, although unreli-
able in practice.
With a minor change to the Transformer architec-
ture, we are able to train the model directly on mul-
tivariate time series data, hence reducing the need
for feature engineering. The proposed Transformer
model shows an impressive learning capability. How-
ever, it fails to fully capture the rarity of customer
churn, and the precision drops when evaluated on
a real-world customer base. Implementing churn
prevention targeting in this state is anticipated to
be ineffective in mitigating customer attrition. The
low precision suggests a high likelihood of misalign-
ment with intervention targeting, potentially lead-
ing to unpredictable and costly campaigns (Tamad-
doni Jahromi et al., 2014). We employ conformal
prediction (Shafer and Vovk, 2008) to calibrate the
model and analyze the uncertainty over the validation
dataset, exposing unreliable outcomes. We also in-
vestigate how conformal prediction performs based
on churn risk. Conformal prediction provides un-
certainty estimates for each predicted data point, al-
lowing corporations to focus specifically on the data
points with the highest certainty in the predictions. It
is also easier to perform a risk-reward analysis based
on the cost of incentives. Our results indicate that the
use of conformal prediction could be a valuable addi-
tion to churn prediction in an industrial setting.
562
Ahlstrand, J., Borg, A., Grahn, H. and Boldt, M.
Using Transformers for B2B Contractual Churn Prediction Based on Customer Behavior Data.
DOI: 10.5220/0013432500003929
In Proceedings of the 27th International Conference on Enterprise Information Systems (ICEIS 2025) - Volume 1, pages 562-571
ISBN: 978-989-758-749-8; ISSN: 2184-4992
Copyright © 2025 by Paper published under CC license (CC BY-NC-ND 4.0)

2 BACKGROUND
2.1 Definition of Churn in B2B
Within the context of B2B telecommunication cus-
tomers, churn refers to the phenomenon of not renew-
ing contracts when they expire. Individual subscrip-
tions may be added or terminated (product churn)
within the contract lifetime without necessarily be-
ing considered customer churn. In this study, we ana-
lyze Telecom mobile subscription churn for B2B con-
tracts. This detailed approach also allows for flexibil-
ity in aggregating churn risk across the entire contract
or specific segments.
2.2 Importance of Churn Management
for Business Growth
Predicting and preventing churn is essential for sus-
taining and growing a B2B business (Janssens et al.,
2022). High churn rates can significantly impact rev-
enue, given the substantial acquisition costs and high
contract value of B2B clients (Gattermann-Itschert
and Thonemann, 2022; Chen et al., 2015). Moreover,
losing a client can have a ripple effect, influencing
the perceptions of potential and existing customers.
Understanding the underlying causes of churn can in-
form improvements in product offerings, customer
service, and overall business strategies, fostering a
culture of continuous improvement and growth. Ef-
fectively managing churn can be a vital differentia-
tor in saturated markets (Mena et al., 2019; Wei and
Chiu, 2002). Businesses with a proactive stance can
lead to more robust market positions and increased re-
silience against industry fluctuations.
Acquiring new customers involves significant
costs, such as marketing campaigns, promotions, and
outreach strategies to attract potential clients. In con-
trast, retaining existing customers requires maintain-
ing high-quality service, engaging with loyal cus-
tomers, and building strong relationships that promote
repeat business. While existing customers are already
familiar with your products, consistently exceeding
their expectations can be as challenging and expen-
sive as acquiring new customers.
Modeling churn from usage data relies on the
premise that businesses can observe the behaviors
that lead to churn. Usage data may uncover pat-
terns and trends in how customers interact with ser-
vices or products correlated with churn. These predic-
tive models may act as an early warning and identify
at-risk customers before they decide to leave, allow-
ing for targeted interventions. For telecommunication
companies, this often involves tracking mobile sub-
scription metrics, such as the number of calls made
and the amount of data used. This set of features can
be considered a metric for customer health.
2.3 Voluntary vs. Involuntary Churn
Voluntary churn refers to the situation in which a cus-
tomer independently decides to terminate their rela-
tionship with a business (Park and Ahn, 2022). This
decision may be influenced by various factors, in-
cluding dissatisfaction with the product or service,
the availability of more attractive offers from com-
petitors, or evolving needs that the current provider
does not adequately address. Conversely, involuntary
churn occurs when the termination of the relationship
is driven by external factors beyond the customer’s
control (Park and Ahn, 2022). Circumstances such
as payment failures, business closures, policy viola-
tions, or corporate mergers can all lead to involuntary
churn. This churn often arises without prior warning
and can be significantly more challenging to identify
in data compared to voluntary churn. The target for
this study includes both types, i.e., involuntary and
voluntary.
2.4 Contractual vs. Non-Contractual
Churn
A business may include contractual and non-
contractual products, so it’s essential to differen-
tiate between them when defining the churn tar-
get (Gattermann-Itschert and Thonemann, 2022).
Non-contractual churn occurs when customer trans-
actions do not follow a fixed contract or subscription
model. Measuring this type of churn can be chal-
lenging, as the absence of a formal agreement com-
plicates the definition of churn (Reinartz and Kumar,
2003). Regular purchasing patterns that cease after
some determined threshold are often used as an in-
dication of non-contractual churn (Ahn et al., 2020;
Tamaddoni Jahromi et al., 2014). Conversely, con-
tractual churn applies to businesses that operate on a
subscription or contract basis. This form of churn oc-
curs when a customer opts not to renew their contract
upon expiration or chooses to terminate the contract
prematurely (Ahn et al., 2020). This article will ex-
clusively examine contractual churn in the context of
B2B customers.
2.5 Risk vs. Uplift
Both risk and uplift methods are statistical techniques
that help businesses understand and address customer
Using Transformers for B2B Contractual Churn Prediction Based on Customer Behavior Data
563

churn more effectively. Churn risk models are de-
signed to identify customers at risk of leaving. Com-
panies may employ these to improve customer ex-
periences by analyzing patterns and behaviors cor-
related with churn. In contrast, churn uplift models
focus on reducing customer attrition by determining
the most effective treatment and strategy for retaining
customers (Ascarza, 2018; Tamaddoni Jahromi et al.,
2014). However, in this context, we cannot verify the
accuracy of lift metrics as we do not have access to
the outcomes of retention campaigns. Hence, we fo-
cus on churn risk modeling to understand and predict
customer churn.
3 RELATED WORK
Previous work has investigated B2B customer churn
prediction using sequential LSTM and GRU mod-
els on time series data aggregated by customer and
week (Ahlstrand et al., 2024). The results indicated
potential in detecting reliable churn signals. However,
the signals were only significant within one week
ahead. In the present study, we suggest extending this
work by using more granular data. This is done in
two ways: using a daily frequency and without ag-
gregation, i.e., individual subscriptions. These pre-
dictions can then later be aggregated on a customer
level to produce a churn risk scoring for B2B cus-
tomers. Another change is using the Transformer ar-
chitecture to embed the time series sequences. Trans-
formers scale better and have superior attention to sig-
nals over larger context sizes compared to LSTM and
GRU (Islam et al., 2024), which was used in the pre-
vious work.
Usage data has demonstrated promising
results in enhancing customer churn predic-
tions (Sanchez Ramirez et al., 2024; Somosi
et al., 2021; Ascarza and Hardie, 2013; Wei and
Chiu, 2002). Despite this, there has been less
attention on the B2B segment (Tamaddoni Jahromi
et al., 2014) and limited effort to utilize time-series
data directly (Ahmadi and Hasheminejad, 2021; Ahn
et al., 2020). (Ascarza and Hardie, 2013) employs
a hidden Markov model to segment the customer
base and predict paths to death (churn). However,
we find the Markov process problematic because it
only takes into account the current state of affairs,
whereas churn can be the result of long sequences of
events. (Mena et al., 2019) use LSTM to learn churn
risk probabilities and utilize the output as a feature
in their static model. They report Top Decile Lift
(TDL) scores of up to 4.2 and AUC scores of up to
0.78. In a follow-up study, (Mena et al., 2024) shows
that using time-varying features with a recurrent
network improves churn prediction performance and
does work well without static features. This time
they report a TDL of up to 5.5 and AUC of up to
0.84. However, contrary to our findings, they do
not find that Transformers improve the performance
compared to other recurrent networks. It is important
to note that the results cannot be directly compared
due to the absence of any public time-series data sets
available for a fair comparison.
Most related studies have focused on engineered
features derived from usage data. There is also a
divide between papers investigating contractual and
transactional settings; Table 1 shows the literature or-
ganized into sections. Most related works acknowl-
edge customer churn as a rare event but do not thor-
oughly investigate performance under class imbal-
ance and the effects of predicting rare events. (Gür Ali
and Arıtürk, 2014) investigate the issue with rare
event classification in the churn domain and propose
multiple training data (MTD) as a strategy for in-
creasing the positive samples, hence improving the
balance between churn and non-churn and predictive
performance. However, they use logistic regression
and decision trees to model churn; hence, they do not
fully exploit the sequential dependencies in time se-
ries data.
4 METHOD
4.1 Data Collection
Usage data includes several key metrics such as fre-
quency, which tracks how often users engage with
the subscription service, and intensity, which mea-
sures how it was used (Sanchez Ramirez et al., 2024;
Wei and Chiu, 2002). Interactions refer to communi-
cation between customers and companies, e.g., cus-
tomer support. Firmographic data encompasses vari-
ous attributes related to organizations. This may in-
clude contract details, company size, location, rev-
enue, and employee count. Collecting and analyz-
ing firmographic data may help to distinguish cus-
tomers and provide a richer context. Sentiment values
have shown to be beneficial in churn prediction (Wang
et al., 2018; Kumar et al., 2024). In this study,
we therefore included support ticket sentiment val-
ues, which were extracted using the Vader sentiment
framework (Hutto and Gilbert, 2014).
This study used a mixture of usage data, firmo-
graphic data, transactions, and interactions. Table 2
shows the mix of available features used to assem-
ble the subscription time series. The data is based
ICEIS 2025 - 27th International Conference on Enterprise Information Systems
564

Table 1: Related work organized by segment, business model, and use of time series data.
Paper Segment Business model Usage- Time- Balancing Industry
B2B B2C Contr. Trans. data series
Sanchez Ramirez
✓ ✓ ✓ Class weight Software & services
et al., 2024
Mena et al., 2024 — ✓ ✓ Undersample Finance
Gattermann-Itschert
✓ ✓ Class weight Wholesale trade
& Thonemann, 2022
Mena et al., 2019 — ✓ ✓ Undersample Finance
Gür Ali & Arıtürk
✓ ✓ ✓ MTD+SMOTE Private banking
2014
Ascarza & Hardie
✓ ✓ ✓ — —
2013
This paper, 2025 ✓ ✓ ✓ ✓ Undersample Telecom
on mobile subscription usage for B2B customers in
Sweden and the interactions and firmographic data of
each customer. Customer features, e.g., the number of
employees and industry, are applied to all of the cus-
tomers’ subscriptions. The number of ongoing churns
varies over the dataset but is within the interval 1.5%
and 2.5%, making churn a rare event.
We normalized all features independently to the
range 0-1. The upper bound had to be defined for the
non-categorical values such as lifetime. The upper
bound was manually set by inspecting the distribution
and choosing an appropriate cutoff value. Tracking
the exact value doesn’t add much more information
after some point. There were a few missing days in
the dataset. These can be ignored as we have both
day-of-the-week and week numbers, which position
the data in the global context. The revenue was trans-
formed to represent the percentage difference from
the daily mean, which was necessary to make it sta-
tionary and limit the value to the interval -1 to 1. All
values are collected daily. However, not all sources
are updated daily. The firmographic features are up-
dated quarterly or yearly, meaning they are mostly
constant. Finally, all duplicates and training examples
with zero variance were removed.
To ensure the accuracy and privacy of the data
collected, domain experts validated the correctness
of each feature, and all customer identifiers were
anonymized by hashing with a random salt that was
thrown away post-data collection.
4.2 Transformer Architecture
The model is based on a Transformer architecture
with adaptions to fit multivariate time-series data bet-
ter (Vaswani et al., 2017). Specifically, we replaced
the token embedding with one-dimensional depth-
wise convolution, which up-scales the input to the de-
Table 2: Time series subscription features where “Re-
quested term” is the dependent/target variable in the exper-
iments, i.e., churn. Features inherited from the customer
level are marked with a *.
Variable Description
Weekday Day of week
Week Week number
Price Price category
Lifetime Days since activation
Binding Days of binding remaining
Calls Have calls been made?
Data Data consumption
ARPU Revenue
Employees* Number of employees
Industry* Main industry
Discount* Customer with discount offer
Contract lifetime* Days since contract activation
Contract lifespan* Days until contract expires
Total cases* Number of support tickets
Sentiment* Sentiment value of tickets
Requested termination Subscription termination
sired number of channels, similar to the implementa-
tion by Informer (Zhou et al., 2021). Because most
inputs are a real number between 0 − 1, a simple em-
bedding lookup table won’t work. This change suc-
cessfully embedded the sequential multivariate input
features, which allowed the multi-headed attention
blocks to produce sequence embeddings. Finally, the
attention output is averaged into a linear layer with
sigmoid activation to predict whether the subscription
will churn in the next step. Hence, the network is an
encoder-only Transformer with a binary classifier, as
illustrated by figure 1.
4.3 Training
We used PyTorch to build the architecture, optimizer,
loss, and training loops (Paszke et al., 2019). As
Using Transformers for B2B Contractual Churn Prediction Based on Customer Behavior Data
565
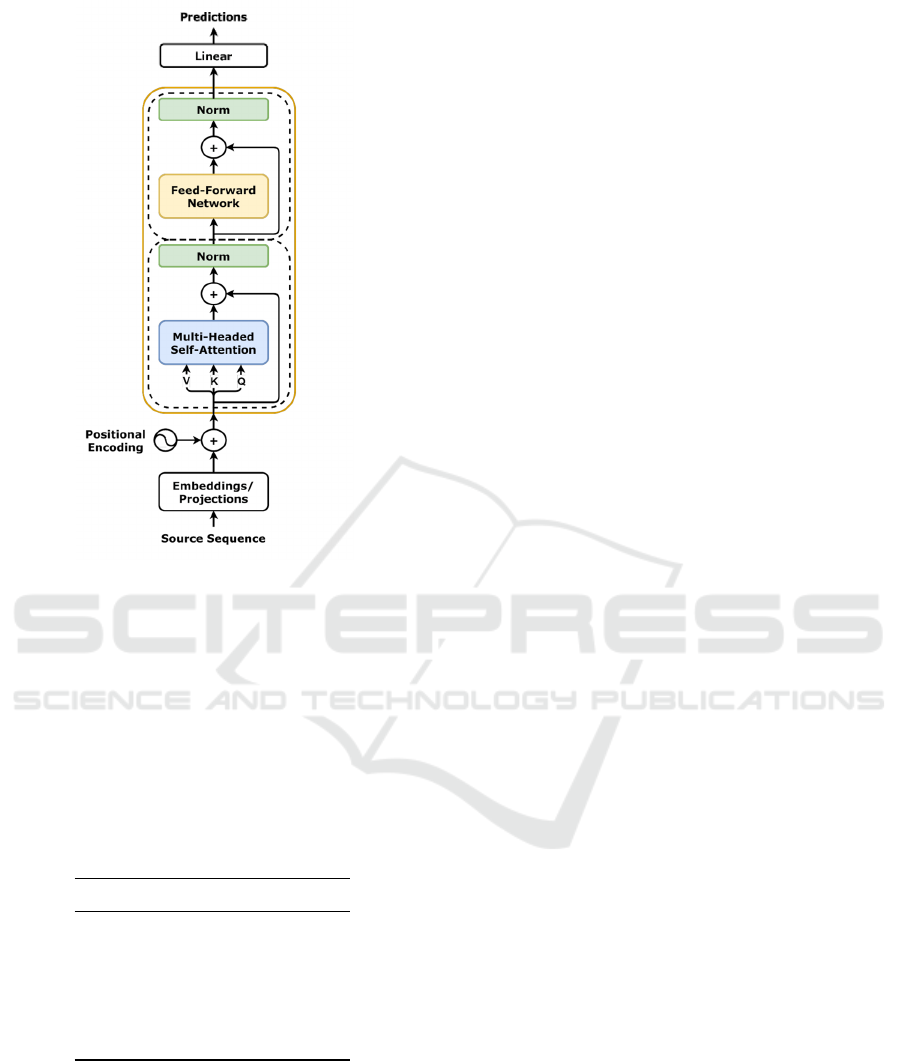
Figure 1: Transformer model architecture. Image source
https://github.com/dvgodoy/dl-visuals
the target is a binary variable, we selected the binary
cross-entropy loss with an Adam optimizer. Table 3
shows the hyperparameters and their values; all other
hyperparameters use the default settings defined by
PyTorch. The resulting model only consists of 840k
parameters. The hyperparameters were chosen with
efficiency in mind, as larger networks did not seem
to improve performance. Keeping the network small
allowed for faster training and inference times.
Table 3: Hyperparameters and their values.
Parameter Value
Hidden size 128
Number of heads 16
Number of layers 8
Embedding dimension 128
Sequence length 120
Dropout 0.15
The customers were divided into the following
three groups using a random sampling strategy: train-
ing (75%), calibration (10%), and validation (15%).
The subscriptions of each customer were extracted
from the time-series data and processed using a slid-
ing window of 120 days and a stride of 5 days to cre-
ate the datasets. The dataset used for training was also
class-balanced by selecting all examples of churners
(the minority class) and an equally large uniform ran-
dom sample of non-churners, which removes many of
the negative samples. We experimented with a dy-
namic undersampling, which samples a new set of
non-churners for each training epoch and a higher ra-
tio of negative samples using a class-weight approach.
However, neither had any significant effect on the fi-
nal results. We limited the validation dataset to con-
tain only the same subscription once and selected only
the last 120 days before termination from each sub-
scriber. The calibration data is used post-training to
fit the conformal prediction system and, therefore, is
never seen by the model.
To prevent excessive sampling of the same cus-
tomer, we established two constraints. First, we used
a stride of 5 days between windows. Secondly, we
limited the maximum days after a churn is registered
to half the size of the sequence length, as we want
the model to learn behaviors leading up to termina-
tion. The dataset contains 215 days of recorded data,
resulting in 1, 100, 000 examples for training (where
≈ 16, 000 are churns), 250, 000 examples for valida-
tion, and 150, 000 for calibration.
4.4 Calibration
Conformal prediction is a calibration method in ma-
chine learning that ensures the predicted probabilities
are statistically valid and align closely with the actual
outcomes. This process uses a dedicated calibration
dataset, a subset specifically reserved for refining the
model’s predictions. A conformal classifier generates
prediction regions guaranteed to contain the true la-
bel by a user-specified probability (Shafer and Vovk,
2008; Angelopoulos and Bates, 2021). To calibrate
the model, we used the Crepes framework (Boström,
2022). Specifically, we calibrate a Conformal Predic-
tive System using the Wrap Regressor method. To
normalize the model and make the coverage adaptive,
we used a difficult estimator (i.e., a heuristic score for
the difficulty of a given example). An adaptive cover-
age provides a prediction interval conditioned on the
input, which provides more information on the true
model uncertainty. Two difficulty estimators were in-
vestigated. First, using the Monte-Carlo dropout vari-
ance, which has been shown to produce estimations of
uncertainty (Gal and Ghahramani, 2016), and second,
using the Euclidean distance to the k-nearest neigh-
bors (Pedregosa et al., 2011), where k = 5, using the
sequence embeddings produced by the model.
During calibration, the non-conformity scores are
computed for each point in the calibration set us-
ing the model. The calibrated model can then pro-
vide more accurate and well-calibrated confidence
ICEIS 2025 - 27th International Conference on Enterprise Information Systems
566

estimates for future predictions, thereby improving
decision-making processes based on these predic-
tions. Overall, model calibration using the Confor-
mal Prediction enhances the performance and instills
greater trust in the outputs by ensuring that the pre-
dicted probabilities accurately reflect the likelihood
of various outcomes. These properties are essential
for decision-making and for efficiently targeting in-
terventions in the context of churn.
4.5 Evaluation Metrics
Precision, Recall, and F
1
-score are standard metrics
to measure and evaluate the performance of machine
learning models (Witten et al., 2016). Both precision
and recall are informative metrics, especially when
dealing with rare event predictions such as customer
churn. Precision, or the positive predictive value, tells
us the number of true positives over the total number
of predicted positives. Recall, or the true positive rate,
tells us the probability of detecting a positive value,
i.e., the number of true positives over the entire pop-
ulation of positives. All three metrics are commonly
employed to evaluate machine learning models.
In the context of customer churn prediction, it is
perhaps more likely to encounter the Area Under the
Receiver Operating Characteristic (AUROC) curve
and Top Decile Lift (TDL) metrics (Mena et al., 2019;
Mena et al., 2024; Gattermann-Itschert and Thone-
mann, 2022; Sanchez Ramirez et al., 2024; Gür Ali
and Arıtürk, 2014; Devriendt et al., 2021; Neslin
et al., 2006). The Receiver Operating Characteristic
(ROC) is a plot of the relation between the true pos-
itive rate (sensitivity) and the false positive rate (1-
specificity) (Fawcett, 2006). ROC curve is indepen-
dent of thresholds, which is important when higher
costs are associated with either outcome. The area un-
der the ROC curve gives an overall metric where 0.5
equals a random guesser, and 1.0 is a perfect model.
Lift is the relative segmentation performance of a
model compared to the population baseline. The TDL
metric refers to the model lift in the top 10% segment
based on some targeting strategy. In the context of
churn prediction, the targeting strategy is commonly
based on the models’ estimated churn risk. We ar-
gue that TDL can be misleading in the context of rare
events as it does not take false positives or interven-
tion costs into account. Consider the case where you
have 1000 samples with 50 true positives (5% base-
line, B). If the top decile (100 samples) contains 20
true positives (target response, T ) and 80 false pos-
itives, the lift would be 4 (1), i.e., the top decile is
4 times more likely to contain true positives than the
population baseline. However, the 80 false positives
are disregarded. TDL also makes no assertions about
model certainty, which is crucial for targeting. De-
pending on the application and the cost of false pos-
itives, targeting customers based on risk alone may
be unproductive as risk does not infer that the cus-
tomer is responding to treatments and hence cannot
be retained (Ascarza, 2018; Devriendt et al., 2021).
However, we include TDL in this study to facilitate
the comparison with related work.
li f t =
P(T |B)
P(T )
=
20
100
50
1000
= 4 (1)
5 RESULTS
The model was trained for 15 epochs with a learn-
ing rate of 0.001, which takes less than an hour. Ta-
ble 4 shows the evaluation metrics during training and
evaluation. The training dataset is class-balanced us-
ing a simple uniform undersampling, while the vali-
dation dataset is left unbalanced to represent a real-
world scenario. There is a significant difference in
performance when the model is exposed to the vali-
dation dataset where ≈ 1.3% are churners. Note that
the evaluation is based on a strict definition of true
positive, i.e., only when the termination request has
been made and the model predicts a churn rate above
0.5 will count as a true positive.
Table 4: Performance evaluation on training (balanced) and
validation dataset with a strict TP definition.
Metric Training Validation
F
1
-score 0.935 0.286
Precision 0.923 0.217
Recall 0.964 0.419
AUROC 0.982 0.766
5.1 Conformal Prediction Evaluation
The size of the calibration dataset was reduced to
10240 examples. All positive churn examples were
included (≈ 2000 examples), the rest consisted of
negative samples. The calibration set was then used
as input to the Conformal Predictive System to con-
struct the calibrated model. The calibrated model was
evaluated using a confidence level of 0.9 (α = 0.1).
Table 5 shows the error and efficiency of the confor-
mal prediction with different difficulty estimations.
Efficiency in the crepes framework is based on the
mean size of the prediction interval for regression
tasks, i.e., less is better in this case. We see a dif-
ference depending on the choice of difficulty estima-
Using Transformers for B2B Contractual Churn Prediction Based on Customer Behavior Data
567
tion, where dropout is the most efficient, but the em-
bedding method has the least errors. However, the
evaluation shows that all intervals, with a 90% confi-
dence, are very large, mostly covering the entire pos-
sible range of 0-1.
Table 5: Conformal prediction evaluation using a confi-
dence level of 0.9 with different difficulty estimators. The
best values are in bold.
Difficulty estimator Error Efficiency
None 0.055 0.974
Dropout 0.053 0.496
Embedding 0.049 0.795
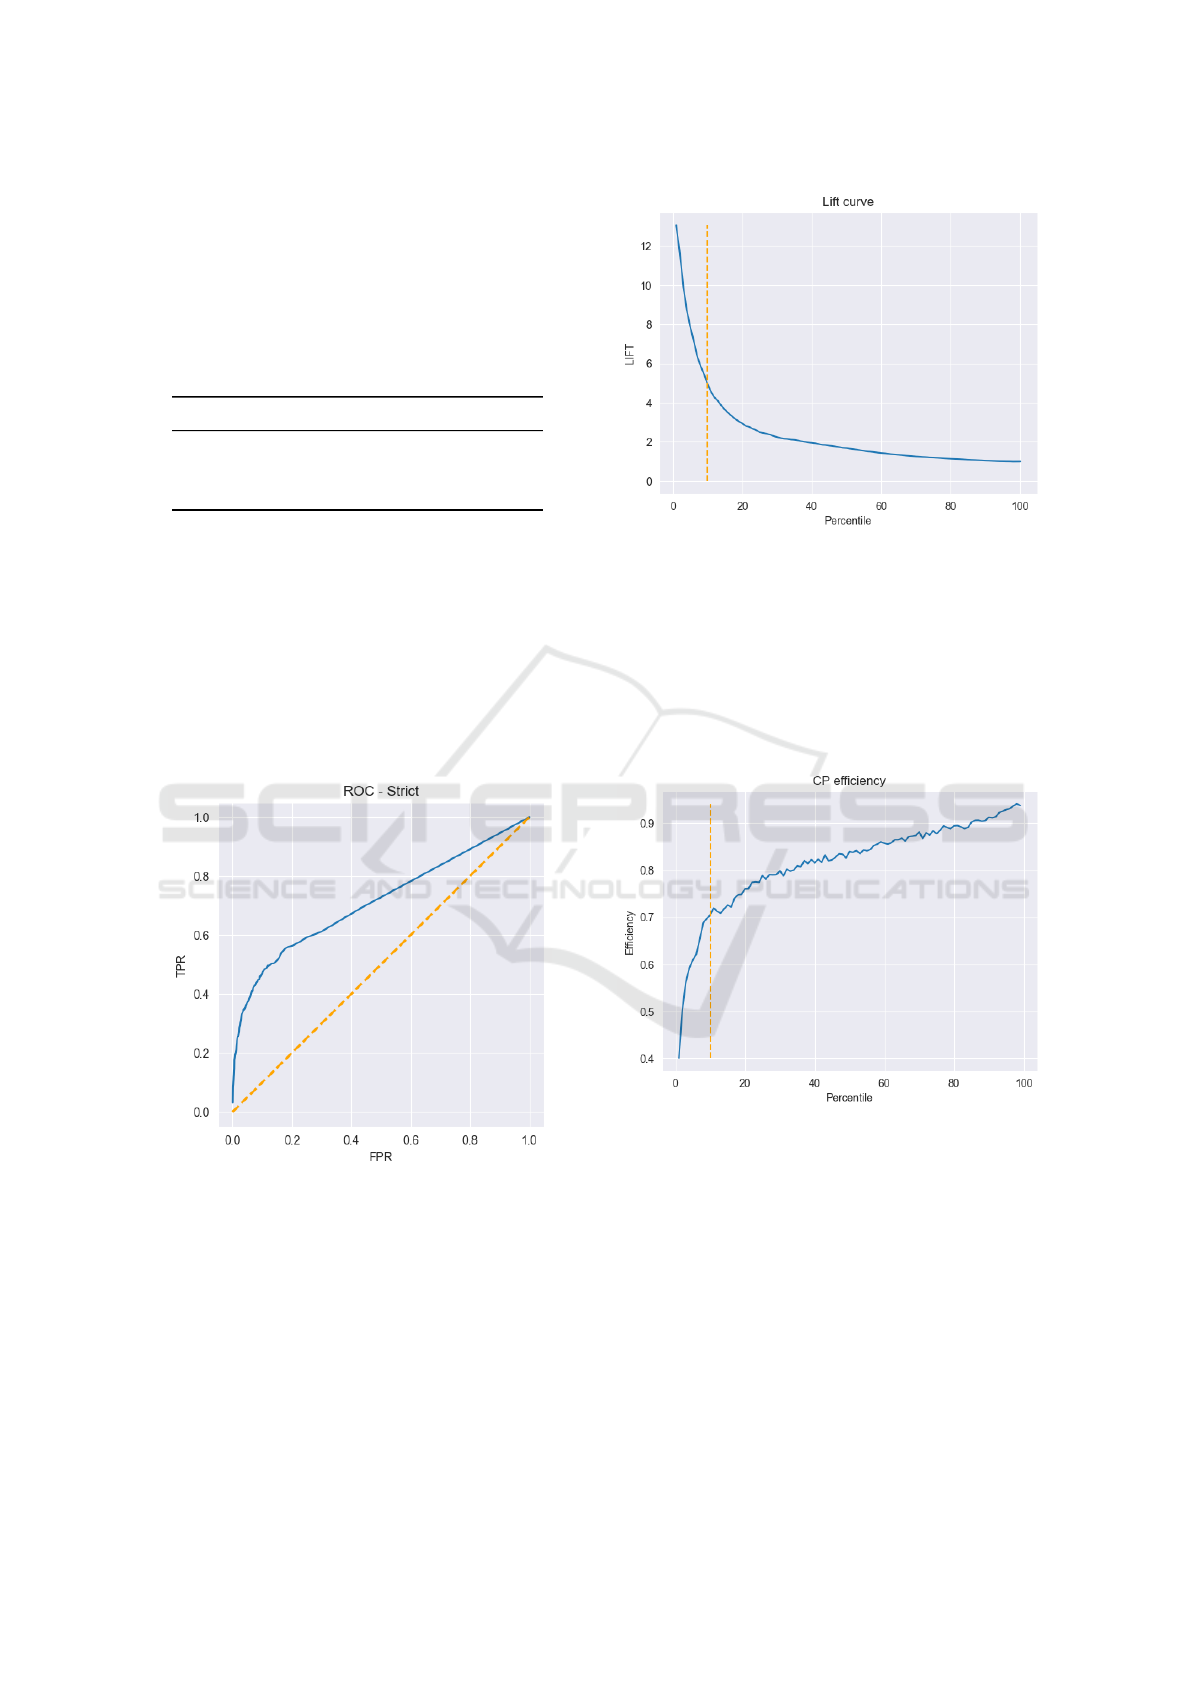
5.2 ROC & TDL
Plotting the ROC curve, illustrated in Figure 2, shows
that the model is able to separate the rare positive
events from the negative events. The ROC is evalu-
ated using the unbalanced validation dataset, the same
as the previous metrics. A business may use the ROC
curve to determine the threshold that balances sensi-
tivity and specificity according to the specific appli-
cation.
Figure 2: The solid line shows the receiver operating char-
acteristic curve for the Transformer model. A random
guesser is shown using a dashed line.
The model achieves a TDL of 4.943 on the valida-
tion dataset, i.e., the model finds almost 5 times more
churners than the baseline when targeting the top 10%
based on churn risk. In Section 4.5, we discussed the
potential risks associated with its use for targeting.
The lift curve is illustrated in Figure 3, which also
marks the top decile.
We also analyzed the efficiency of the confor-
Figure 3: Lift curve based on the percentile of the popula-
tion targeted. The top decile (10%) is marked with a dashed
line.
mal prediction system by percentile. Efficiency is
the average prediction interval size, i.e., lower is bet-
ter. Figure 4 shows that the efficiency is better at the
top decile compared to larger segments. This indi-
cates that the model is more certain of the outcome in
higher churn rankings.
Figure 4: Conformal prediction efficiency by percentile of
the top-ranked churners. Evaluated using 90% confidence.
The top 10% decile is marked with a dashed line.
6 DISCUSSION
Our findings suggest that while uncertainty remains
high, the proposed model performs competitively
against existing methods. The Transformer architec-
ture achieves a TDL of almost 5 and 0.77 AUC. This
can be compared to reported TDL between 4.2 − 5.5
and AUC between 0.78 − 0.82 (Mena et al., 2019;
Mena et al., 2024).
ICEIS 2025 - 27th International Conference on Enterprise Information Systems
568

The results from both the model and conformal
prediction evaluation show that the uncertainty is gen-
erally high, i.e., there are not enough signals in the
data to exclusively identify churning behavior. There
are useful segments in the top percentiles that include
many of the true positives. However, the same seg-
ments also include many false positives. The more
training epochs the model undergoes, the more over-
fitted it becomes toward the obvious churn risks,
which can be problematic as these customers may be
resistant to all anti-churn treatments available. The
additional layer of confidence provided by confor-
mal prediction aids in better decision-making and
may reduce the risk of targeting lost causes. Fig-
ure 4 shows the efficiency of the top-ranked churn-
ers. Although it is still unclear whether these partic-
ular high-risk and high-certainty targets are respon-
sive to anti-churn campaigns, the prediction interval
indicates the certainty of the churn prediction. While
high-risk churn customers can be identified, the ap-
propriate anti-churn treatment is not given, and these
might be different between customers. A root cause
analysis of churn factors could provide more insight
but was not investigated in this paper.
Behaviors such as reduced usage or engagement,
complaints, or changes in client communications may
be indications that a customer is about to churn. How-
ever, it is unlikely that a single definitive event will
cause customers to change their opinions and decide
to churn. The underlying cause is likely a series
of events where the company did not meet the cus-
tomers’ expectations over time. In a B2B setting, con-
tracts typically last for several years, which makes it
difficult to pinpoint exactly when customers decide
not to renew. As a result, there may be several months
between when a customer decides to leave and when
this decision appears in the data.
The proposed changes to the Transformer archi-
tecture have not been subject to thorough scrutiny be-
yond that it works well in this particular case. Ex-
actly how large an impact the depthwise convolutions
have on the final performance is unclear; this could
be determined by, e.g., conducting an ablation study.
Subscriptions are not entirely independent of the B2B
customer, as a contract covers multiple subscriptions
and determines the final churn timing. We tried to in-
clude this feature by adding the contract lifetime and
lifespan for each subscription. However, the impor-
tance of the included features is unknown.
To summarize, while the proposed model per-
forms competitively in predicting churn, it faces chal-
lenges due to the uncertainty inherent in rare events
like customer attrition. Incorporating diverse data
sources, such as contractual changes, customer sup-
port interactions, or product lifecycle data, could po-
tentially enhance the predictive capabilities of the
model. In addition, combining Transformer-based ap-
proaches with causal inference could provide deeper
insights into the root causes of churn, enabling more
effective and personalized interventions. This study
also emphasizes the importance of ethical AI, advo-
cating for fairness, transparency, and the safeguard-
ing of customer privacy. Broadening the scope of
this research to other industries holds the potential
to strengthen our understanding of customer retention
and develop robust strategies for mitigating churn on
a larger scale.
7 CONCLUSION AND FUTURE
WORK
The results demonstrate that we can effectively clas-
sify complex multivariate time-series patterns with a
single simple change to the Transformer architecture.
Even under unfavorable conditions, the model is able
to perform in line with previous research results (see
Section 3). While the metrics are not directly compa-
rable due to the lack of a common data set, the evalu-
ation methods are the same. Additionally, we demon-
strate how conformal prediction can be used to evalu-
ate model certainty and should prove valuable in deci-
sions regarding anti-churn campaign targeting. To our
knowledge, conformal prediction for churn prediction
has not been investigated previously. Thus, one of the
contributions of this study is the novel application of
conformal prediction in the context of churn predic-
tion, offering a fresh perspective on model uncertainty
and its role in anti-churn strategies.
If customer behavior does change before churn,
it is not unambiguously observable in the usage data
available to us, and the model does not produce pre-
cise predictions. We cannot rule out that the behav-
ioral changes are caused by the decision to churn and
not vice versa. Another plausible explanation is con-
founding variables, e.g., external factors or a reduc-
tion in demand, which may cause both changes in us-
age behavior and an increase in churn.
Some features that remained mostly time-
invariant could have been excluded from the time se-
ries window and instead intertwined with the Trans-
former in a multi-modal fashion. Hence, future work
could design a slightly simpler architecture and still
include all the information that might improve perfor-
mance. This work is limited by the specific use case
we studied, and the empirical results may not transfer
or be generalized well to other domains or industries.
Future work could explore the performance of the
Using Transformers for B2B Contractual Churn Prediction Based on Customer Behavior Data
569

proposed Transformer architecture on generic time
series classification tasks. Additionally, creating a
public time series dataset for customer churn would
facilitate direct comparisons between models.
ACKNOWLEDGEMENTS
This work was partially funded by Telenor Sverige
AB.
REFERENCES
Ahlstrand, J., Boldt, M., Borg, A., and Grahn, H. (2024).
Predicting B2B customer churn using a time series ap-
proach. In 2024 Fifth International Conference on In-
telligent Data Science Technologies and Applications
(IDSTA), pages 44–51.
Ahmadi, H. and Hasheminejad, S. M. H. (2021). A new
time series approach in churn prediction with discrim-
inatory intervals. In 2021 11th International Confer-
ence on Computer Engineering and Knowledge (IC-
CKE), pages 508–513.
Ahn, J., Hwang, J., Kim, D., Choi, H., and Kang, S. (2020).
A survey on churn analysis in various business do-
mains. IEEE Access, 8:220816–220839.
Angelopoulos, A. N. and Bates, S. (2021). A gen-
tle introduction to conformal prediction and
distribution-free uncertainty quantification.
https://arxiv.org/abs/2107.07511v6.
Ascarza, E. (2018). Retention futility: Targeting high-risk
customers might be ineffective. Journal of Marketing
Research, 55(1):80–98.
Ascarza, E. and Hardie, B. G. S. (2013). A joint model
of usage and churn in contractual settings. Marketing
Science, 32(4):570–590.
Boström, H. (2022). crepes: a python package for gener-
ating conformal regressors and predictive systems. In
Johansson, U., Boström, H., An Nguyen, K., Luo, Z.,
and Carlsson, L., editors, Proceedings of the Eleventh
Symposium on Conformal and Probabilistic Predic-
tion and Applications, volume 179 of Proceedings of
Machine Learning Research. PMLR.
Chen, K., Hu, Y.-H., and Hsieh, Y.-C. (2015). Predicting
customer churn from valuable b2b customers in the
logistics industry: a case study. Information Systems
and e-Business Management, 13(3):475–494.
Devriendt, F., Berrevoets, J., and Verbeke, W. (2021). Why
you should stop predicting customer churn and start
using uplift models. Information Sciences, 548:497–
515.
Fawcett, T. (2006). An introduction to ROC analysis. Pat-
tern Recognition Letters, 27(8):861–874.
Gal, Y. and Ghahramani, Z. (2016). Dropout as a bayesian
approximation: Representing model uncertainty in
deep learning. In Balcan, M. F. and Weinberger,
K. Q., editors, Proceedings of The 33rd International
Conference on Machine Learning, volume 48 of Pro-
ceedings of Machine Learning Research, pages 1050–
1059, New York, New York, USA. PMLR.
Gattermann-Itschert, T. and Thonemann, U. W. (2022).
Proactive customer retention management in a non-
contractual b2b setting based on churn prediction with
random forests. Industrial Marketing Management,
107:134–147.
Gür Ali, O. and Arıtürk, U. (2014). Dynamic churn predic-
tion framework with more effective use of rare event
data: The case of private banking. Expert Systems with
Applications, 41(17):7889–7903.
Hutto, C. and Gilbert, E. (2014). VADER: A parsimonious
rule-based model for sentiment analysis of social me-
dia text. In Proceedings of the International AAAI
Conference on Web and Social Media, volume 8,
pages 216–225. Number: 1.
Islam, S., Elmekki, H., Elsebai, A., Bentahar, J., Drawel,
N., Rjoub, G., and Pedrycz, W. (2024). A com-
prehensive survey on applications of transformers for
deep learning tasks. Expert Systems with Applications,
241:122666.
Janssens, B., Bogaert, M., Bagué, A., and Van den Poel,
D. (2022). B2boost: instance-dependent profit-driven
modelling of b2b churn. Annals of Operations Re-
search, 341(1):267–293.
Kumar, S., Mariyasagayam, N., and Nonaka, Y. (2024).
Evaluating the effect of leading indicators in customer
churn prediction. In Borah, M. D., Laiphrakpam,
D. S., Auluck, N., and Balas, V. E., editors, Big Data,
Machine Learning, and Applications, Lecture Notes
in Electrical Engineering, pages 327–340. Springer
Nature.
Mena, C. G., De Caigny, A., Coussement, K., De Bock,
K. W., and Lessmann, S. (2019). Churn pre-
diction with sequential data and deep neural net-
works. a comparative analysis. arXiv:1909.11114,
http://arxiv.org/abs/1909.11114.
Mena, G., Coussement, K., De Bock, K., De Caigny, A.,
and Lessmann, S. (2024). Exploiting time-varying
RFM measures for customer churn prediction with
deep neural networks. Annals of Operations Research,
339(1):765–787.
Neslin, S. A., Gupta, S., Kamakura, W., Lu, J., and Mason,
C. H. (2006). Defection detection: Measuring and un-
derstanding the predictive accuracy of customer churn
models. Journal of Marketing Research, 43(2):204–
211.
Park, W. and Ahn, H. (2022). Not all churn customers are
the same: Investigating the effect of customer churn
heterogeneity on customer value in the financial sec-
tor. Sustainability, 14(19):12328.
Paszke, A., Gross, S., Massa, F., Lerer, A., Bradbury, J.,
Chanan, G., Killeen, T., Lin, Z., Gimelshein, N.,
Antiga, L., Desmaison, A., Kopf, A., Yang, E., De-
Vito, Z., Raison, M., Tejani, A., Chilamkurthy, S.,
Steiner, B., Fang, L., Bai, J., and Chintala, S. (2019).
PyTorch: An imperative style, high-performance deep
learning library. In Advances in Neural Information
Processing Systems, volume 32. Curran Associates,
Inc.
ICEIS 2025 - 27th International Conference on Enterprise Information Systems
570

Pedregosa, F., Varoquaux, G., Gramfort, A., Michel, V.,
Thirion, B., Grisel, O., Blondel, M., Prettenhofer,
P., Weiss, R., Dubourg, V., Vanderplas, J., Passos,
A., Cournapeau, D., Brucher, M., Perrot, M., and
Duchesnay, E. (2011). Scikit-learn: Machine learning
in Python. Journal of Machine Learning Research,
12:2825–2830.
Reinartz, W. J. and Kumar, V. (2003). The impact of cus-
tomer relationship characteristics on profitable life-
time duration. Journal of Marketing, 67(1):77–99.
Sanchez Ramirez, J., Coussement, K., De Caigny, A.,
Benoit, D. F., and Guliyev, E. (2024). Incorporating
usage data for b2b churn prediction modeling. Indus-
trial Marketing Management, 120:191–205.
Shafer, G. and Vovk, V. (2008). A tutorial on conformal
prediction. Journal of Machine Learning Research,
9(12):371–421.
Somosi, A., Stiassny, A., Kolos, K., and Warlop, L. (2021).
Customer defection due to service elimination and
post-elimination customer behavior: An empirical
investigation in telecommunications. International
Journal of Research in Marketing, 38(4):915–934.
Tamaddoni Jahromi, A., Stakhovych, S., and Ewing, M.
(2014). Managing b2b customer churn, retention
and profitability. Industrial Marketing Management,
43(7):1258–1268.
Vaswani, A., Shazeer, N., Parmar, N., Uszkoreit, J., Jones,
L., Gomez, A. N., Kaiser, Ł., and Polosukhin, I.
(2017). Attention is all you need. Advances in Neural
Information Processing Systems, 30.
Wang, Y., Satake, K., Onishi, T., and Masuichi, H. (2018).
Customer churn prediction using sentiment analysis
and text classification of VOC. In Computational Lin-
guistics and Intelligent Text Processing, pages 156–
165. Springer, Cham.
Wei, C.-P. and Chiu, I.-T. (2002). Turning telecommunica-
tions call details to churn prediction: a data mining ap-
proach. Expert Systems with Applications, 23(2):103–
112.
Witten, I., Frank, E., Hall, M., and Pal, C. (2016). Data
Mining: Practical Machine Learning Tools and Tech-
niques. The Morgan Kaufmann Series in Data Man-
agement Systems. Elsevier Science.
Zhou, H., Zhang, S., Peng, J., Zhang, S., Li, J., Xiong, H.,
and Zhang, W. (2021). Informer: Beyond efficient
transformer for long sequence time-series forecasting.
Proceedings of the AAAI Conference on Artificial In-
telligence, 35(12):11106–11115.
Using Transformers for B2B Contractual Churn Prediction Based on Customer Behavior Data
571
