
Advancing Real-Time Land Cover Classification for Biomass Density
and Carbon Stocks Estimation in Google Earth Engine
Dan Abudu
1a
, Lucy Bastin
2b
, Katie Chong
3c
and Mirjam Röder
1d
1
Energy and Bioproducts Research Institute, Aston University, B4 7ET, Birmingham, U.K.
2
School of Computer Science and Digital Technologies, Aston University, B4 7ET, Birmingham, U.K.
3
Energy Systems Catapult, Cannon House, B4 6BS, Birmingham, U.K.
Keywords: Biomass Density, Carbon Stocks, LULC Classification, GIS, Remote Sensing, Google Earth Engine, Uganda,
SDG 13, SDG 15.
Abstract: Addressing climate change requires timely and accurate biomass and carbon stocks information. Traditional
biomass estimation techniques rely on infrequent ground surveys and manual processing, limiting their
scalability. This study proposes a novel framework that advances land cover classification to estimate biomass
and carbon stocks using machine learning algorithms in Google Earth Engine. By integrating remote sensing
data, machine learning algorithms, and allometric models, the framework automates above-ground biomass
(ABG) and below-ground biomass (BGB) calculations, facilitating large-scale carbon stock assessments. The
methodology leverages Landsat imagery, alongside derived Normalized Difference Vegetation Indices, to
classify seven land cover types and estimate biomass. Equations are applied to derive AGB, with BGB
calculated as a fraction of AGB. Carbon stock is estimated using a standard conversion factor of 0.47. Real-
time processing capabilities of GEE ensure continuous monitoring and updates, enhancing accuracy and
scalability. Findings demonstrate the potential for real-time biomass mapping and the identification of carbon-
dense regions. The proposed approach is vital for sustainable land practices, carbon accounting, and forest
conservation initiatives, to provide policymakers with accurate, real-time data, that supports climate
mitigation efforts and contribute to realizing the Sustainable Development Goals 13 and 15.
1 INTRODUCTION
Forests and other vegetated landscapes are natural
carbon sinks, playing a key role in mitigating climate
change effects (Ma et al., 2022). Biomass, the total
mass of living plant material, serves as a critical
indicator of ecosystem health, carbon sequestration
and energy potential (Makepa & Chihobo, 2024).
Real-time biomass and carbon stock assessments are
essential for meeting local commitments such as
Nationally Determined Contributions (NDC) and
international climate agreements, such as REDD+
(Reducing Emissions from Deforestation and Forest
Degradation), which aim to incentivize sustainable
forest management practices (Nakakaawa et al.,
2011). Such real-time data empowers local authorities
a
https://orcid.org/0000-0002-9321-0829
b
https://orcid.org/0000-0003-1321-0800
c
https://orcid.org/0000-0002-3800-8302
d
https://orcid.org/0000-0002-8021-3078
and conservation organizations to respond effectively
to deforestation, and other environmental threats,
contributing to the attainment of United Nations’
Sustainable Development Goals 13 (climate action)
and 15 (better life on land).
However, traditional methods of biomass and
carbon stock estimation such as ground survey and
manual image interpretation are time-consuming,
expensive, and mostly constrained to small-scale
applications (Paneque-Gálvez et al., 2014).
Recent developments in remote sensing
technologies have enabled large-areal assessments of
biomass and carbon stocks (Flores Lanza et al., 2024).
Satellite imagery from programs such as Landsat,
Sentinel, and MODIS provides the required localized
data for monitoring land cover and vegetation
Abudu, D., Bastin, L., Chong, K. and Röder, M.
Advancing Real-Time Land Cover Classification for Biomass Density and Carbon Stocks Estimation in Google Earth Engine.
DOI: 10.5220/0013434200003935
Paper published under CC license (CC BY-NC-ND 4.0)
In Proceedings of the 11th Inter national Conference on Geographical Information Systems Theory, Applications and Management (GISTAM 2025), pages 203-210
ISBN: 978-989-758-741-2; ISSN: 2184-500X
Proceedings Copyright © 2025 by SCITEPRESS – Science and Technology Publications, Lda.
203

dynamics. However, data processing limitations,
inconsistent temporal updates, and complex
modelling requirements hinder the scalability and
real-time applicability of biomass and carbon
monitoring systems. This is particularly pronounced
in low-income countries, where technical and
financial constraints limit the uptake of high-
computational geospatial modelling (Kilama Luwa et
al., 2020).
Google Earth Engine (GEE) provides a
sustainable solution to these challenges. GEE is a
cloud-based geospatial analysis platform that
facilitates ingesting and processing satellite data in
real-time (Gorelick et al., 2017). GEE’s potential for
continuous land cover monitoring is demonstrated by
its ability to ingest large archives of remote sensing
data, integrated with advanced classification
algorithms, can be scaled to biomass and carbon
stocks estimation at flexible scales.
This study proposes a framework for leveraging
GEE to perform real-time land cover classification
and forest biomass density estimation, with the goal
of enhancing carbon stock assessments and informing
climate mitigation policies. The proposed framework
focuses on automating the classification of seven land
cover classes, and the calculation of Above-Ground
Biomass (AGB) and Below-Ground Biomass (BGB)
for the forest land cover class. By applying allometric
models and vegetation indices, the framework
enables accurate mapping of forest biomass
distribution across the landscape. Carbon stock is
estimated by converting biomass values using
established carbon fractions, providing insights into
the role of forest land cover in carbon sequestration.
The study’s contributions include (1) a framework
for real-time biomass and carbon stocks estimation,
(2) custom JavaScript code for real-time pre-
processing of Landsat, Sentinel-2 A/B and Sentinel-1
SAR imagery in GEE, and (3) custom Python code
for estimating forest biomass and carbon stocks for
climate planning.
2 METHODOLOGIES
2.1 Study Area and Datasets
The developed land cover classification, biomass
density, and carbon stock estimation framework was
tested in Uganda, an East African country (Figure 1).
Uganda experiences high rates of deforestation and
forest degradation. However, the country holds
significant potential for sustainable forest landscape
restoration due to relatively low restoration costs and
large socio-economic benefits compared to other
countries (Brancalion et al., 2019). Several forest
restoration hotspots have been identified (Figure 1).
Figure 1: Map of the study area.
Uganda’s diverse environmental and socio-economic
conditions, driven by varying levels of forest
degradation, restoration potential, and exposure to
climate change impacts, presented an ideal setting to
validate and refine our proposed framework.
A summary of the datasets used to achieve the
study objectives is provided in Table 1. These
datasets have been imported, pre-processed, and
analyzed within the Google Earth Engine (GEE)
environment to ensure efficient and scalable data
handling.
Table 1: Data and data sources used in the study.
Data Scale Date Purpose Source
Landsat 7
ETM+,
Landsat 8
OLI/TIRS
30 m
2000
-
2020
Land cover,
Biomass,
Carbon
stocks
USGS
ingested
in GEE
Sentinel
2A/B
10 m
2019
-
2020
Land cover,
Biomass,
Carbon
ESA
ingested
in GEE
Sentinel
1C
10 m
2019
-
2020
Land cover
classification
ESA
ingested
in GEE
Biomass
data
30 m
2000,
2005
Validation /
ground
truthing
Uganda’s
Forest
Authorit
y
2.2 Development of Land Cover
Classification Framework
Figure 2 illustrates the real-time land cover
classification framework developed in GEE. The
framework is applicable to satellite imagery with
scalable temporal resolutions, such as the 16- and 10-
day repeat cycles of Landsat 8/9 and Sentinel-2 A/B
GISTAM 2025 - 11th International Conference on Geographical Information Systems Theory, Applications and Management
204
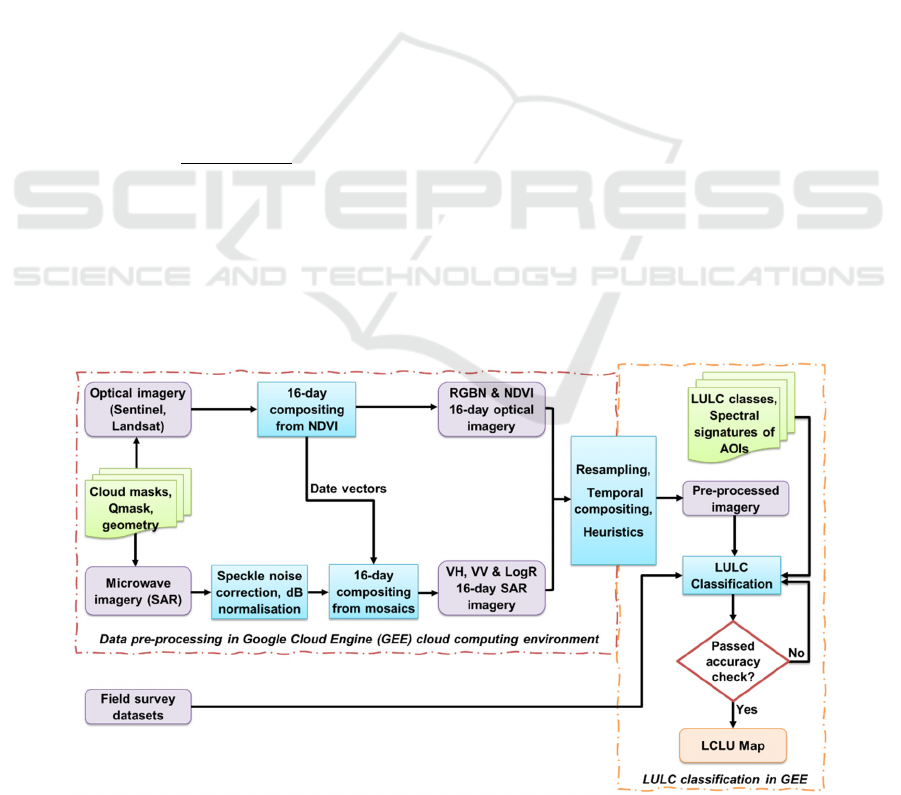
respectively. This allows for the selection and
matching of imagery that aligns with specific
temporal requirements, ensuring consistency and
accuracy in land cover assessments.
2.2.1 Pre-Processing the Satellite Imagery
Pre-processing of satellite imagery followed the
developed GEE JavaScript code (Abudu et al., 2024).
to automatically select Blue, Green, Red and Near-
infrared (RGBN) optical bands from available
Landsat 7 ETM+, Landsat 8 OLI/TIRS, Landsat 9
archives and Sentinel 2A/B. The script calculates the
Normalized Difference Vegetation Index (NDVI)
using Equation 1 and applies GEE’s quality mosaic
algorithm (Gorelick et al., 2017) for each study
period. This process ensures that the final mosaic
imagery comprises pixels with the highest NDVI
values. The ratioing approach, effectively reducing
the impact of cloud cover and mixed-pixel effects,
which are common in tropical regions. By prioritizing
pixels associated with high biomass (high NDVI
values), the approach enhances the accuracy of land
cover classification.
𝑁𝐷𝑉𝐼=
(𝑁𝐼𝑅− 𝑅𝑒𝑑)
(𝑁𝐼𝑅 𝑅𝑒𝑑)
(1)
Given that forest biophysical properties change
gradually, we pre-processed optical imagery into
annual composites. To align with Uganda’s National
Biomass Survey (NBS) periods (NFI, 2016), imagery
for 2000, 2005, 2015, and 2020 were selected. The
2015 NBS period, being the most recent, served as the
validation reference for biomass and carbon stock
estimation, as detailed in Section 2.3.
To maintain spatial and geometric consistency
during analysis, all datasets were reprojected to a
spatial resolution of 30 meters (matching Landsat’s
resolution) and transformed to the WGS84-UTM
Zone 36N projection, localized for the study area.
2.2.2 Land Cover Classification
We prioritized Landsat imagery for both land cover
classification and estimation of biomass and carbon
stocks due to rich temporal archives. Additionally, the
focus on forest biomass estimation detailed in Section
2.3 meant that the 30-meter spatial resolution of
Landsat imagery was sufficient for forest areal
extents. Land cover classification was performed
using a supervised Random Forest (RF) algorithm.
Previous studies have explored different
classification techniques, including Maximum
Likelihood Classification (Abudu et al., 2019),
Support Vector Machines (Opedes et al., 2022), and
RF-based methods (Coker et al., 2021). RF
demonstrated superior performance over other pixel-
based methods in Uganda.
The choice of RF was influenced by its proven
advantages, such as the ability to handle high-
dimensional datasets and resilience to noise and
outliers, owing to its ensemble approach of multiple
decision trees (Coker et al., 2021). These attributes
are particularly valuable for accurate characterization
of Uganda’s complex and heterogeneous landscapes.
The RF model was configured with 50 decision
trees (n=50) and trained on 70% of the dataset, while
Figure 2: Land cover classification framework.
Advancing Real-Time Land Cover Classification for Biomass Density and Carbon Stocks Estimation in Google Earth Engine
205
the remaining 30% reserved for validation.
Classification targeted seven land cover classes,
informed by local expertise, and previous study
(Opedes et al., 2022). Table 2 summarizes the land
cover classes. To work within GEE’s memory limits,
we utilized GEE Python API to develop custom code
for land cover classification and estimation of
biomass density and carbon stocks (Abudu et al.,
2024).
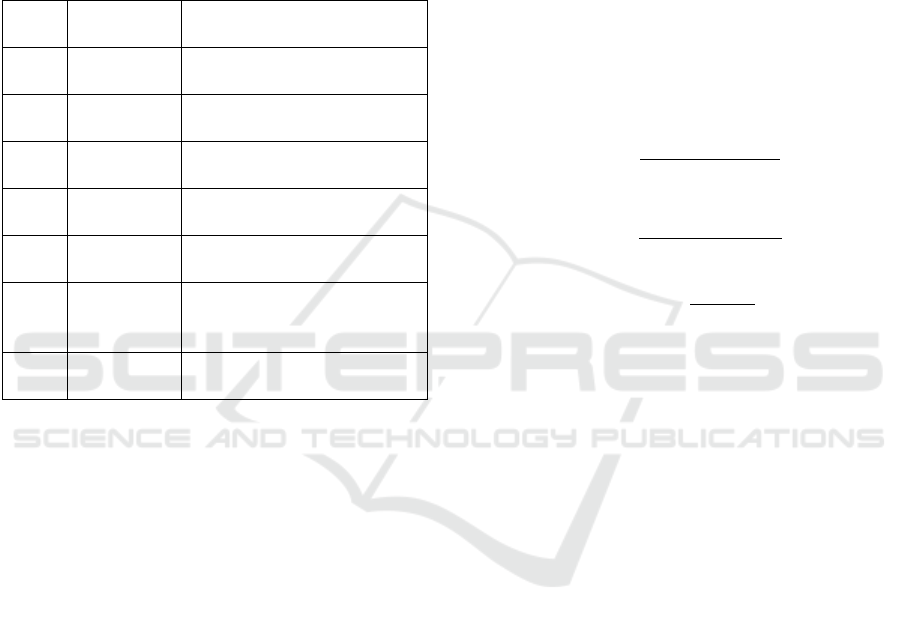
Table 2: Land cover classification classes.
Class
N
o.
Class name Description
1 Forests Natural and artificial tree
covers, and woodlan
d
s.
2 Bushlands Closed, open or very open
shrubs
3 Grasslands Graminoids and herbaceous
areas for
g
razin
g
, sports,etc
4 Agriculture Small- and large-scale
farmlands
5 Wetlands Wet graminoids and
herbaceous areas
6 Built up Buildings, weathered roads,
human settlements, and
other artificial surfaces.
7 Open
wate
r
Standing and flowing water
and water dams
2.2.3 Accuracy Assessment of the Land
Cover Classification
The accuracy of the classification was assessed in two
stages. The first stage involved testing the trained RF
model on the reserved 30% of unseen data. In the
second stage, accuracy was assessed on the final
classified image. For this assessment, 300 random
pixels were stratified by each land cover class,
resulting in a total of 2,100 sampled pixels per year.
A confusion matrix; an accuracy assessment
method previously utilized in this study area (Abudu
et al., 2019; Kuule et al., 2022), was developed to
summarize the counts of correct and incorrect
predictions for each of the seven land cover classes
(
Table A1 in Appendix). Computed accuracy metrics
included the Overall Accuracy (OA) which measures
the proportion of correctly classified pixels across all
classes, User Accuracy (UA) which is a classification
precision indicator per class from user’s perspective,
Producer’s Accuracy (PA) which is the model’s recall
classification and the Kappa Coefficient (K); a
statistic measure with values toward one representing
stronger agreement between predicted and true labels
while accounting for chance agreement with values
between zero and one.
Although, stratified sampling approach is a robust
method, in practice biases still arise. In our case,
while sampling 300 points per land cover class
(N=300), we assumed equal distribution across all
classes (𝑛=7). However, within class distributions
may vary, resulting into stratum variances (𝑆
and
𝑆
). We applied Card’s correction (Card, 1982),
following the steps outlined in Olofsson et al., (2013),
to check and correct any stratum variances, and
correct the producer’s (𝑃𝐴
) and user’s (𝑈𝐴
)
accuracies per class and overall accuracy (𝑂𝐴
). The
classified LULC sample size (𝑁
)varies per class.
Equations 2, 3 and 4 were applied on results of the
confusion matrix to correct PA, UA and OA.
𝑆
=
(
1−𝑃𝐴
)
∗𝑃𝐴
𝑁
(2
)
𝑆
=
(
1−𝑈𝐴
)
∗𝑈𝐴
𝑁
(3
)
𝑂𝐴
=𝑂𝐴−
∗
(4
)
2.3 Biomass Density and Carbon Stock
Estimation
We formulated a workflow for biomass density
calculation in tons per hectare (t/ha). Biomass density
is directly correlated with carbon stock, making it a
critical parameter for estimating carbon reserves and
evaluating the role of vegetation in sequestering
atmospheric carbon and informing climate change
mitigation strategies (UNFCCC, 2015).
Egeru et al., (2014) affirms that Normalized
Difference Vegetation Index (NDVI) is an effective
indicator of vegetation and biomass presence in
north-eastern Uganda. NDVI values near +1 reflect
dense vegetation, while values approaching zero
indicating sparse or absent cover. The strong
correlation between NDVI and biomass highlights its
value for monitoring vegetation health and coverage.
We calculated NDVI from optical Landsat
imagery using Equation 1. To establish the
relationship between biomass and vegetation indices,
we utilized classified forest land cover data, with
field-measured biomass serving as the dependent
variable and vegetation indices as independent
variables. We applied linear regression models to
determine the empirical constants (a and b) in
Equation 5, using existing biomass data of 2000 and
GISTAM 2025 - 11th International Conference on Geographical Information Systems Theory, Applications and Management
206
2005, and calculated the above-ground biomass
(AGB) from NDVI. Equation 6 was applied
determine the below-ground biomass (BGB) as a
fraction of the AGB according to the root-to-shoot
ratio (r) for each land cover class. In Uganda, the
default Intergovernmental Panel on Climate Change
(IPCC) root-to-shoot ratio of 0.24 is commonly
applied for such conversions (MWE-IPCC, 2014),
which was adopted by study. Biomass density was
calculated per hectare by reprojecting the Landsat’s
30m pixel size to 100m and then calculating biomass
per 100 x 100F m
2
pixel area.
Carbon stock in Uganda’s forests is determined to
be 47% of the total biomass stocks (NFA, 2009).
Consequently, we focused on forest land cover for
estimating biomass and carbon stocks. However, in
cases where biomass conversion factors for other land
covers exist, the model can be tested for other land
cover types. Equations 7 and 8 were used to calculate
the total forest biomass and carbon stocks
respectively.
𝐴
𝐺𝐵= 𝑎 𝑥𝑒
(5
)
𝐵𝐺𝐵=𝑟𝑥
𝐴
𝐺𝐵
(6
)
𝑇𝑜𝑡𝑎𝑙 𝐵𝑖𝑜𝑚𝑎𝑠𝑠=
𝐴
𝐺𝐵 𝐵𝐺𝐵
(7
)
𝐶𝑎𝑟𝑏𝑜𝑛 𝑆𝑡𝑜𝑐𝑘𝑠=0.47 𝑥 𝑇𝑜𝑡𝑎𝑙 𝐵𝑖𝑜𝑚𝑎𝑠𝑠
(8
)
3 RESULTS AND DISCUSSIONS
3.1 Characterization of Land Cover
Changes in Uganda
Classification achieved an overall accuracy of 89%
(
Table A1 in
Appendix). Over the past decade,
agriculture had the largest expanded from 51% to
60% while open water remained stable at 11% of the
total land area. In contrast, forests have experienced
the worst instability, declining by over 3% (3.1 – 2.4
million hectares) respectively, as they are converted
to agricultural land and grasslands.
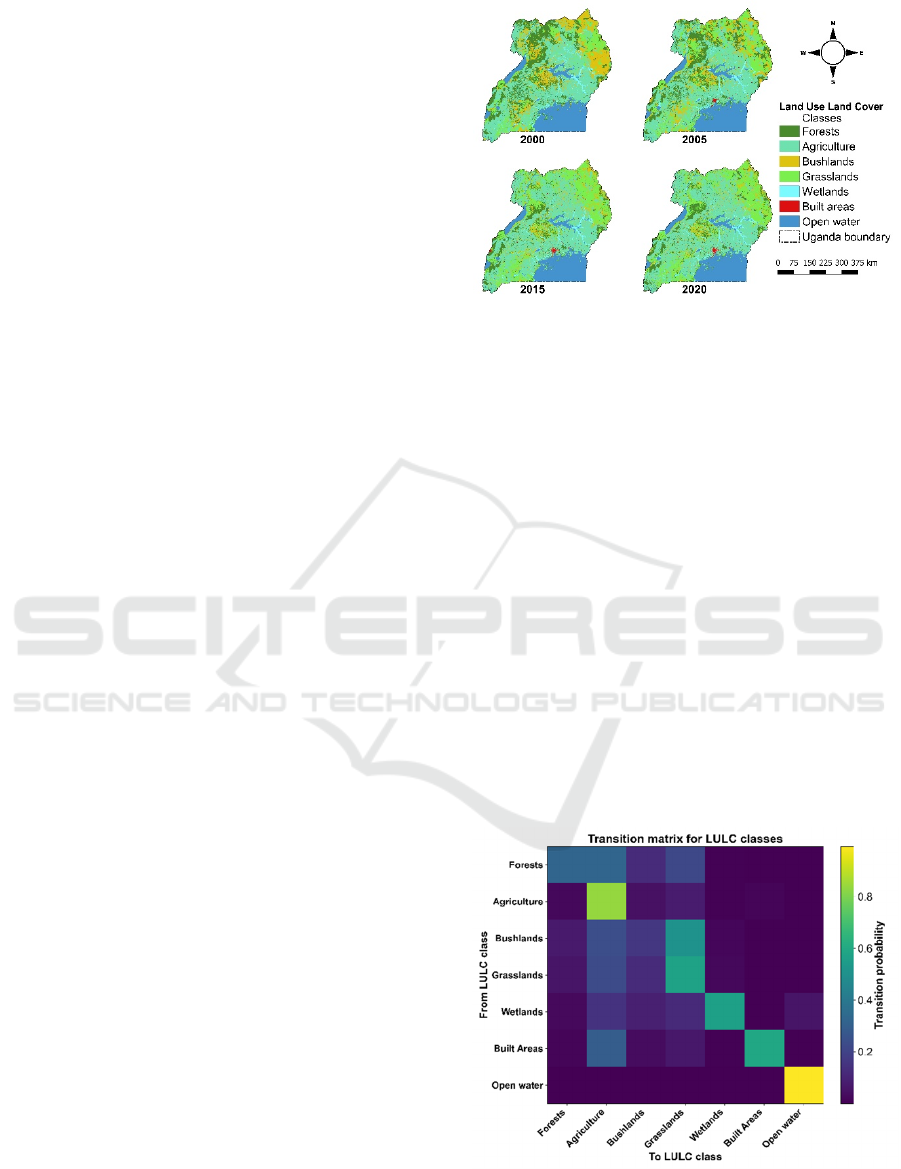
Figure 3 highlights the scale of deforestation in
Uganda, with the northern and eastern regions most
affected. Deforestation also intensified in the western
and central regions from 2015 onwards, where forest
losses were previously minimal.
Figure 3: Uganda’s Land use land cover (LULC) changes.
3.1.1 Temporal Transition of Land Cover
Classes
Using Markov Chain transition matrix calculations
(Abudu et al., 2019; Kuule et al., 2022), we analyzed
the shifts between various land cover classes to
understand the dynamics and extent of land cover
changes over the study period. The results, illustrated
in Figures 4 and 5, reveal significant patterns of
change, with key transitions highlighting the
widespread conversion of forest land into grasslands
and agricultural areas. These transitions suggest
increasing pressure from human activities such as
agricultural expansion, settlement growth, and
resource extraction, which are driving the reduction
of natural vegetation cover. Notably, bushlands and
forests are the most affected by land cover changes,
experiencing significant losses with transition rates of
approximately 80% and 75%, respectively, as they
are increasingly converted to other land cover classes.
Figure 4: Markov transition matrix of land cover classes.
Advancing Real-Time Land Cover Classification for Biomass Density and Carbon Stocks Estimation in Google Earth Engine
207
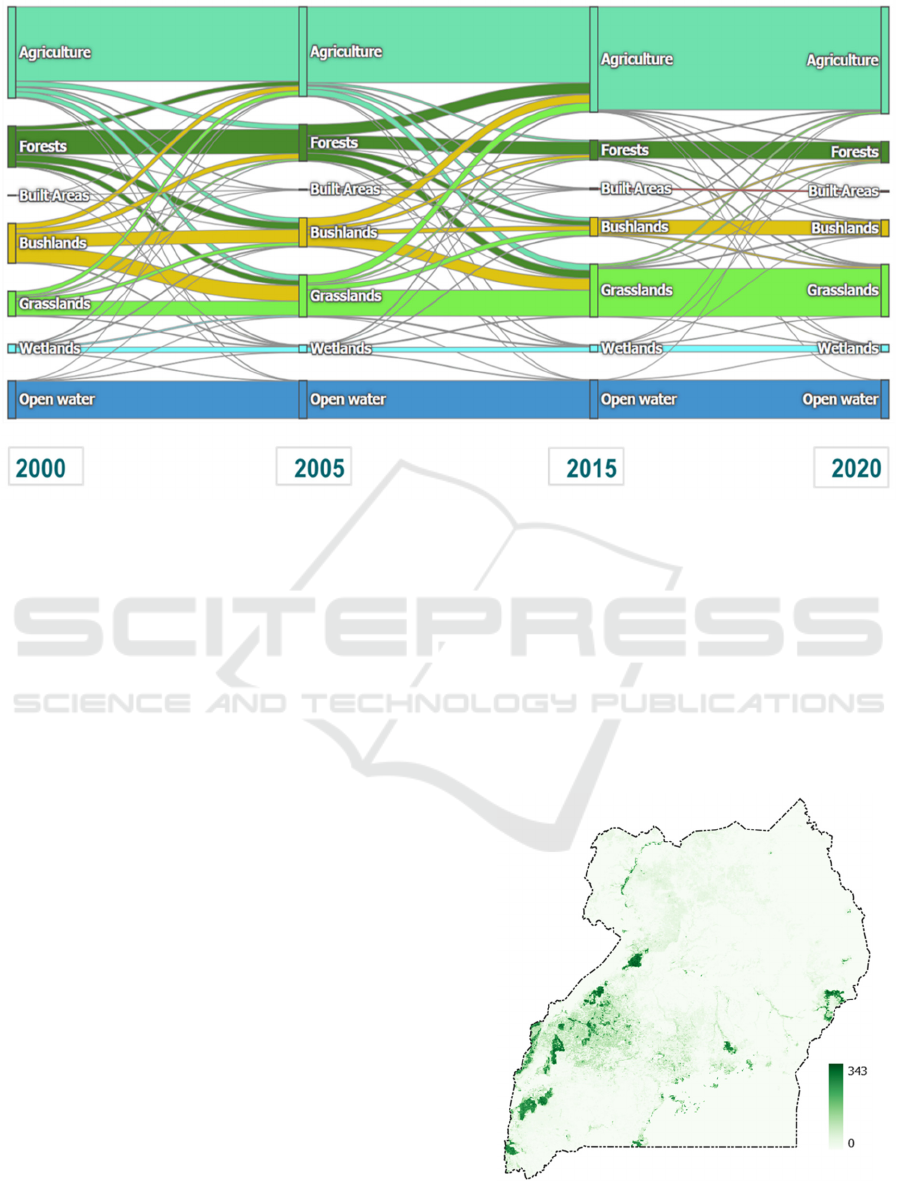
Figure 5: Land cover transitions from 2000 to 2020.
From Figure 5, forests primarily transition to
agriculture, bushlands and grasslands. In Uganda,
bushlands often represent secondary recovery stages
of previously deforested areas. The transition patterns
suggest that as forests are cleared, the land typically
shifts to agricultural use or remains within the forest-
bushland cycle. Agricultural expansion is the primary
driver of deforestation in Uganda as initially cleared
bushlands becomes grassland and is later cultivated
for farming.
3.2 Biomass Density and Carbon Stock in
Uganda
Biomass density is a strong indicator for carbon
stocks potential and is also a key indicator of energy
potential of an area because biomass is a primary
resource for renewable energy. Since the energy
potential is directly proportional to the biomass
quantity and its calorific value (Barasa et al., 2022),
areas with higher biomass densities represent more
energy potential per unit area.
Figure 6 shows the baseline biomass density in the
year 2000, and Figure 7 shows the results modelling
biomass density from 2000 – 2040. We present a
normalized data to show the trend of biomass density
and carbon stocks, to inform future modelling,
management, and policy decisions. In the trend
analysis, biomass and carbon stocks are directly
proportional following similar trends. To add context,
we plotted the energy demand based on data from
Ritchie et al., (2022) indicating a strong inverse
relationship and suggesting Uganda’s biomass loss is
greatly influenced by the country’s energy demand.
Uganda’s biomass density is concentrated around
the western and eastern hilly plains with highest
biomass densities of 343 t/ha with most areas in the
northern parts exhibiting the lowest densities. Other
parts of the country exhibit low biomass density and
consequently low carbon stocks (Figure 6).
Figure 6: Biomass density in tons per hectare (t/ha) for
2000.
GISTAM 2025 - 11th International Conference on Geographical Information Systems Theory, Applications and Management
208
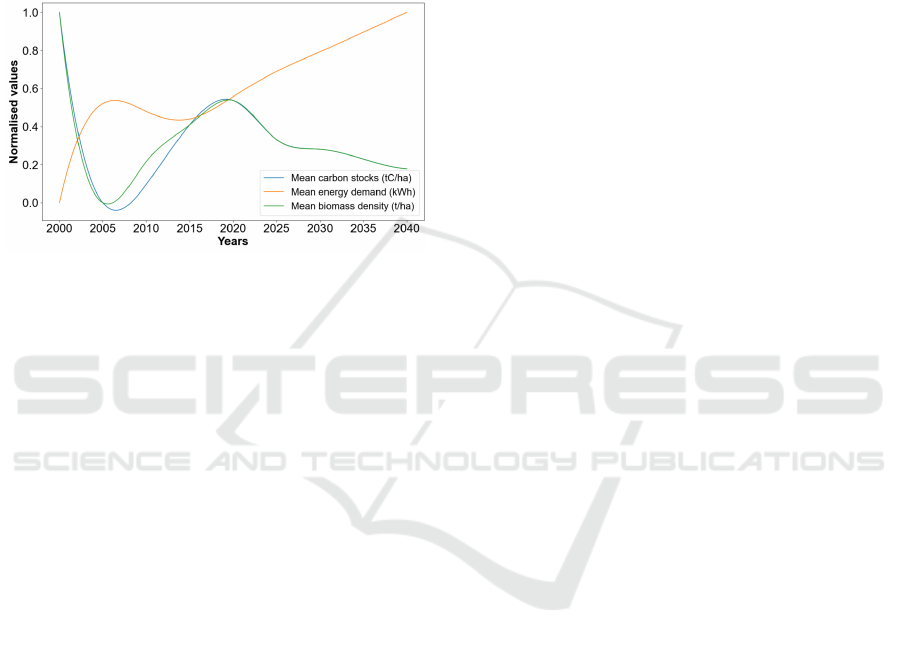
Figure 7 presents the projected trends in Uganda’s
biomass, carbon stocks, and energy landscape,
reflecting the country's Vision 2040. The results show
that Uganda’s goal of reducing greenhouse gas
emissions by 24.7% below the current 148.80 Mt
CO
2
e by 2030 (MWE, 2022) can only be feasible
under targeted interventions. However, under a
business-as-usual scenario, reducing carbon
emissions and attaining sustainable biomass for
energy consumption remains unattainable.
Figure 7: Projecting Uganda’s carbon, energy, and biomass
from 2000 - 2040.
4 CONCLUSIONS
Uganda’s key forest and climate policy challenges are
weak institutional capacity, limited coordination and
insufficient financing (Renner, 2020). These
challenges are exacerbated by a lack of up-to-date
monitoring information and limited data-centric
decision-making routines. Our results (data and
analyses) are vital for policymakers to prioritize
conservation efforts and design strategies that
enhance carbon sequestration. Results such as trend
analysis in Figure 7 indicate the need for urgent
change from business-as-usual scenario to abate the
dwindling biomass and carbon stocks in the future
and meet the increasing energy demands. The results
also underscore the significance of protecting diverse
land cover classes as part of Uganda’s strategy to
meet climate goals, enhance biodiversity, and
promote sustainable development.
This geospatial modelling approach offers a cost-
effective and scalable method for carbon stocks
assessment, particularly in low-resource settings.
Future work will refine the model’s accuracy,
addressing uncertainties around biomass density and
carbon stock estimation and improving confidence
levels. This will be achieved through improved
ground-truthing, model fit and confidence interval
analyses and exploring its adaptability to related
areas, such as energy demand forecasting.
REFERENCES
Abudu, D., Bastin, L., Chong, J. K., & Röder, M. (2024).
GEE-BioCarbonStocks: Advancing real-time LULC
for biomass density and carbon stocks estimation in
GEE. Zenodo. https://doi.org/10.5281/
zenodo.14837327
Abudu, D., Echima, R. A., & Andogah, G. (2019). Spatial
assessment of urban sprawl in Arua Municipality,
Uganda. The Egyptian Journal of Remote Sensing and
Space Science, 22(3), 315–322. https://doi.org/
10.1016/j.ejrs.2018.01.008
Barasa, B., Turyabanawe, L., Akello, G., Gudoyi, P. M.,
Nabatta, C., & Mulabbi, A. (2022). The Energy
Potential of Harvested Wood Fuel by Refugees in
Northern Uganda. The Scientific World Journal, 2022,
1–10. https://doi.org/10.1155/2022/1569960
Brancalion, P. H. S., Niamir, A., Broadbent, E., Crouzeilles,
R., Barros, F. S. M., Almeyda Zambrano, A. M.,
Baccini, A., Aronson, J., Goetz, S., Reid, J. L.,
Strassburg, B. B. N., Wilson, S., & Chazdon, R. L.
(2019). Global restoration opportunities in tropical
rainforest landscapes. Science Advances, 5(7), 3223–
3226. https://doi.org/10.1126/sciadv.aav3223
Card, D. H. (1982). Using Known Map Category Marginal
Frequencies To Improve Estimates of Thematic Map
Accuracy. Photogrammetric Engineering and Remote
Sensing, 48(3), 431–439. https://www.asprs.org/wp-
content/uploads/pers/1982journal/mar/1982_mar_431-
439.pdf
Coker, E. S., Amegah, A. K., Mwebaze, E., Ssematimba, J.,
& Bainomugisha, E. (2021). A land use regression
model using machine learning and locally developed
low cost particulate matter sensors in Uganda.
Environmental Research, 199(April), 111352.
https://doi.org/10.1016/j.envres.2021.111352
Egeru, A., Wasonga, O., Kyagulanyi, J., Majaliwa, G.,
MacOpiyo, L., & Mburu, J. (2014). Spatio-temporal
dynamics of forage and land cover changes in Karamoja
sub-region. Pastoralism: Research, Policy and
Practice, 4(1), 6. https://doi.org/10.1186/2041-7136-4-
6
Flores Lanza, M., Leonard, A., & Hirmer, S. (2024).
Geospatial and socioeconomic prediction of value-
driven clean cooking uptake. Renewable and
Sustainable Energy Reviews, 192(October 2023),
114199. https://doi.org/10.1016/j.rser.2023.114199
Gorelick, N., Hancher, M., Dixon, M., Ilyushchenko, S.,
Thau, D., & Moore, R. (2017). Google Earth Engine:
Planetary-scale geospatial analysis for everyone.
Remote Sensing of Environment, 202, 18–27.
https://doi.org/10.1016/j.rse.2017.06.031
Kilama Luwa, J., Bamutaze, Y., Majaliwa Mwanjalolo, J.-
G., Waiswa, D., Pilesjö, P., Mukengere, E. B., Luwa, J.
K., Bamutaze, Y., Majaliwa, J.-G., Waiswa, D., Pilesjö,
Advancing Real-Time Land Cover Classification for Biomass Density and Carbon Stocks Estimation in Google Earth Engine
209
P., Espoir, &, Mukengere, B., Bagula, E., Luwa, J. K.,
Mwanjalolo, J.-G. M., & Mukengere, E. B. (2020).
Impacts of land use and land cover change in response
to different driving forces in Uganda: evidence from a
review. African Geographical Review, 40(4), 378–394.
https://doi.org/10.1080/19376812.2020.1832547
Kuule, D. A., Ssentongo, B., Magaya, P. J., Mwesigwa, G.
Y., Okurut, I. T., Nyombi, K., Egeru, A., & Tabuti, J.
R. S. (2022). Land Use and Land Cover Change
Dynamics and Perceived Drivers in Rangeland Areas in
Central Uganda. Land, 11(9), 1402. https://doi.org/
10.3390/land11091402
Ma, Z., Hu, C., Huang, J., Li, T., & Lei, J. (2022). Forests
and Forestry in Support of Sustainable Development
Goals (SDGs): A Bibliometric Analysis. Forests,
13(11), 1960. https://doi.org/10.3390/f13111960
Makepa, D. C., & Chihobo, C. H. (2024). Sustainable
pathways for biomass production and utilization in
carbon capture and storage—a review. Biomass
Conversion and Biorefinery, 0123456789.
https://doi.org/10.1007/s13399-024-06010-5
MWE-IPCC. (2014). Annex 9 : Estimating forest
degradation in Uganda. 1999(table 2).
https://www.mwe.go.ug/sites/default/files/library/Ann
ex 09-Biomass Degradation in Uganda.pdf
MWE. (2022). Updated Nationally Determined
Contribution (NDC)-Uganda (Issue September).
https://mwe.go.ug/library/updated-nationally-
determined-contribution-ndc
Nakakaawa, C. A., Vedeld, P. O., & Aune, J. B. (2011).
Spatial and temporal land use and carbon stock changes
in Uganda: Implications for a future REDD strategy.
Mitigation and Adaptation Strategies for Global
Change, 16(1), 25–62. https://doi.org/10.1007/s11027-
010-9251-0
NFA. (2009). National Biomass Study Technical Report
2009. In Issue December (Vol. 2009, Issue December
2009). https://www.nfa.go.ug/images/reports/
biomasstechnicalreport2009.pdf
NFI. (2016). UGANDA NATIONAL FOREST INVENTORY
(NFI).
https://microdata.fao.org/index.php/catalog/2047
Olofsson, P., Foody, G. M., Stehman, S. V., & Woodcock,
C. E. (2013). Making better use of accuracy data in land
change studies: Estimating accuracy and area and
quantifying uncertainty using stratified estimation.
Remote Sensing of Environment, 129, 122–131.
https://doi.org/10.1016/j.rse.2012.10.031
Opedes, H., Mücher, S., Baartman, J. E. M. M., Nedala, S.,
& Mugagga, F. (2022). Land Cover Change Detection
and Subsistence Farming Dynamics in the Fringes of
Mount Elgon National Park, Uganda from 1978–2020.
Remote Sensing, 14(10), 2423. https://doi.org/
10.3390/rs14102423
Paneque-Gálvez, J., McCall, M., Napoletano, B., Wich, S.,
& Koh, L. (2014). Small Drones for Community-Based
Forest Monitoring: An Assessment of Their Feasibility
and Potential in Tropical Areas. Forests, 5(6), 1481–
1507. https://doi.org/10.3390/f5061481
Renner, J. (2020). New Power Structures and Shifted
Governance Agendas Disrupting Climate Change
Adaptation Developments in Kenya and Uganda.
Sustainability 2020, Vol. 12, Page 2799, 12(7), 2799.
https://doi.org/10.3390/SU12072799
Ritchie, H., Roser, M., & Rosado, P. (2022). Energy. Our
World in Data; Our World in Data.
https://ourworldindata.org/energy
UNFCCC. (2015). Measurements for Estimation of Carbon
Stocks in Afforestation and Reforestation Project
Activities under the Clean Development Mechanism: A
Field Manual. http://unfccc.int/resource/docs/
publications/cdm_afforestation_field-manual_web.pdf
APPENDIX
Table 3: Confusion matrix for accuracy assessment of land cover classification.
Reference data
Classified land cover Map
Class Number 1 2 3 4 5 6 7 Total
User
accurac
y
Commiss
ion Erro
r
Variance
(
Card's
)
1 262 10 14 20 5 1 0 312 0.8397 0.1603 0.0004
2 16 265 10 6 5 3 2 307 0.8632 0.1368 0.0004
3 6 8 261 23 8 2 4 312 0.8365 0.1635 0.0004
4 9 5 4 238 6 4 2 268 0.8881 0.1119 0.0004
5 2 4 5 4 267 4 4 290 0.9207 0.0793 0.0003
6 3 6 2 4 5 286 0 306 0.9346 0.0654 0.0002
7 2 2 4 5 4 0 288 305 0.9443 0.0557 0.0002
Total 300 300 300 300 300 300 300 1867
Producer accurac
y
0.8733 0.8833 0.8700 0.7933 0.8900 0.9533 0.9600
Overall accuracy (standard): 88.90476
Omission Erro
r
0.1267 0.1167 0.1300 0.2067 0.1100 0.0467 0.0400
Variance strata (Card's) 0.0004 0.0003 0.0004 0.0005 0.0003 0.0001 0.0001
Overall accuracy (Card
corrected
)
:
88.90444
Row x Column totals 93600 92100 93600 80400 87000 91800 91500 Ka
pp
a coefficient
(
K
)
: 0.87
GISTAM 2025 - 11th International Conference on Geographical Information Systems Theory, Applications and Management
210
