
Predicting B2B Customer Churn and Measuring the Impact of Machine
Learning-Based Retention Strategies
Vict
´
oria Emanuela Alves Oliveira
2,3 a
, Amanda Cristina da Costa Guimar
˜
aes
3 b
,
Arthur Rodrigues Soares de Quadros
1,3 c
, Reynold Navarro Mazo
3,4 d
,
Rickson Livio de Souza Gaspar
3
, Alessandro Vieira
3 e
and Wladmir Cardoso Brand
˜
ao
1,3 f
1
Department of Computer Science, Pontifical Catholic University of Minas Gerais (PUC Minas), Brazil
2
Center for Exact and Technological Sciences, Federal University of Rec
ˆ
oncavo da Bahia (UFRB), Cruz das Almas, BA,
Brazil
3
Data Science Laboratory (SOLAB), S
´
olides S.A. - Belo Horizonte, MG, Brazil
4
Institute of Mathematical and Computer Sciences (ICMC), University of S
˜
ao Paulo (USP), S
˜
ao Carlos, SP, Brazil
Keywords:
Customer Churn, Churn Prediction, B2B Churn, Support Vector Machines (SVM), Machine Learning,
Feature Selection.
Abstract:
Acquiring new customers often costs five times more than retaining existing ones. Customer churn signifi-
cantly threatens B2B companies, causing revenue loss and reduced market share. Analyzing historical cus-
tomer data, including frequency on product usage, allow us to predict churn and implement timely retention
strategies to prevent this loss. We propose using Support Vector Machines (SVMs) to predict at-risk customers
while retraining it, if necessary. By monitoring its recall over 15-day periods, we retrain the model if its recall
on new data falls below 60%. Our research focuses on feature selection to identify key churn factors. Our ex-
periments show that when constantly retraining the model, we avoid accuracy loss by updating the customer’s
context, providing valuable insights on how to reduce churn rates and increase revenue.
1 INTRODUCTION
In today’s dynamic business environment, compa-
nies often prioritize switching partners over build-
ing strong relationships (Tamaddoni Jahromi et al.,
2014). To avoid revenue loss from customer churn,
B2B companies need predictive methods. Analyzing
past churn data and product usage can help predict
and prevent future churn, protecting revenue.
Churn prediction allows targeted customer strate-
gies. By analyzing recent product usage and com-
paring it to similar companies that experienced churn,
models can identify warning signs and proactively
prevent attrition.
Existing research has explored various automated
customer retention methods. However, a crucial gap
remains in understanding the temporal dynamics of
churn prediction models. As customer needs and
a
https://orcid.org/0009-0000-2777-4581
b
https://orcid.org/0009-0007-0321-3334
c
https://orcid.org/0009-0004-9593-7601
d
https://orcid.org/0009-0003-2011-3715
e
https://orcid.org/0000-0002-9921-3588
f
https://orcid.org/0000-0002-1523-1616
product demands evolve (Li et al., 2023), the under-
lying patterns driving churn may also shift. Conse-
quently, static churn prediction models, trained on
historical data, may lose their effectiveness over time.
Our hypothesis is that, to maintain predictive accu-
racy, churn models must be dynamically updated to
reflect these evolving customer behaviors and prod-
uct requirements.
This paper uses Support Vector Machines (SVMs)
on historical churn data to predict customer churn in
15-day intervals, using strategic feature selection. Ev-
ery two weeks, the predictions are re-evaluated based
and classified as correct or incorrect. This reduces
churn and measures the revenue from strategies for
at-risk customers. The dataset used in this study
comprises over 8,000 Small and Medium Enterprises
(SMEs) in the context of HR services. Although reac-
tive methods allow for some level of customer reten-
tion, the dynamic updates on churn predictors provide
valuable insights to B2B companies, helping busi-
nesses take proactive retention strategies. Namely, we
contribute by:
• Applying SVMs to predict customer churn with
dynamic data and updated models.
572
Oliveira, V. E. A., Guimarães, A. C. C., Soares de Quadros, A. R., Mazo, R. N., Gaspar, R. L. S., Vieira, A. and Brandão, W. C.
Predicting B2B Customer Churn and Measuring the Impact of Machine Lear ning-Based Retention Strategies.
DOI: 10.5220/0013436300003929
In Proceedings of the 27th International Conference on Enterprise Information Systems (ICEIS 2025) - Volume 1, pages 572-581
ISBN: 978-989-758-749-8; ISSN: 2184-4992
Copyright © 2025 by Paper published under CC license (CC BY-NC-ND 4.0)

• Demonstrating the performance degradation of
static churn prediction models over time, high-
lighting the need for dynamic updates.
• Using feature selection to identify key features
for churn prediction, improving customer reten-
tion strategies.
This paper has five sections. Section 2 introduces
customer churn, supervised machine learning, and the
models used: SVM, Logistic Regression, and Sequen-
tial Feature Selection. Section 3 discusses related
work. Section 4 details the methodology: data pre-
processing, feature selection, model architecture, and
evaluation metrics. Section 5 presents and analyzes
the results. Section 6 concludes and suggests future
research.
2 BACKGROUND
This section defines key concepts used in this paper,
including Customer Churn, Machine Learning Algo-
rithms, Support Vector Machines, and Feature Selec-
tion Methods.
2.1 Customer Churn
Customer churn is the probability that a customer
will end their relationship with a company (Kamakura
et al., 2005). Since acquiring new customers is
often more expensive than retaining existing ones
(Athanassopoulos, 2000; Tamaddoni Jahromi et al.,
2014), accurately measuring and predicting churn is
essential for business health.
2.2 Supervised Machine Learning
Supervised machine learning trains a model to predict
a target variable (Y ) from input features (X) (Nasteski,
2017). The model can be a regressor (for continuous
values) or a classifier (for categorical values). Typ-
ically, the data is split into training (e.g., 80%) and
validation (e.g., 20%) sets.
2.3 Support Vector Machine
A Support Vector Machine (SVM) is a supervised
learning algorithm that separates data points from dif-
ferent classes using a linear or non-linear function
(e.g., a line or hyperplane). See (Mammone et al.,
2009) for more details.
2.4 Feature Selection Methods
Feature selection is crucial in AI modeling, especially
with real-world data (Kumar and Minz, 2014). Ir-
relevant or redundant features can hurt model perfor-
mance. This study uses Sequential Feature Selection
and Logistic Regression for feature selection.
2.4.1 Sequential Feature Selection
Sequential Feature Selection (SFS) selects the n fea-
tures that maximize accuracy, measured across cross-
validated models. The best performing set is kept.
Sequential Forward Floating Selection (SFFS) is
a variation of SFS. SFFS iteratively adds or removes
features based on their contribution to accuracy. The
“floating” search allows the algorithm to remove pre-
viously selected features if they become redundant.
2.4.2 Logistic Regression
Logistic Regression is a supervised learning model
often used for feature selection. It can effectively
measure feature importance and reduce data dimen-
sionality without significant loss of accuracy (Cheng
et al., 2006). In this study, Logistic Regression is used
for feature selection, not classification.
3 RELATED WORKS
Customer churn prediction has gained significant at-
tention in recent years, particularly in industries such
as telecommunications, banking, e-commerce, and
B2B services (Manzoor et al., 2024). Various ma-
chine learning models have been applied to iden-
tify patterns and predict churn, with particular fo-
cus on models such as Support Vector Machines
(SVM), Random Forest, K-Nearest Neighbors, Gradi-
ent Boosting, Logistic Regression, Naive Bayes, De-
cision Trees and Neural Networks (A. and D., 2016).
In the telecommunications sector, multiple stud-
ies emphasize the effectiveness of ensemble methods
and Support Vector Machines (SVMs) for churn pre-
diction. According to (Poudel et al., 2024), which uti-
lizes a telecommunications dataset from Kaggle, Gra-
dient Boosting Machine (GBM) achieved the highest
accuracy at 81%, outperforming models like SVM,
Logistic Regression, Random Forest, and Neural Net-
works. In contrast, (Ullah et al., 2019), analyzing a
South Asian mobile communications service provider
dataset, showed that Random Forest outperformed
Decision Trees, Naive Bayes, Bagging, and Boost-
ing, with an accuracy of 88.63%. However, (Rodan
Predicting B2B Customer Churn and Measuring the Impact of Machine Learning-Based Retention Strategies
573
et al., 2014), which examined customer churn in a Jor-
danian telecommunications company, demonstrated
that SVM achieved an outstanding accuracy of 98.7%,
surpassing other models like Neural Networks, Deci-
sion Trees, and Naive Bayes, highlighting its robust-
ness in handling telecommunications datasets.
In the banking domain, studies such as (Tran et al.,
2023) and (Xiahou and Harada, 2022) highlight the
effectiveness of advanced algorithms, demonstrating
that integrating k-means clustering with SVM can
significantly enhance prediction accuracy. The first
study, based on a Kaggle dataset containing informa-
tion on banking customers, found that Random Forest
consistently outperformed other models, achieving an
accuracy of up to 97.4%. Similarly, in the B2C e-
commerce sector, research by (Xiahou and Harada,
2022), using a dataset from Alibaba Cloud Tianchi,
showed that SVM, after performing customer seg-
mentation, outperformed Logistic Regression with an
accuracy of 91.56%, further highlighting its effective-
ness in predicting customer churn.
In the B2B sector, churn prediction often involves
analyzing complex customer behavioral and transac-
tional patterns. (Tamaddoni Jahromi et al., 2014)
explored models such as Decision Trees and Ad-
aBoost, highlighting the latter’s effectiveness in ad-
dressing class imbalances. Similarly,(Gordini and
Veglio, 2017), using data from an Italian online re-
tail company, demonstrated the superiority of AUC-
optimized SVM over traditional SVM, Neural Net-
works, and Logistic Regression, achieving an ac-
curacy of 89.67%. In subscription-based services,
(Coussement and Van den Poel, 2008), analyzing data
from a Belgian newspaper publisher, highlighted the
utility of SVM, particularly with AUC-based param-
eter tuning. However, Random Forest ultimately de-
livered the highest predictive accuracy. Collectively,
these findings highlight SVM’s adaptability and effec-
tiveness, positioning it as a strong candidate for B2B
churn prediction tasks where precise customer reten-
tion strategies are critical.
4 METHODOLOGY
This section presents the proposed customer churn
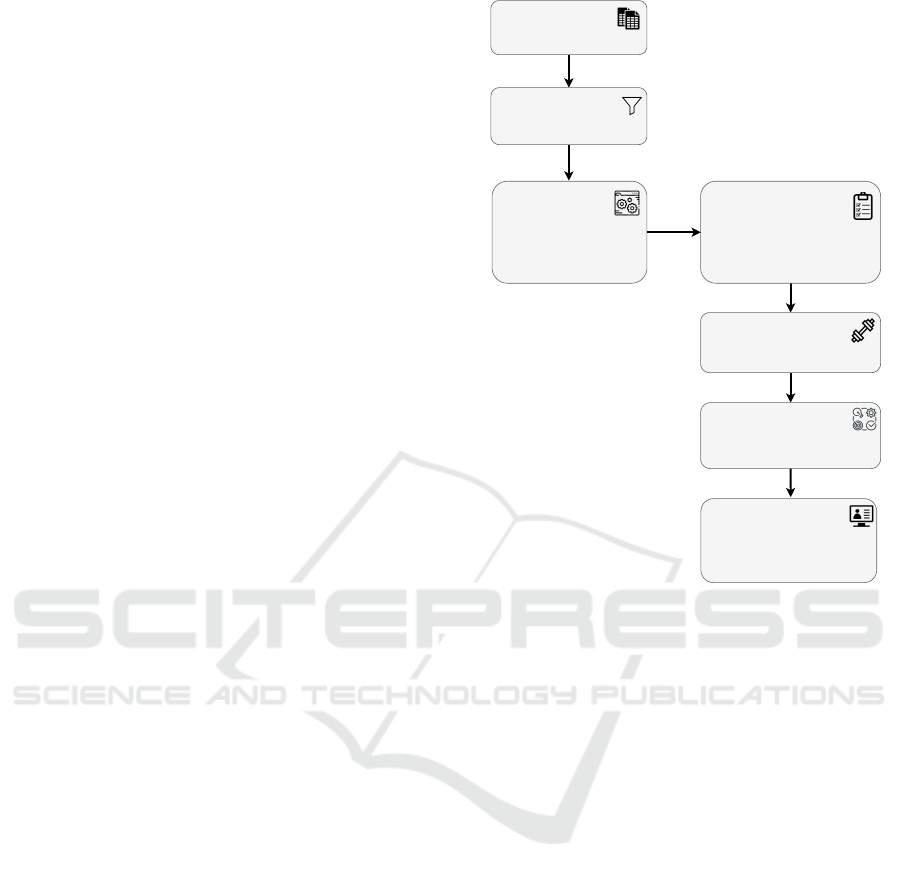
prediction model, as illustrated in Figure 1.
This diagram outlines the methodology for a cus-
tomer churn prediction project within an HR com-
pany. The process begins with gathering datasets re-
lated to churn prediction and customer usability. A
sampling process focuses on active customers rele-
vant to churn prediction. Feature engineering fol-
lows, involving calculating differences in months
Feature Selection
Logistic Regression
Sequential Forward Floating Selection
5 Fold Cross-validation
Datasets
Churn Prediction
Customer Usability
Sampling Process
Active Customers
Churn Prediction
Feature Engineering
Interval Features
Difference in Months and Days
Product Remapping
One-Hot Encoding
Handling Missing Values
Training Models
Support Vector Machine (SVM)
Evaluation
Accuracy, Precision, Recall, F1-score
Explainer Models
Tabular data
Fast API
Streamlit
Figure 1: An illustration of the data processing, model train-
ing, evaluation and explainer models on the customer churn
data.
and days, creating interval features, remapping prod-
uct categories, applying one-hot encoding, and han-
dling missing values. Feature selection utilizes logis-
tic regression, Sequential Forward Floating Selection
(SFFS), and 5-fold cross-validation. A Support Vec-
tor Machine (SVM) model is then trained on the se-
lected features. The model is evaluated using met-
rics such as accuracy, precision, recall, and F1-score.
Finally, explainer models, including, Fast API, and
Streamlit, are used to interpret the model’s predictions
and understand the key drivers of churn.
4.1 Data Preprocessing
4.1.1 Dataset
The dataset used in this study comes from an Human
Resources Technologies (HR Tech) company and in-
cludes 8,878 business customers, all categorized as
Small and Medium Enterprises (SMEs). These cus-
tomers span various sectors, including commerce, re-
tail, technology, consultancy, marketing, and services.
They are classified within the company’s portfolio
based on the number of employees registered on the
platform. The Customer Relation Manager (CRM)
ICEIS 2025 - 27th International Conference on Enterprise Information Systems
574

database was used during the period from March 2024
to November 2024.
Additionally, all available data from canceled cus-
tomers were used, while for active customers, a strat-
ified sample was used. The combination of these two
datasets forms the final dataset used to train the SVM
model. Including canceled customers is crucial for
the model to learn to identify the factors that lead
to churn and, consequently, predict the probability of
churn for new customers.
4.1.2 Sampling Process
Active user data is divided into groups based on the
unique products. For each product category, a sample
size is calculated proportionally to the representation
of that stratum in the original dataset. Equation 1 dis-
plays how we calculate this.
¯
S = c
S
N
(1)
where c is the multiplication factor defined as 1.5
times the size of the canceled users dataset. This en-
sures that the final dataset has a higher proportion of
users who canceled. S is the number of active users
belonging to the specific product category, and N is
the total number of active users. If
¯
S ≤ 0,
¯
S is set to
1, ensuring that all products are present in the train-
ing dataset, regardless of length. For each group, we
randomly select
¯
S samples, and combine each random
sample, generating a final stratified sample containing
all groups.
4.1.3 Feature Engineering
Feature engineering is performed in several stages
to prepare raw data for training the churn prediction
model. The primary transformations include:
• Difference in Months: Calculates the number of
months between a customer’s subscription date
and the current date.
• Difference in Days: Calculates the number of
days between various event dates (last login, last
job post created, etc.) and the current date. The
generated features are named as “days without the
event”.
• Interval Features: Creates interval features (bins)
for numerical features calculated in the previous
steps. The values of each feature are divided into
intervals based on quartiles, generating features
such as “interval months subscriber” (from 0 to
12), “interval days without logging” (from 0 to 7),
and so on.
• Product Remapping: Groups similar product cat-
egories into more general categories.
• One-Hot Encoding: Converts categorical features
into dummy variables (0 or 1).
• Missing Value Treatment: Replaces missing val-
ues with 0.
Based on the transformations performed, the fea-
tures were classified into two main types: numeri-
cal and categorical. These types were organized into
functional groups to facilitate analysis, including Us-
ability, Engagement, Performance, Interval Usability,
and Interval Performance, as described in Table 1.
The Engagement group includes numerical features
that capture users’ direct interaction with the plat-
form, while the Usability group contains both numer-
ical and interval features that monitor behaviors and
usage patterns. The Performance group evaluates the
outcomes generated by user actions and also includes
both numerical and interval features. The Product
group includes information about the service terms
contracted by the customer. This classification was
designed to preserve the confidentiality of the orga-
nization’s operational details while ensuring that the
data provides relevant insights for churn analysis.
4.1.4 Feature Selection
To select features, we employed a Logistic Regression
model and selected the most significant features by
removing those that did not contribute to the model’s
accuracy (Ververidis and Kotropoulos, 2005). After
that, we applied SFFS for feature selection. The se-
lected features were chosen based on the 5-fold cross-
validation results of the trained model.
The accuracy metric, reflecting the proportion
of correct classifications, was used to evaluate the
model’s performance. To reduce dimensionality with-
out sacrificing crucial information, only the top 34
most relevant features were selected, as shown in Ta-
ble 1.
4.2 Model Architecture
After selecting the most significant features, the
dataset was divided into subsets of training and test-
ing, with 75% and 25% of the data being allocated for
training and testing, respectively.
To address the class imbalance in the dataset,
weights were assigned to the classes, with the no-
churn class given a higher weight (2) and the churn
class a lower weight (1). This exploratory approach
aimed to balance the influence of both classes dur-
ing model training, ensuring the no-churn class had
Predicting B2B Customer Churn and Measuring the Impact of Machine Learning-Based Retention Strategies
575
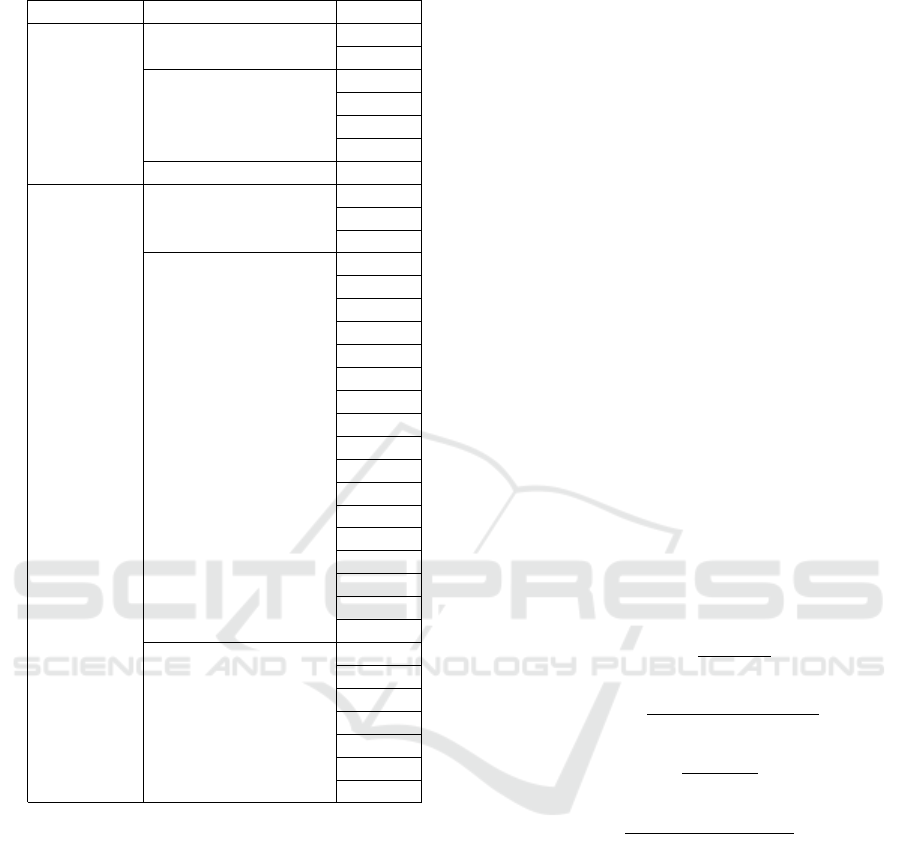
Table 1: Features analyzed in the model.
Type Group Feature
Numerical
Engagement
F1
F2
Usability
F3
F4
F5
F6
Performance F7
Categorical
Product
F8
F9
F10
Interval Usability
F11
F12
F13
F14
F15
F16
F17
F18
F19
F20
F21
F22
F23
F24
F25
F26
F27
Interval Performance
F28
F29
F30
F31
F32
F33
F34
greater significance in shaping the model’s learning
process.
However, this balancing approach is not equiva-
lent to the more well-known techniques in the litera-
ture, such as oversampling or undersampling (Drum-
mond and Holte, 2003). Unlike these techniques,
which alter the quantity of data in each class, this ap-
proach adjusts the importance of each class, allow-
ing the model to account for the disproportionate im-
pact of imbalanced classes without altering the origi-
nal data structure. This helps improve the model’s ac-
curacy by mitigating potential biases toward the ma-
jority class and balancing learning and prediction be-
tween the two classes.
The model used to predict customer non-churn
was the Support Vector Machine (SVM), which
proved to be suitable for binary classification prob-
lems with high-dimensional data (Mammone et al.,
2009). In the model construction process, the Lin-
ear kernel was chosen, which tries to separate the
classes through a linear hyperplane in the original
data space. The choice of this kernel is due to its
computational simplicity and suitability for problems
where the classes are approximately linearly separa-
ble (Cortes and Vapnik, 1995).
The performance of the SVM with the Linear ker-
nel strongly depends on the regularization parame-
ter C, which controls the trade-off between maximiz-
ing the margin separating the classes and minimizing
classification errors. When the value of C is high,
the model tries to minimize classification errors dur-
ing training at all costs, which can lead to overfit-
ting. On the other hand, when the value of C is low,
the model accepts more errors, prioritizing the sepa-
ration between classes, which can result in underfit-
ting (Coussement and Van den Poel, 2008). Based on
this, the chosen value was 1.0, as it provided a good
balance between maximizing the margin of separation
and minimizing classification errors.
4.3 Evaluation Metrics
For the model’s quality assessment, the metrics of ac-
curacy (Equation 3), recall (Equation 4), and f1-score
(Equation 5) were applied.
precision =
T P
T P + FP
(2)
accuracy =
T P + T N
T P + FN + T N + FP
(3)
recall =
T P
T P + FN
(4)
F1 =
2 × precision × recall
precision + recall
(5)
In equations 2, 3, 4, and 5, T P, FP, T N, and FN
represent true positive, false positive, true negative,
and false negative, respectively. In our context, for a
given observation, the model:
• Correctly predicts a non-churned customer, for
T P.
• Incorrectly predicts a non-churned customer as
churned, for FP.
• Correctly predicts a churned customer, for T N.
• Incorrectly predicts a churned customer as non-
churned, for FN.
More specifically, Equation 3 measures the overall
proportion of correct predictions. Equation 4 quanti-
fies the proportion of true positive instances among
ICEIS 2025 - 27th International Conference on Enterprise Information Systems
576
all actual positive instances. Equation 5 calculates the
harmonic mean of precision and recall, providing a
balanced measure of the model’s performance. Ide-
ally, all values should approach 1, indicating optimal
performance.
Recall was specifically used for determining if the
model needed to be retrained or not. On a threshold
of 60% recall, we defined the need for retraining if
a trained model achieved a recall of less than 60%.
The use for recall instead of any other metric is that
there is a need to update the true model’s capacity for
avoiding churns, and the recall measures exactly this,
while others do not.
5 RESULTS
5.1 Experiments
The analysis of predictions for all customers over a 6-
month period, using a single train/test split, revealed
distinct results for the SVM model. In this scenario,
the model achieved an accuracy of 0.79, precision of
0.44, recall of 1.00, and an F1-Score of 0.62, as shown
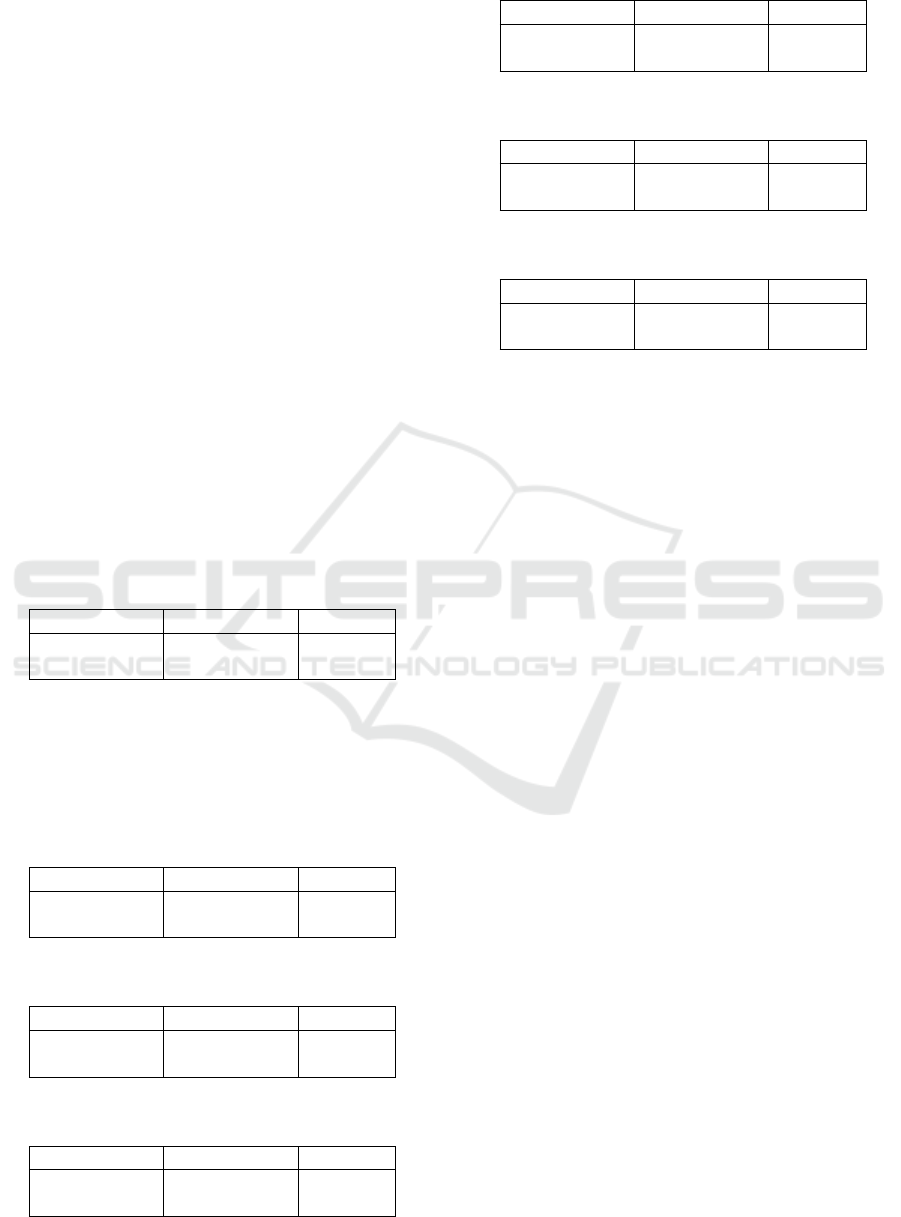
in Table 2.
Table 2: Overall confusion matrix.
– Non-churners Churners
Non-churners 5459 1901
Churners 582 936
Comparing these results with the biweekly analy-
sis, we identified significant differences. These varia-
tions are detailed in tables 5 to 8, highlighting poten-
tial implications for retention strategies and necessary
adjustments to the model for different time windows.
Table 3: Confusion matrix for the first biweekly period.
– Non-churners Churners
Non-churners 5514 1665
Churners 56 112
Table 4: Confusion matrix for the second biweekly period.
– Non-churners Churners
Non-churners 5735 1695
Churners 58 152
Table 5: Confusion matrix for the third biweekly period.
– Non-churners Churners
Non-churners 4886 1531
Churners 37 75
Table 6: Confusion matrix for the fourth biweekly period.
– Non-churners Churners
Non-churners 5171 1546
Churners 34 49
Table 7: Confusion matrix for the fifth biweekly period.
– Non-churners Churners
Non-churners 5453 1900
Churners 40 84
Table 8: Confusion matrix for the sixth biweekly period.
– Non-churners Churners
Non-churners 5514 1665
Churners 56 112
5.2 Metrics Analysis
The biweekly analysis accuracy (0.74 to 0.77) was
similar to the previous analysis (0.79), showing con-
sistent overall classification performance. However,
accuracy can be misleading with imbalanced classes
or unequal error costs (false positives/negatives)
(Coussement and Van den Poel, 2008). A model pre-
dicting all customers as “non-churn” can have high
accuracy but be useless (Coussement and Van den
Poel, 2008). Precision is important in churn predic-
tion because false positives lead to unnecessary reten-
tion costs (Coussement and Van den Poel, 2008).
The biweekly analysis precision (0.03 to 0.08)
was much lower than the previous precision (0.44),
indicating a significant increase in false positives.
While the earlier analysis balanced precision and re-
call, the biweekly analysis prioritized recall at the
cost of precision. This low precision suggests a per-
sistent problem with false positives (Coussement and
Van den Poel, 2008). The drop in precision suggests
the traditional approach overestimated the model’s
generalization ability. (Tamaddoni Jahromi et al.,
2014) and (Coussement and Van den Poel, 2008)
emphasize the importance of considering the time-
varying nature of churn data, as customer behavior
changes. The biweekly analysis captures this varia-
tion for a more realistic performance assessment.
The biweekly analysis recall (0.59 to 0.72) was
lower than the previous perfect recall (1.00). This in-
dicates the model missed more churning customers in
the biweekly analysis.
The biweekly analysis F1-score (0.06 to 0.15) was
also much lower than the previous F1-score (0.62),
reflecting the poor precision.
The main difference between the results is the
lower precision in the biweekly analysis. This sug-
Predicting B2B Customer Churn and Measuring the Impact of Machine Learning-Based Retention Strategies
577

gests the single train/test split overestimated the
model’s generalization. The biweekly analysis re-
veals a tendency for more false positives, negatively
impacting precision. Comparing the biweekly re-
sults with the single train/test split results (accuracy
0.79, precision 0.44, recall 1.00, F1-score 0.62) is
crucial. The precision drop suggests the traditional
approach overestimated generalization. (Tamaddoni
Jahromi et al., 2014) and (Coussement and Van den
Poel, 2008) highlight the importance of considering
temporal data variation in churn modeling. The bi-
weekly analysis captures this and provides a more re-
alistic performance view.
The decreased recall in the biweekly analysis is
also important, showing a reduced ability to iden-
tify at-risk customers. However, the precision drop is
the main contributor to the lower F1-score. (Tamad-
doni Jahromi et al., 2014) address B2B churn, propos-
ing an approach that considers customer heterogene-
ity and profit. While not discussing biweekly analysis
directly, their emphasis on temporal variation and ro-
bust models supports the idea that these metrics are
affected by the time frame used (Tamaddoni Jahromi
et al., 2014).
Figure 2 shows our six biweekly intervals and
model updates when recall is below our threshold.
Figure 2: Recall of models leading to retraining.
When recall falls below the threshold, we retrain
the model to keep it above 60%. These values indicate
that changing customer needs often reduce model ca-
pabilities, requiring periodic retraining.
(Coussement and Van den Poel, 2008) compare
SVM parameter selection for churn prediction. While
focusing on modeling, their discussion of model gen-
eralization and performance evaluation across scenar-
ios (including class distributions) supports biweekly
analysis. Their use of a time window for predictive
variables further supports analyzing temporal data
variation (Coussement and Van den Poel, 2008).
5.3 Models Analysis
The feature selection resulted in a subset of 10 fea-
tures deemed most relevant for churn prediction. The
accuracy achieved during cross-validation in the fea-
ture selection process was 0.72. (Tamaddoni Jahromi
et al., 2014) and (Coussement and Van den Poel,
2008) emphasize the importance of considering tem-
poral variation in data when modeling churn, as cus-
tomer behavior and the factors influencing churn can
change over time. Biweekly analysis, by evaluating
the model across different periods, captures this vari-
ation and provides a more realistic assessment of its
performance.
The trained SVM model was then evaluated on a
separate test set, similarly, (Rodan et al., 2014) focus
on using SVM to predict churn in the telecommuni-
cations industry. The authors employ metrics such as
accuracy, hit rate, churn rate, and lift coefficient to
evaluate the SVM model’s performance and compare
it with other approaches, such as neural networks and
decision trees. Although they do not explicitly men-
tion AUC or Gini, their emphasis is on the model’s
ability to correctly identify customers likely to churn
(Rodan et al., 2014).
The high AUC (0.9029) and Gini coefficient
(0.8057) indicate excellent model discrimination, ef-
fectively distinguishing churn customers from non-
churn customers. According to (Coussement and
Van den Poel, 2008), AUC is a crucial metric for eval-
uating churn models, as it is more robust to varying
classification thresholds and class imbalances com-
pared to accuracy. The authors conduct statistical
tests to compare the AUC of different models, includ-
ing SVMs and logistic regression. Additionally, they
emphasize the importance of lift and top-decile lift,
which assess the model’s ability to identify customers
with the highest likelihood of churn.
Similarly, (Poudel et al., 2024) compare various
models, including GBM and neural networks, using
metrics such as accuracy, precision, recall, F1-score,
ROC-AUC, and PR-score (area under the Precision-
Recall curve). They also employ SHAP values to ex-
plain the model’s predictions, providing insights into
the key features influencing the results.
In summary, the SVM model, trained with an
optimized subset of 34 features via SFFS, demon-
strated excellent performance in churn prediction, ev-
idenced by high accuracy and AUC. Analysis with co-
efficient values provided actionable insights into the
main drivers of churn, highlighting the importance of
customer engagement, especially regarding frequent
logins, job creation, and the occurrence of positive in-
teractions on the platform.
ICEIS 2025 - 27th International Conference on Enterprise Information Systems
578

Figure 3: Features importance analyzed.
5.4 Features Analysis
Feature F11, with a coefficient of 1.4186, indicates
that customers inactive for 8 to 44 days are signif-
icantly more likely to churn, highlighting the im-
portance of regular engagement. Strategies such as
sending relevant content and personalized notifica-
tions could be effective in mitigating churn. The im-
portance of frequent logins is corroborated by vari-
ous studies on churn in online services. In the paper
by (Poudel et al., 2024) the feature “Tenure Months”
(subscription duration) has a strong impact on churn,
and inactivity for 8-44 days can be an early sign of
disinterest. The suggestion to send relevant content
and personalized notifications aligns with retention
strategies focused on proactive engagement, as dis-
cussed by (Tamaddoni Jahromi et al., 2014).
Feature F15, with a coefficient of 1.2309, also
points to a high churn risk when customers don’t cre-
ate new job postings for 69 to 823 days. Actively
using this feature suggests they are engaged and less
likely to churn. Offering tutorials and support to en-
courage job postings could be helpful (Coussement
and Van den Poel, 2008). Increasing customer en-
gagement with key platform features, like job post-
ings, can effectively reduce churn.
Feature F31, with a coefficient of 1.5098, is the
most significant predictor of churn, highlighting the
critical impact of positive interactions (e.g., feedback,
promotions) on customer retention. A lack of such
interactions for 37 to 55 days is an even stronger in-
dicator of churn than inactivity in logins or job post-
ings. This underscores the importance of continuous
engagement beyond mere platform usage. To miti-
gate churn, companies should proactively foster pos-
itive interactions through strategies like gamification,
rewards, and recognition, ensuring customers feel val-
ued and engaged.
Feature F27, with a coefficient of 0.7588, indi-
cates that not using the engineering feature for 101
to 200 days increases churn risk. Like feature F15,
this highlights the importance of regularly using plat-
form features. While “engineering” may be less criti-
cal than job creation, promoting its use is still impor-
tant for retention.
Feature F30, with a coefficient of 0.9003, is sim-
ilar to F31. It shows that not having positive inter-
actions for 31 to 36 days also increases churn risk,
though slightly less. Both features emphasize the im-
portance of positive occurrences, but the 37-55 day
period (F31) appears more critical.
Features F16 (coefficient 0.1969) and F17 (coeffi-
cient 0.2494) both show that any period of inactivity
without creating profiles increases churn risk. This
suggests that regularly creating profiles is a key sign
of customer engagement, though less impactful than
other features.
Feature F1, with a coefficient of 0.0477, indicates
that a high number of open job postings slightly in-
creases the likelihood of churn. This might mean
users are frustrated with the recruitment process. It’s
worth checking if these jobs are hard to fill or if there
are platform usability issues.
Feature F13, with a coefficient of -0.3513, shows
that short breaks (3 to 7 days) in creating job postings
are linked to a lower churn risk. This could be a nor-
mal pattern, where users post jobs, wait for results,
and then continue.
Feature F22, with a coefficient of -1.1810, reveals
that not having evaluations for 3 to 229 days is tied
to a lower churn risk. This suggests that how often
users evaluate may not directly show their satisfac-
tion. Happy customers may not feel the need to con-
stantly evaluate.
The coefficient analysis of each feature highlights
that keeping customers engaged and consistently us-
ing platform features is crucial for retention. By un-
derstanding these factors, companies can create tar-
geted strategies to reduce churn. Personalized re-
tention strategies should be developed based on the
coefficient analysis of each feature. For example,
those with high coefficient for days without logging
in should receive engagement incentives. Tracking
the evolution of each coefficient analysis can also
help identify changes in customer behavior and adapt
strategies accordingly.
Using coefficient analysis of each feature with
other metrics, such as AUC, precision, and recall, pro-
vides a more complete picture of the model’s perfor-
mance and what drives churn.
5.5 Result Discussions
The SVM model displays overall good performance
regarding recall when it is re-trained periodically. The
Predicting B2B Customer Churn and Measuring the Impact of Machine Learning-Based Retention Strategies
579

results show that with time the pattern changes, thus
reducing the capabilities of the obsolete model to cor-
rectly assess the predictions. This indicates the need
for constant updates on model training to optimize re-
call.
Consistent analysis identifies customer inactivity
as a strong predictor of churn. Long periods without
logins (F11), job postings (F15), or positive interac-
tions (F31) strongly indicate higher churn risk.
Addressing B2B churn in HR Tech is challeng-
ing. To our knowledge, there are few studies specifi-
cally on HR Tech churn, highlighting the novelty and
importance of our work. Our findings offer valuable
insights into HR Tech churn factors, enabling tailored
retention strategies. By focusing on proactive engage-
ment and addressing inactivity, HR Tech companies
can improve customer retention.
6 CONCLUSIONS AND FUTURE
WORKS
This study investigated churn prediction in a B2B
context using biweekly data and a SVM model with a
linear kernel. Feature selection through SFFS, com-
bined with interpretability analysis based on the co-
efficient values of each feature, enabled the identifi-
cation of key churn drivers and the development of
actionable insights for retention strategies.
The model’s accuracy stability across the analyzed
biweekly periods demonstrates its robustness to tem-
poral data variations, a crucial aspect in dynamic envi-
ronments like B2B. Additionally, the consistent mini-
mization of false positives in four out of five biweekly
periods reduces the cost of unnecessary interventions,
optimizing retention resources.
The coefficient analysis of each feature revealed
valuable insights into customer behavior and the
factors influencing churn. Platform inactivity, ex-
tended periods without creating new job postings, and
the absence of positive occurrences emerged as the
strongest predictors of churn. These findings align
with existing literature emphasizing the importance
of customer engagement and positive service experi-
ences for retention. The analysis also highlighted the
influence of other features, such as inactivity in the
engineering functionality and profile creation, point-
ing to the need for further investigation into the rela-
tionship between evaluation frequency and churn.
Despite stable accuracy, our results indicate that
the recall falls over customer necessities. Because
of this, it may be necessary to periodically retrain
the model for more consistent results. The discrep-
ancy suggests potential overfitting in the traditional
approach and underscores the importance of temporal
validation for a more realistic assessment of model
performance.
This study contributes to B2B churn prediction by
identifying key churn drivers, demonstrating the value
of coefficient-based feature analysis for model inter-
pretability, and proposing targeted retention strate-
gies, such as encouraging frequent logins, promoting
key functionalities, and fostering positive platform in-
teractions. For future research, exploring alternative
machine learning models, including ensemble meth-
ods (Random Forest, Gradient Boosting) and Deep
Learning approaches, could provide valuable perfor-
mance comparisons with SVM. Additionally, incor-
porating class balancing techniques, such as Class
Weight adjustments, SMOTE, and Random Over and
Under-Sampling, may improve model effectiveness
by addressing data imbalance. Further investigation
of new predictive features, such as detailed behavioral
metrics, contextual company characteristics, and sea-
sonal factors, could enhance model accuracy and pro-
vide deeper insights into customer retention dynam-
ics.
REFERENCES
A., S. and D., C. (2016). A Survey on Customer Churn Pre-
diction using Machine Learning Techniques. Interna-
tional Journal of Computer Applications, 154:13–16.
Athanassopoulos, A. D. (2000). Customer satisfaction cues
to support market segmentation and explain switching
behavior. Journal of Business Research, 47(3):191–
207.
Cheng, Q., Varshney, P. K., and Arora, M. K. (2006). Lo-
gistic regression for feature selection and soft classifi-
cation of remote sensing data. IEEE Geoscience and
Remote Sensing Letters, 3(4):491–494.
Cortes, C. and Vapnik, V. (1995). Support-vector networks.
Machine Learning, 20(3):273–297.
Coussement, K. and Van den Poel, D. (2008). Churn predic-
tion in subscription services: An application of sup-
port vector machines while comparing two parameter-
selection techniques. Expert Systems with Applica-
tions, 34(1):313–327.
Drummond, C. and Holte, R. (2003). C4.5, class imbalance,
and cost sensitivity: Why under-sampling beats over-
sampling. Proceedings of the ICML’03 Workshop on
Learning from Imbalanced Datasets.
Gordini, N. and Veglio, V. (2017). Customers churn pre-
diction and marketing retention strategies. An appli-
cation of support vector machines based on the AUC
parameter-selection technique in B2B e-commerce in-
dustry. Industrial Marketing Management, 62:100–
107.
Kamakura, W., Mela, C. F., Ansari, A., Bodapati, A., Fader,
P., Iyengar, R., Naik, P., Neslin, S., Sun, B., Verhoef,
ICEIS 2025 - 27th International Conference on Enterprise Information Systems
580

P. C., et al. (2005). Choice models and customer rela-
tionship management. Marketing letters, 16:279–291.
Kumar, V. and Minz, S. (2014). Feature selection. SmartCR,
4(3):211–229.
Li, Y., Cheng, Y., Ni, Y., and Zhang, N. (2023). Assess-
ment of product resilience towards the changing cus-
tomer requirements. Journal of Engineering Design,
34(8):561–590.
Mammone, A., Turchi, M., and Cristianini, N. (2009). Sup-
port vector machines. Wiley Interdisciplinary Re-
views: Computational Statistics, 1(3):283–289.
Manzoor, A., Atif Qureshi, M., Kidney, E., and Longo, L.
(2024). A Review on Machine Learning Methods for
Customer Churn Prediction and Recommendations
for Business Practitioners. IEEE Access, 12:70434–
70463.
Nasteski, V. (2017). An overview of the supervised machine
learning methods. Horizons. b, 4(51-62):56.
Poudel, S. S., Pokharel, S., and Timilsina, M. (2024). Ex-
plaining customer churn prediction in telecom indus-
try using tabular machine learning models. Machine
Learning with Applications, 17:100567.
Rodan, A., Faris, H., Al-sakran, J., and Al-Kadi, O. (2014).
A Support Vector Machine Approach for Churn Pre-
diction in Telecom Industry. International journal on
information, 17.
Tamaddoni Jahromi, A., Stakhovych, S., and Ewing, M.
(2014). Managing b2b customer churn, retention
and profitability. Industrial Marketing Management,
43(7):1258–1268.
Tran, H. D., Le, N., and Nguyen, V.-H. (2023). Customer
Churn Prediction in the Banking Sector Using Ma-
chine Learning-Based Classification Models. Inter-
disciplinary Journal of Information, Knowledge, and
Management, 18:087–105.
Ullah, I., Raza, B., Malik, A. K., Imran, M., Islam, S. U.,
and Kim, S. W. (2019). A Churn Prediction Model
Using Random Forest: Analysis of Machine Learn-
ing Techniques for Churn Prediction and Factor Iden-
tification in Telecom Sector. IEEE Access, 7:60134–
60149.
Ververidis, D. and Kotropoulos, C. (2005). Sequential for-
ward feature selection with low computational cost.
In 2005 13th European Signal Processing Conference,
pages 1–4.
Xiahou, X. and Harada, Y. (2022). B2C E-Commerce Cus-
tomer Churn Prediction Based on K-Means and SVM.
Journal of Theoretical and Applied Electronic Com-
merce Research, 17(2):458–475.
Predicting B2B Customer Churn and Measuring the Impact of Machine Learning-Based Retention Strategies
581
