
Unravelling the Sequential Patterns of Cyber Attacks: A Temporal
Analysis of Attack Dependencies
Fares Ashraf ElSalamony
1
, Nahla Barakat
1a
and Ahmad Mostafa
2b
1
Artificial Intelligence Department, Faculty of Informatics and Computer Science, The British University in Egypt (BUE),
El-Sherouk City, Cairo, Egypt
2
Faculty of Computers and Information Technology, Innovation University, Cairo, Egypt
Keywords: Cyber-Attack Sequence Identification, Deep Learning for Cyber Attacks Detection, Network Intrusion
Detection, Time-Series Attack Prediction.
Abstract: Cybersecurity has become increasingly challenging, particularly in understanding and predicting complex
attack sequences within network traffic. In this paper, we introduce a new approach for predicting cyber-
security attacks utilizing time series data and transformer architecture, which has achieved the state-of-the-art
F1-score for a time series, multiclass problem on the UNSW-NB15 dataset. This is despite earlier studies
either considered binary task only (attack/non-attack) or did not deal with the problem as a time series. For
the first time, we integrated time series prediction with analysis and visualization methods for detecting
possible sequences of cyber-attacks, which were then verified with domain experts. Statistical methods
confirmed the significance of the detected sequence, ensuring that these attacks are not random. Our findings
revealed the existence of patterns of attack sequences, demonstrating how one attack type often precedes
another in predictable patterns. This paper not only fills a critical gap in attack progression modelling but also
introduces advanced visualization and analysis that confirm the predictions of the model.
1 INTRODUCTION
Network intrusion is a significant threat to businesses
and organizations, and to protect against it, networks
use Network-based Intrusion Detection Systems
(NIDS) with signature-based and anomaly-based
detection (Marir et al., 2018). Anomaly detection has
been a main focus since the 1960s, and today's
networks have a large number of datasets and
complex algorithms, allowing for the efficient use of
different approaches such as time series (Darban et
al., 2022). Research in network intrusion detection
has focused on identifying and classifying anomalies
using time series data, leading to a shift from
traditional statistical methods to machine learning
methods (Psychogyios et al., 2023). Time series data
is particularly important in cybersecurity as it can
detect changes over time, identify patterns and
deviations, and allow for real-time analysis and helps
uncover complex anomalies that are not feasible
using traditional analysis. Although research in time
a
https://orcid.org/0000-0003-0826-1590
b
https://orcid.org/0000-0002-1138-3751
series and cybersecurity has been witnessing many
advancements, this field is confronted with several
problems that face both traditional and deep learning
approaches (Al-Ghuwairi et al., 2023). When it
comes to traditional methods such as the
Autoregressive Integrated Moving Average
(ARIMA) and Symbolic Aggregate Approximation
(SAX) models, one main problem is the nature of
cybersecurity threats, which are varying and
dynamic. Also, those methods are largely static and
not able to handle the large volumes and high
velocities of data generated within today's
cybersecurity networks (Smith, 2019).
This paper introduces a new approach for
predicting cyber security attacks utilizing time series
data and transformer architecture, achieving a state-
of-the-art macro F1-score for a time series, multiclass
classification problem on the UNSW-NB15 dataset,
where previous studies either only considered binary
classification task or did not deal with the problem as
a time series. Furthermore, the study integrates for the
394
ElSalamony, F. A., Barakat, N. and Mostafa, A.
Unravelling the Sequential Patterns of Cyber Attacks: A Temporal Analysis of Attack Dependencies.
DOI: 10.5220/0013436500003944
In Proceedings of the 10th International Conference on Internet of Things, Big Data and Security (IoTBDS 2025), pages 394-401
ISBN: 978-989-758-750-4; ISSN: 2184-4976
Copyright © 2025 by Paper published under CC license (CC BY-NC-ND 4.0)

first time; time series prediction with analysis, and
visualization methods for detecting possible
sequences of cyber-attacks, which is verified with
domain experts and shows statistical significance for
the detection sequence of attacks.
1.1 The Paper Contribution
As detailed in the results section, this paper's
contributions are listed below, ordered by their
significance from the authors' point of view:
• For the first time, this study integrates time-
series prediction with analysis and
visualization techniques to identify and detect
cyber-attack sequences,
• Investigating the possible sequence of attacks
on a single IP destination, from different
source IPs,
• Providing insights into how some attack types
evolve,
• Improving the performance of deep learning
models for temporal attack pattern prediction.
The rest of the paper is organized as follows: Section
2 introduces the related work, while Section 3 details
the research methodology. In Section 4, the
experimental setup is described, followed by results
and discussions in Section 5. The paper is concluded
in Section 6.
2 RELATED WORK
Over the last decade, numerous approaches have been
developed to address cyber-attacks, ranging from
signature-based approaches to more advanced
machine learning and deep learning models. The
following section surveys notable contributions in
this field, highlighting both traditional and state-of-
the-art techniques for time series and non-time series
multi-class classification in the field of cybersecurity.
2.1 Non-Time Series Classification
Kasongo et. al. (2020) used the XGBoost algorithm
on the UNSW-NB15 dataset, utilizing a filter-based
feature selection. They also used other algorithms
including KNN, LR, SVMs, ANNs, and DT. The
experiments explored both binary and multiclass
classification setups. Results indicated that
employing XGBoost achieved the best performance
of an F-1 score of 69% for multi-class classification.
Jouhari et al. (2024) suggested a hybrid model that
integrates a lightweight convolutional neural network
(CNN) with bidirectional long short-term memory
(BiLSTM) for intrusion detection in IoT networks.
They implemented a Chi-square feature selection
technique and addressed the issue of class imbalance
by implementing a weighted loss function which
enhanced their model’s performance. Their proposed
solution achieved an F-score of 97.09% for multi-
class classification respectively.
In another study, Al-Obaidi et al., (2023) used
multiple machine learning algorithms on the UNSW-
NB15 to perform multi-class classification. They
performed label encoding then they split the dataset
into 90 % training and 10 % testing. The best model
was XGBoost achieving an F-Score of 68.8% for
multi-class classification. In a recent study by
Talukder et al. (2024), the authors proposed the use
of ML-based intrusion detection, where they used
random oversampling and stacking feature
embeddings. The authors performed data cleansing,
feature scaling, and feature reduction using Principal
Component Analysis (PCA). The authors used 10-
fold cross-validation to train different ML models on
UNSW-NB15, CIC-IDS2017, and CIC-IDS2018
datasets. They performed multi-class classification.
The highest F1-score was 99.9% achieved by the
Random Forest model.
2.2 Time Series Classification
In a study by Psychogyios et al. (2023), the authors
implemented an LSTM model to perform time series
binary classification on the UNSW-NB15 dataset.
They performed data pre-processing including one-
hot encoding to the categorical features and min-max
scaler to perform data scaling. Converting the dataset
to a time series format was the last step in the pre-
processing process. This was accomplished by first
sorting the dataset according to its starting time
feature. Next, time windows W, which are time points
and labels, were created while all the features were
retained. This resulted in a multi-variate time series
problem, where W represents the size of the input
window, and the label is the target that must be
predicted. They utilized the 5-fold cross-validation
technique and averaged the results across the five
folds. They ran multiple experiments with different
W values ranging from 1 to 200, the highest F-score
achieved (80%) was in the experiment where the W
was set to 200 (Psychogyios et al., 2023). In another
study by Alsharaiah et al. (2024), the authors
proposed integrating an LSTM with attention
mechanisms to enhance the analysis of spatial and
temporal features in the network data. The model was
tested on the UNSW-NB15 dataset, after applying
Unravelling the Sequential Patterns of Cyber Attacks: A Temporal Analysis of Attack Dependencies
395

data normalization, and feature encoding for
categorical features. Then, they performed binary
classification with different attention dimensions.
The proposed model achieved accuracy of 82.2% and
92.2% for attention dimensions of 150 and 300
respectively outperforming the existing binary
classification methods applied on the same dataset.
2.3 Identified Research Gap
As shown in Sections 2.1 and 2.2, no studies
investigating the possibility of sequential attack
patterns, while a very small number of studies
considered the temporal patterns in cyber-attack
prediction. Furthermore, the majority of the papers
considered attack predictions as a binary
classification problem (attack/non-attack) and
oversampled the used data sets to achieve high
prediction results. In this paper, the attack progression
modelling is studied, considering the temporal nature
of attacks.
3 PROPOSED METHODOLOGY
3.1 Dataset Description
The dataset used in this paper is the UNSW-NB15
dataset (Moustafa & Slay, 2015), which is widely
used for benchmarking network intrusion detection
systems. The dataset has around 2.5 million records
representing network traffic for multiple source and
destination IPs, as described by 48 features, and a
label representing the attack type. The features
include basic information such as source and
destination IP addresses, as well as more advanced
features such as the packet size, time to live, and
protocol type. This dataset also contains time-based
features, which enable time-series analysis and
studying the temporal patterns of different attacks.
There are 9 attack types, namely, Fuzzers, Analysis,
Backdoors, Denial of Service (DoS), Exploits,
Generic, Reconnaissance, Shellcode, and Worms.
Shellcode and Worms were excluded from our
analysis as, they have an extremely small number of
records, compared to the rest of the attack types. For
a more detailed description of the data set, please
refer to (Azeroual et al., 2022).
3.2 Pre-Processing and Feature
Engineering
As the main objective of this paper is to study the
temporal nature, and possible sequence of attacks, for
each data set, the records were grouped by the
destination IP, where destination IPs with only
normal traffic (with no attacks) are excluded. This
splitting was necessary to study whether there are
specific patterns and/or temporal dependencies
between the different types of attacks and potentially
capturing common attack chains. Table 1 shows the
number of records for each destination IP.
Table 1: Destination IPs and their record original count.
Dataset No. Destination IP No. Records
1 149.171.126.14 45,375
2 149.171.126.10 43,877
3 149.171.126.12 30,308
4 149.171.126.17 26,759
5 149.171.126.13 17,647
6 149.171.126.19 16,022
7 149.171.126.11 14,104
8 149.171.126.16 12,219
Common pre-processing steps have been
performed, such as dropping null values, as well as
excluding records with negative packet length.
Feature selection has been performed to choose the
best set of features, using different feature selection
techniques such as sequential feature selection,
random forest feature importance index, and a
domain expert’s opinion after understanding the
dataset. We ended up with 14 features, including,
transaction bytes, service type (i.e. https), protocol,
TCP connection round-trip, source bits, source to
destination time to live, means of packet sizes, and
some aggregated counts of connection details. The
target class is encoded to integers from 0 to 7. The
data set for each IP is then split into 80 % training and
20% testing. It has been noticed that the normal traffic
(normal class) is a minority class in all destination
IPs, which is not the case in real-world scenarios,
where a majority of the incoming traffic packets are
normal traffic. To handle this issue, the SMOTE
oversampling method has been used on the normal
class only, to maintain the nature of data, where the
majority class (traffic) in all destination IPs is
normal. The generated data by SMOTE was equal in
number to the sum of all the records of other attack
types (i.e., 50% normal, 50% for all other attack types
together). A check on the SMOTE data is performed
to avoid any duplicates on the timestamp feature.
IoTBDS 2025 - 10th International Conference on Internet of Things, Big Data and Security
396

Due to irregular time intervals of the time series,
a new feature named time_interval, which is the
difference in seconds, between the timestamp of each
record and the previous record timestamp. This has
been followed by applying a one-hot encoding
technique to the selected categorical features which
are ‘service’, and ‘proto’. Another important pre-
processing is data scaling, where the StandardScaler
has been used for data scaling.
3.3 Sequence Generation
The input sequence for the model is generated by
sorting the dataset according to timestamps. A
lookback window in seconds (sequence size) and a
future window in seconds (future size) are defined to
create time-based sequences for the model's input.
This process incorporates examining each timestamp
in the dataset, creating a historical window according
to the sequence size, and acquiring future labels from
the following time interval. Consequently, this leads
to sequences of variable length that are incompatible
with the model input requirements. A function is
employed to generate a fixed-length input sequence
within the batch. This function generates an array of
Boolean variables initialized to "True," representing
the padding mask for sequences, based on the
maximum sequence length. The function populates
variable-length sequences into a fixed-length format.
It also applies a padding mask to designate "real" non-
padded positions as "False" within the mask for the
transformer. This differentiation allows the model to
distinguish between actual data and padded positions,
which are to be ignored during training. This method
transforms the dataset into sequences with fixed time
windows, incorporating the time factor and thereby
creating a multi-variate, multi-class time-series
classification problem.
3.4 The Proposed Architecture
In this paper, a transformer architecture has been
used, as transformers are highly beneficial for time-
series analysis. Unlike recurrent networks,
transformers process whole sequences concurrently,
allowing each input element to attend to all other
elements, therefore, the capacity to capture both local
and global dependencies. The used transformer also
has a custom encoder layer that retains attention
weights for each encoder layer. This feature enables
visualization of the model's attention over time steps,
hence improving the model’s interpretability. The
model architecture comprises encoder layers, which
include multi-head attention. Furthermore, positional
encoding is utilized to maintain the sequence order of
the input, enabling the model to monitor both short-
term variations and long-range dependencies. In each
layer, multi-head attention separates the sequence
representations into several subspaces to capture
diverse temporal and contextual patterns. Feed-
forward sub-networks perform transformations on
encodings, followed by dropout and normalization
steps which contributes to the stabilization of
training. A final normalization layer prepares the
output for the decoder layer which is the final layer in
the architecture.
4 EXPERIMENTAL SETUP
In the following section, the selection of the loss
function, model hyper-parameters, regularization
techniques, and training protocol are outlined.
4.1 Model Training
The input features are fed to the Transformer, which
processes sequences using positional encoding then
passed to the custom encoder layers. The padding
mask is passed through the encoder layers to prevent
self-attention computations from ignoring padded
elements. Each layer produces an attention map,
capturing interaction token weights for better
interpretability. Then, the model applies a mask-
aware pooling mechanism, to create a real tokens
mask which is the logical inverse of the padding
mask, and indicates which positions are valid (i.e.,
non-padded). Then, it computes a weighted sum of
hidden representations across the time dimension and
divides it by the count of valid tokens to obtain a
mean representation. The output vector is passed to
the linear decoder layer for final predictions.
To handle the class imbalance problem, the Focal
Loss function has been utilized. Focal Loss modifies
the cross-entropy component by adjusting it
according to the difficulty of predictions, by adding it
in equation (1). This method is especially beneficial
for time-series data in which minority classes are both
rare and essential to identify.
(
1−𝑝
)
(1)
where 𝛾 represents the degree to which easily
classified examples are down-weight and 𝑝
is the
predicted probability for class 𝑡 . In that case, the
model prioritizes challenging or minority-class
instances.
Unravelling the Sequential Patterns of Cyber Attacks: A Temporal Analysis of Attack Dependencies
397

4.1.1 Model Hyper Parameters
The model is configured with an embedding
dimensionality of 128 for each token and employs
multi-head attention with 4 heads. 8 encoder layers
have been used, to facilitate deep feature extraction
from temporal sequences. Every encoder layer
incorporates a dropout probability of 0.2 to prevent
over-fitting. The final classification layer outputs
predictions for the designated number of classes
derived from the encoded sequence representation.
Regularization techniques are implemented to
enhance model’s generalization. A dropout rate of 0.2
is applied within the Transformer layers to reduce the
risk of co-adaptation among hidden units. Secondly,
weight decay of 1 × 10
is utilized in the optimizer
to penalize excessively large weights. These
techniques enable the model to develop more robust
and generalizable patterns from the training data. The
chosen architecture achieves the balance between the
computational cost and successfully capturing the
temporal dependencies between sequences while not
overlooking the minority class and misclassifying
them.
4.1.2 Training Parameters
The maximum number of epochs is set to 50, utilizing
mini-batches of size 8, which is necessitated by the
dataset's complexity. The optimizer used is Adam,
with a learning rate of 1×10
balancing rapid
convergence and the risk of overshooting local
minima. In each mini-batch, the training data are
randomized to decrease correlation among successive
samples. Conversely, validation and testing datasets
are not shuffled to maintain temporal relationships
during evaluation. To avoid over-fitting an early
stopping mechanism is implemented. At the end of
each epoch, the model is evaluated on the validation
set, and the F1 score is recorded. Training is halted if
the F1-score does not improve within a patience
window of five epochs. This criterion ensures that the
model avoids over-fitting.
4.1.3 Evaluation Metrics
The models’ performance is assessed by the F1 score,
Precision, and Recall. These metrics are particularly
vital in imbalanced datasets, as accuracy is biased to
the dominant class. The F1 score, equation is shown
below:
(𝐹1 = 2 ×
×
)
(2)
In time-series multiclass classification, handling class
imbalance is crucial, as minority or unusual events
may appear sporadically.
5 RESULTS AND DISCUSSIONS
5.1 Model’s Performance Results
The data set of the destination IP which has the largest
number of samples (dataset 1) has been used.
Different sets of experiments are conducted using
input sequence sizes of 50, 90, 120, 150, and 200
seconds respectively, while fixing a future size of 10
seconds. In these experiments, it was noticed that
larger input sequences require increased
computational power for model training, yet do not
necessarily produce improved results. The smaller
sequence sizes tend to underperform and fail to
capture the temporal dependencies necessary for the
successful classification of minority classes. The
experiments showed that a sequence size of 90
seconds produced the best results across all tested
sizes while maintaining low computational resource
usage. The experiment was further extended by
increasing the future size from 10 seconds to 30
seconds. The model maintained strong performance
with a sequence size of 90 seconds and a future size
of 30 seconds, demonstrating its capability to capture
the temporal dependencies necessary for classifying
all classes, particularly the minority classes. Table 2
shows the precision, recall, and macro F1-score for
each sequence size and future size evaluated on the
testing dataset. From Table 2, it can be seen that the
sequence size of 90 sec. and the future size of 30 sec.
gave the best F1-score across all the attack classes on
dataset 1. The F1 scores for different attack types in
addition to the attack distribution after applying
SMOTE on normal class for the data set 1 are shown
in Table 3. It can be seen that all classes have been
detected with an F1- score above 90%, except for the
analysis attack, which has the least number of
records.
Table 2: Model’s performance on dataset 1 with different
sequences and future sizes in seconds.
Se
q
. size Future size P
r
e. Rec. Macro F1
50 10 0.83 0.85 0.84
90 10 0.88 0.88 0.87
90 30 0.92 0.93 0.92
120 10 0.97 0.80 0.88
150 10 0.91 0.81 0.86
200 10 0.76 0.92 0.83
IoTBDS 2025 - 10th International Conference on Internet of Things, Big Data and Security
398
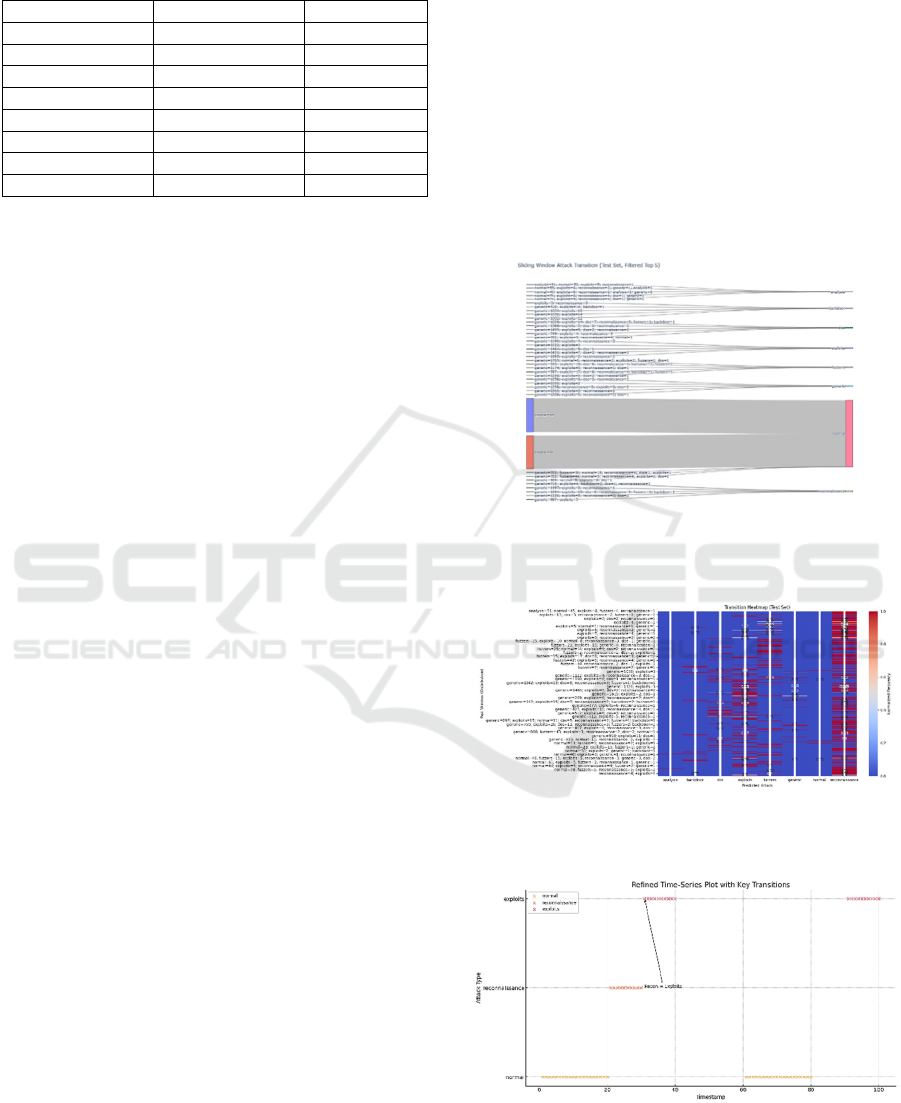
Table 3: Total No. of Records and F-score for each attack
type in the test set of dataset 1.
Records Attack Type Test F-Score
41657 Normal 1.00
1252 Reconnaissance 0.94
3,351 Ex
p
loits 0.95
609 DoS 0.91
33661 Generic 0.94
2637 Fuzzers 0.90
74 Backdoo
r
0.93
73 Analysis 0.81
5.2 Temporal Patterns Analysis
To get more insights on possible attack dependencies,
we used advanced visualization methods like the
Sankey Diagram and Transition Heatmap. Each one
of these diagrams reveals whether the model captured
possible sequences of attacks. Figure 1 shows a
Sankey Diagram that identifies dominant attack
pathways and show high-level trends. It can be seen
that the largest flow originates from normal in the
input sequence and transits to normal in the future
sequence, which indicates that the dataset has a high
proportion of normal traffic. Other flows, such as
from generic or reconnaissance attacks appear to be
less frequent. Some transitions, such as from generic
to backdoor or DoS, appear to be minimal. This
indicates that such sequences are rare or that certain
attacks do not typically follow one another. However,
reconnaissance and generic attacks are primary
precursors to a DoS attack, while a backdoor attack
may result from a sequence comprising generic and
exploit attacks. The diagram illustrates that one of the
most prevalent attack sequences preceding a
backdoor attack consists of 14 exploit attacks and 918
generic attacks. The Transition Heatmap in Figure 2
provides another perspective by showing how the
distribution of past attack events correlates with each
predicted class in a single visual framework. The
colour gradient highlights which patterns of historical
attacks is associated with a given prediction. By
analysing the diagram, we can see combinations of
past activities that frequently lead to specific attack
types. For example, we can notice that the sequences
that contain some fuzzers attacks are most likely to be
followed by another fuzzers attack. These types of
figures give such valuable information to the domain
experts who can use those insights to prevent future
attacks.
We further extended the analysis of the past
sequence to analyse the actual sequence that the
attacks follow within that time sequence and the
predicted attack in the future after this sequence.
Figure 3 shows one of the most common sequences
of attacks ordered by their time of occurrence and the
predicted label for this sequence. In figure 3, normal
activity (yellow) span consistently through the early
(0-20) and later (60-80) time steps. The transition to
a cluster of reconnaissance events (orange) between
time steps 20 and 35 shows the shift to malicious
behaviour. From time step 35 onward, the attack type
emerges as exploits (red), with the arrow labelled
recon ⇒ exploits, which highlights how
reconnaissance flows into active exploitation. Such
figures can be used by domain experts to prevent
subsequent attacks.
Figure 1: Sankey Diagram showing attacks’ distribution in
the input sequence and its corresponding attack label in the
future sequence.
Figure 2: Transition Heatmap showing common attacks’
patterns within the sequence and its predicted future label.
Figure 3: Visualization for example key transitions in data
set 1.
Unravelling the Sequential Patterns of Cyber Attacks: A Temporal Analysis of Attack Dependencies
399

5.3 Model’s Generalization
To test our model’s generalizability, the model was
tested on the rest of destination IP datasets from 2-7.
Table 4 shows the model’s generalization
performance with average of 82% F1-score on the 7
datasets. However, the model performance on smaller
size datasets is lower, compared to larger data sets.
This can be attributed to the limited number of
minority class’s records in these datasets.
Table 4: Model’s performance across all sub-datasets.
Dataset No. Precision Recall Macro F1
2 0.95 0.92 0.93
3 0.86 0.83 0.84
4 0.87 0.83 0.85
5 0.81 0.71 0.74
6 0.81 0.77 0.79
7 0.79 0.72 0.74
8 0.67 0.67 0.67
5.4 Statistical Analysis
To further investigate whether the detected sequence
of attacks are statistically significant, a deeper
statistical analysis was conducted on dataset 1 results.
A Chi-Square test on the entire transition matrix has
been performed. Two of the most common attack
distributions within the 90-second sequence were
picked to see the probability of the predicted attacks
following these sequences. Starting with the sequence
that contains 5 exploits and 3 reconnaissance, the
probability of the predicted attack for this sequence
was assessed for each attack class and the result stated
that the subsequent attack was backdoor which was
recorded 22 times after this sequence with a
probability of 73%, followed by fuzzers which was
recorded 5 times achieving a probability of 17%. The
second sequence tested was a combination of 1226
generic, 14 exploits, 7 dos, 3 reconnaissance, 1
fuzzers, and 1 backdoor and it transitioned to a DoS
attack 30 times with a probability of 100%. This
means that whenever such a combination of attacks is
observed, a complete shift to DoS attacks will occur
in the future. The Chi-square test result with 𝑋
=
111182.34, 𝑝 = 0.000, and degree of freedom of
20440 shows that there are meaningful relationships
among the observed attacks. These results align with
the findings of research by (Sufi, 2024) which state
that there are dependencies between certain attack
types as mentioned in our results, as well as there
were some sequences of attacks that they detected
using a different dataset.
5.5 Comparison with Previously
Published Work
The F1- scores of our model was compared to the
results of other published papers, which used the
same data set. The comparison is based on different
dimensions as shown in Table 5. From this table, it
can be seen that our proposed model achieved the
state-of-the-art F1 score, compared to other
multiclass, time series studies. This is a significant
contribution, given that we worked with unbalanced
data sets. Furthermore, our proposed model is the
only model that captures the relationship and the
sequence of attacks within the time series. This
provides a good base, where security experts can
build on to protect their networks from cyber-attacks.
6 CONCLUSION AND INSIGHTS
FROM THE RESULTS
This paper presents a novel approach for detecting
cyber-attacks and the possibility of consecutive
attacks, utilizing deep learning model for multi-class,
multivariate time-series analysis. The model utilizes
a transformer architecture to capture temporal
relationships while dealing with class imbalances.
The model has achieved state of the art results for
detecting cyber-attacks, in multi-class classification
tasks, and revealing complex relationships between
different attacks, overcoming the shortcomings of the
traditional methods. The model also demonstrated
strong performance in classifying minority attack
types, such as fuzzers and backdoor attacks, even
when they occurred sporadically in the data.
The most important outcome of this paper is that
there are methods that can model, analyse and detect
possible sequences or dependencies between attacks.
However, this might be different from one network
to another, depending on their nature and the type of
traffic and attacks they have. the model’s learned
awareness of diverse attack sequences enables it to
capture transitions between attacks from
reconnaissance or generic to more serious intrusions
like dos or backdoors.
Future research can improve the model's
performance by implementing feature augmentation,
integrating Shapelet learning and discovery
techniques to enhance the interpretability of the
model, and exploring the model's scalability on
different real-life datasets.
IoTBDS 2025 - 10th International Conference on Internet of Things, Big Data and Security
400

Table 5: Performance comparison between the proposed solution and the existing literature on the UNSW-NB15 dataset.
Method Accuracy F-score Classification
T
y
pe
Time
series
Sequences of
attacks detecte
d
Data
b
alance
d
(Kason
g
o & Sun, 2020)
N
/A 69% Multi-class
N
o
N
/A
N
o
(Jouhari et al., 2024)
N
/A 97% Multi-class
N
o
N
/A
N
o
(Al-Obaidi et al., 2023)
N
/A 68.8% Multi-class
N
o
N
/A
N
o
(Talukder et al., 2024)
N
/A 99% Multi-class
N
o
N
/A Yes
(Ps
y
cho
gy
ios et al., 2023).
N
/A 80% Binar
y
Yes
N
o
N
o
(Alsharaiah et al., 2024) 92%
N
/A Binar
y
Yes
N
o
N
o
(Proposed Method) 90% 82% Multi-class Yes Yes No
REFERENCES
Al-Ghuwairi, A., Sharrab, Y., Al-Fraihat, D., AlElaimat,
M., Alsarhan, A., & Algarni, A. (2023). Intrusion
detection in cloud computing based on time series
anomalies utilizing machine learning. Journal of Cloud
Computing Advances Systems and Applications, 12(1).
https://doi.org/10.1186/s13677-023-00491-x
Al-Obaidi, A., Ibrahim, A. A., & Khaleel, A. M. (2023).
The Effectiveness of Deploying Machine Learning
Techniques in Information Security to Detect Nine
Attacks: UNSW-NB15 Dataset as a Case Study.
Mathematical Modelling and Engineering Problems,
10(5). https://doi.org/10.18280/mmep.100507
Alsharaiah, M. A., Abualhaj, M., Baniata, L. H., Al-
Saaidah, A., Kharma, Q. M., & Al-Zyoud, M. M.
(2024). An innovative network intrusion detection
system (NIDS): Hierarchical deep learning model
based on Unsw-Nb15 dataset. International Journal of
Data and Network Science, 8(2), 709–722.
https://doi.org/10.5267/j.ijdns.2024.1.007
Azeroual, H., Belghiti, I. D., & Berbiche, N. (2022).
Analysis of UNSW-NB15 Datasets Using Machine
Learning Algorithms. In Lecture notes in networks and
systems (pp. 199–209). https://doi.org/10.1007/978-3-
031-02447-4_21
Darban, Z. Z., Webb, G. I., Pan, S., Aggarwal, C. C., &
Salehi, M. (2022). Deep Learning for Time Series
Anomaly Detection: A Survey. arXiv (Cornell
University). https://doi.org/10.48550/arxiv.2211.05244
HAI DataSet Baseline Model. (2021, August 2). DACON.
Retrieved December 25, 2024, from https://dacon.io/
competitions/official/235757/codeshare/3009?page=1
&dtype=recent.
Jouhari, M., Benaddi, H., & Ibrahimi, K. (2024). Efficient
intrusion detection: combining X2 feature selection
with CNN-BILSTM on the UNSW-NB15 dataset. 2024
11th International Conference on Wireless Networks
and Mobile Communications (WINCOM), 1–6.
https://doi.org/10.1109/wincom62286.2024.10658099.
Kasongo, S. M., & Sun, Y. (2020). Performance Analysis
of Intrusion Detection Systems Using a Feature
Selection Method on the UNSW-NB15 Dataset.
Journal of Big Data, 7(1). https://doi.org/10.1186/s40
537-020-00379-6
Marir, N., Wang, H., Feng, G., Li, B., & Jia, M. (2018).
Distributed Abnormal Behavior Detection Approach
based on Deep Belief Network and Ensemble SVM
using SPARK. IEEE Access, 6, 59657–59671.
https://doi.org/10.1109/access.2018.2875045
Moustafa, N., & Slay, J. (2015). UNSW-NB15: A
Comprehensive Data Set for Network Intrusion
Detection Systems (UNSW-NB15 Network Data Set).
In 2015 Military Communications and Information
Systems Conference (MilCIS) (pp. 1–6).
https://doi.org/10.1109/milcis.2015.7348942
Psychogyios, K., Bourou, S., Papadakis, A., Nikolaou, N.,
& Zahariadis, T. (2023). Time-Series Modeling for
Intrusion Detection Systems. In Lecture notes in
networks and systems (pp. 1–10). https://doi.org/10.10
07/978-3-031-38333-5_1
Smith, J. (2019). Deep Learning for Time Series
Classification: A review. Journal of Big Data, 6 no.1.
Su, T., Sun, H., Zhu, J., Wang, S., & Li, Y. (2020). BAT:
Deep Learning Methods on Network Intrusion
Detection Using NSL-KDD Dataset. IEEE Access, 8,
29575–29585. https://doi.org/10.1109/access.2020.297
2627
Sufi, F. (2024). A New Time Series Dataset for Cyber-
Threat Correlation, Regression and Neural-Network-
Based Forecasting. Information, 15(4), 199.
https://doi.org/10.3390/info15040199
Talukder, M. A., Islam, M. M., Uddin, M. A., Hasan, K. F.,
Sharmin, S., Alyami, S. A., & Moni, M. A. (2024).
Machine learning-based network intrusion detection for
big and imbalanced data using oversampling, stacking
feature embedding and feature extraction. Journal of
Big Data, 11(1). https://doi.org/10.1186/s40537-024-
00886-w
Unravelling the Sequential Patterns of Cyber Attacks: A Temporal Analysis of Attack Dependencies
401
