
Anomaly Detection Techniques in the Service of Data Labeling for Fault
Diagnosis in Manufaturing
Aldonso Martins de O. Junior
1,2 a
, Emmanuel A. de B. Santos
1 b
, Denis Leite
1,3 c
and Alexandre M. A. Maciel
3 d
1
Universidade de Pernambuco, Brazil
2
Stellantis, Brazil
3
Mekatronik I.C. Automacao Ltda, Brazil
aldonso.junior@stellantis.com, {emmanuel.andrade, alexandre.maciel}@upe.br, denis@mekatronik.com.br
Keywords:
Unsupervised Anomaly Detection, Anomaly Detection Models, Fault Identification, Fault Detection, Labeling
Process.
Abstract:
The lack of labeled fault data in industrial environments presents a major challenge for developing effec-
tive fault detection and diagnosis models. This study investigates the application of unsupervised anomaly
detection techniques to identify abnormal machine behavior without relying on labeled data. By enabling
the early detection of anomalous conditions, these techniques assist in distinguishing normal from faulty in-
stances, supporting the labeling process for improved fault diagnosis. Ten different techniques are evaluated
across multiple performance metrics to determine their effectiveness in industrial fault detection. Experimen-
tal results demonstrate that Angle-Based Outlier Detection (ABOD) outperformed other methods, achieving
a higher F1-score and improved accuracy in recognizing unseen normal data. These findings highlight the
potential of unsupervised learning for enhancing industrial fault detection, facilitating the transition to data-
driven maintenance strategies, and optimizing data collection processes. The study provides valuable insights
into model selection, dataset structuring, and cost-efficient implementation strategies for industrial applica-
tions, contributing to the broader adoption of anomaly detection in manufacturing environments.
1 INTRODUCTION
Industry 4.0 is transforming manufacturing and pro-
cess industries through digital technologies, automa-
tion, and data-driven approaches. This shift enhances
efficiency, flexibility, and intelligence in production,
supply chain, logistics, and maintenance. Key tech-
nologies such as machine learning, AI, and IoT drive
innovation, necessitating the alignment of machinery
and legacy systems with modern standards. To re-
main competitive, industries integrate these advance-
ments to optimize maintenance and improve opera-
tional performance (Ramesh et al., 2020; Dalenogare
et al., 2018; Ahmad and Kamaruddin, 2012; Zonta
et al., 2020; Tsui et al., 2015; Sakib and Wuest, 2018).
A critical challenge in adopting these technologies
for industrial fault detection is the lack of labeled data
a
https://orcid.org/0000-0001-6479-264X
b
https://orcid.org/0000-0002-1786-0934
c
https://orcid.org/0000-0002-0392-3279
d
https://orcid.org/0000-0003-4348-9291
in the early stages of digital transformation. In many
industrial environments, labeled fault data is scarce,
poor in quality, or non-existent, complicating the de-
velopment and training of traditional supervised ma-
chine learning models. This limitation hinders the
widespread adoption of intelligent fault detection sys-
tems, delaying improvements in operational reliabil-
ity and efficiency.
To address this issue, this study explores the use
of unsupervised anomaly detection techniques to dif-
ferentiate normal and anomalous machine behavior
without relying on labeled data. These techniques
enable industrial professionals to assess and classify
anomalies, refining fault detection and diagnosis pro-
cesses. By streamlining the labeling of abnormal con-
ditions, this approach enhances the development of
more accurate and robust fault detection models.
This study evaluates ten anomaly detection tech-
niques to identify the most effective models for in-
dustrial fault detection. Their performance is ana-
lyzed across multiple metrics to provide insights into
real-world applicability. The hypothesis posits that
O. Junior, A. M., Santos, E. A. B., Leite, D. and Maciel, A. M. A.
Anomaly Detection Techniques in the Service of Data Labeling for Fault Diagnosis in Manufaturing.
DOI: 10.5220/0013437100003929
Paper published under CC license (CC BY-NC-ND 4.0)
In Proceedings of the 27th International Conference on Enterprise Information Systems (ICEIS 2025) - Volume 1, pages 921-928
ISBN: 978-989-758-749-8; ISSN: 2184-4992
Proceedings Copyright © 2025 by SCITEPRESS – Science and Technology Publications, Lda.
921

unsupervised techniques can detect faults using only
normal operational data, addressing the challenge of
scarce labeled datasets (Leite et al., 2025). To vali-
date this, a structured experimental approach is imple-
mented, assessing model performance under different
dataset configurations to highlight their strengths and
limitations in industrial applications.
2 MATERIALS AND METHODS
2.1 Data Sources and Collect
Due to the scarcity of real industrial production
datasets (Kang et al., 2020) and the lack of time series
data from Digital Manufacturing Machines (DMMs)
with both digital and analog IO signals (Leite et al.,
2022), simulated data was utilized. This approach,
was validated by Huang et al. (Huang et al., 2022)
for fault detection, and in this study contemplates two
simulators: a pick-and-place system and an electric
furnace (Figure 1). They were selected for their con-
trasting dynamic characteristics, providing distinct
profiles to test anomaly detection techniques in indus-
trial settings.
The simulations were run in Unity 3D, a game en-
gine with graphic and physics simulation capabilities.
The pick-and-place machine simulated motor forces,
friction, and loads, while the electric furnace imple-
mented a dynamic heating model and discrete simu-
lations for door conditions. Each simulated machine
was designed to reflect its operational characteristics
and potential failure conditions.
• Pick and Place Robot: Sequential machine with
linear movement system and short-time cycle.
Simulated forces, friction, and loads.
• Industrial Electric Oven: Thermal threatment sys-
tem, with slow heating and cooling process. Sim-
ulated heat transfer, resistance heating system,
and door conditions.
2.2 Data Detailing and Simulation
The Pick and Place machine simulation consists on
a 3-axis linear positioning system, which operates in
a sequential patten of three positions. Two types of
faults were simulated for each axis: punctual obstruc-
tions (emulating damages like linear guide or fuse
issues) and speed losses (representing motor driver
power loss, maladjustment, or increased friction).
And the corresponding dataset includes 308 normal
cycles operation and 103 cycles with each fault type,
and the simulation includes the following variables
for the Pick and Place system: target position of the
three axes, current position of the three axes (analog
data), forward and backward commands for the 3 axis.
The Furnace machine simulation features an elec-
tric heating system, a temperature sensor, and a door
mechanism. It comprises a thermal threating process
with heating and colling steps. For this simulation,
the following variables are considered: door open sig-
nal, door closed signal, heating turned on, maximum
power applied, temperature. And the corresponding
dataset includes 104 normal cycles and 104 cycles for
each fault condition, amounting to a total of 418 cy-
cles. Simulated faults are power loss at the heater,
thermal noise, and temperature spam error where in-
cluded.
2.3 Methodological Structure
This research employs a methodological framework
designed to assess the effectiveness of anomaly de-
tection techniques in industrial fault detection. The
study is structured into two distinct rounds of exper-
iments, each addressing different aspects of anomaly
detection under varying conditions. This approach is
illustrated through two block diagrams, which offer a
macro perspective of both the experimental setup and
the detailed model development and evaluation pro-
cess.
• 1st Round: utilizes the same data organization as
employed by Leite et al. (2022)[8];
• 2nd Round: introduces a new dataset configura-
tion with a varying sampling rate per cycle.
Figure 2 presents the overall framework of the
study, beginning with the raw dataset and diverging
into two separate pathways for the respective exper-
imental rounds. Round 1 utilizes the dataset organi-
zation proposed by Denis et al. (2022) (Leite et al.,
2022), focusing on a custom mixed discrete and ana-
logical approach. In contrast, Round 2 delves into
a novel dataset configuration with varied sampling
number per cycle [10, 25, 50, 100, 200, 350, 400,
500, and 900]. This bifurcation allows for a multi-
faceted exploration of anomaly detection. Both paths
converge at the critical model development and eval-
uation process.
Ten different anomaly detection techniques were
selected to be exploited as lited in Table 1).
The dataset was divided into normal only dataset
and faulty dataset (to emulate the reality were the
data collection just started in a industry). The nor-
mal only dataset is then split in a 70-30 rate, creating
the train/test dataset, and the evaluation dataset (here
called unseen dataset). The train/test pass through 30
ICEIS 2025 - 27th International Conference on Enterprise Information Systems
922
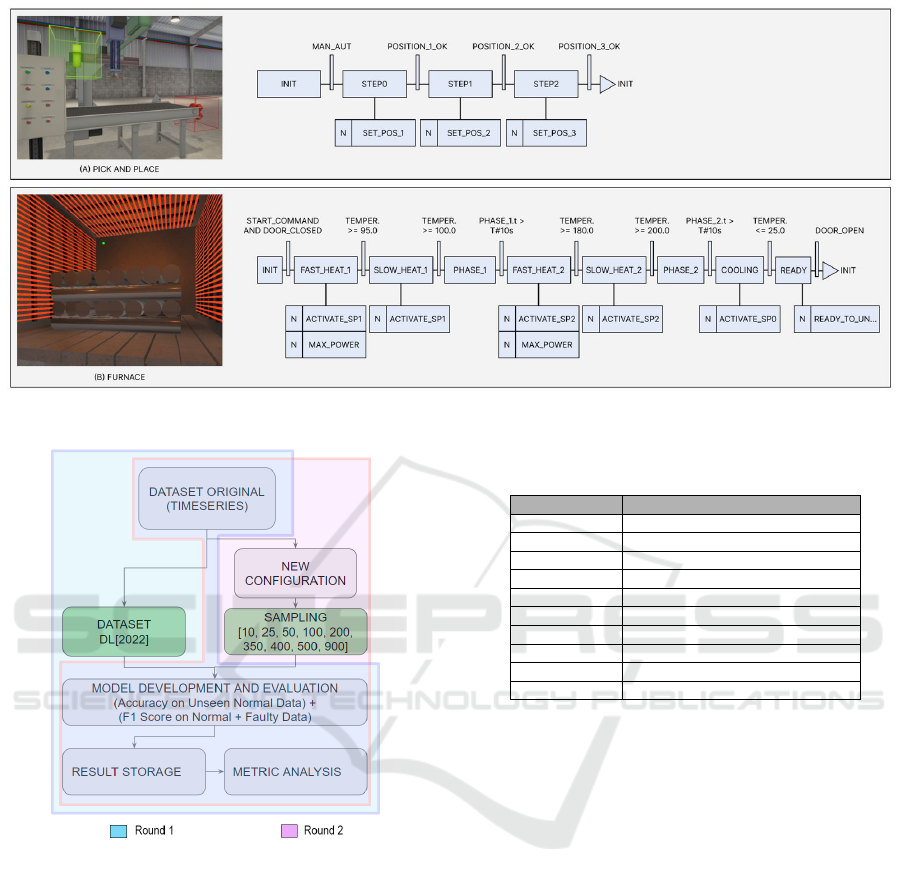
Figure 1: Furnace and Pick and Place Machines Cycle Detailed from Leite et al. (2022) (Leite et al., 2022).
Figure 2: Experimental Setup on Block Diagram with each
round conducted.
executions of a new split of 70-30 rate. This time the
70% portion is used to train each unsupervised learn-
ing method (Table 1) and the model is used to evaluate
it’s Accuracy, Recall and F1 Scoring against the test,
evaluation (unseen), faulty only and full datasets. All
results are recorded for a complete evaluation of the
experiments.
The PyCaret low-code library (Ali, 2020) played
a central role in the pre-processing and model devel-
opment process, significantly streamlining key tasks
such as feature scaling, train/test split management,
outlier removal, and feature selection. Incorporat-
ing Sklearn classifiers (Buitinck et al., 2013), Py-
Caret also facilitated the tuning and optimization of
anomaly detection models to achieve the best possi-
Table 1: All techniques used on Anomaly Detection Model
Creation.
Abbreviation Description
ABOD Angle-base Outlier Detection
CLUSTER Clustering-Based Local Outlier
COF Connectivity-Based Local Outlier
IFOREST Isolation Forest
HISTOGRAM Histogram-based Outlier Detection
KNN K-Nearest Neighbors Detector
LOF Local Outlier Factor
SVM One-class SVM Detector
PCA Principal Component Analysis
MCD Minimum Covariance Determinant
ble performance. The anomaly detection techniques
used in this study, listed in Table 1, were selected
based on literature reviews (Albuquerque Filho et al.,
2022). To ensure robustness, each technique was used
to generate 30 model variations with different random
states, mitigating biases from initialization and data
splits. Model evaluation followed a two-step process:
an initial assessment on test and unseen normal data to
measure accuracy in recognizing normal operations,
followed by testing on faulty data, where the F1 score
served as the primary metric due to the dataset’s un-
balanced nature.
As described, the models are trained exclusively
with normal data and evaluated on both normal, faulty
data and complete Dataset.
2.4 Dataset Preparation and
Experimental Details
Round 1 dataset preparation process followed Leite
et al. (2022). This approach, aims to capture the
machine behavior in a specific manner, requiring hu-
man contribution only in automation and maintenance
Anomaly Detection Techniques in the Service of Data Labeling for Fault Diagnosis in Manufaturing
923
domains, and no human contribution in the machine
learning domain.
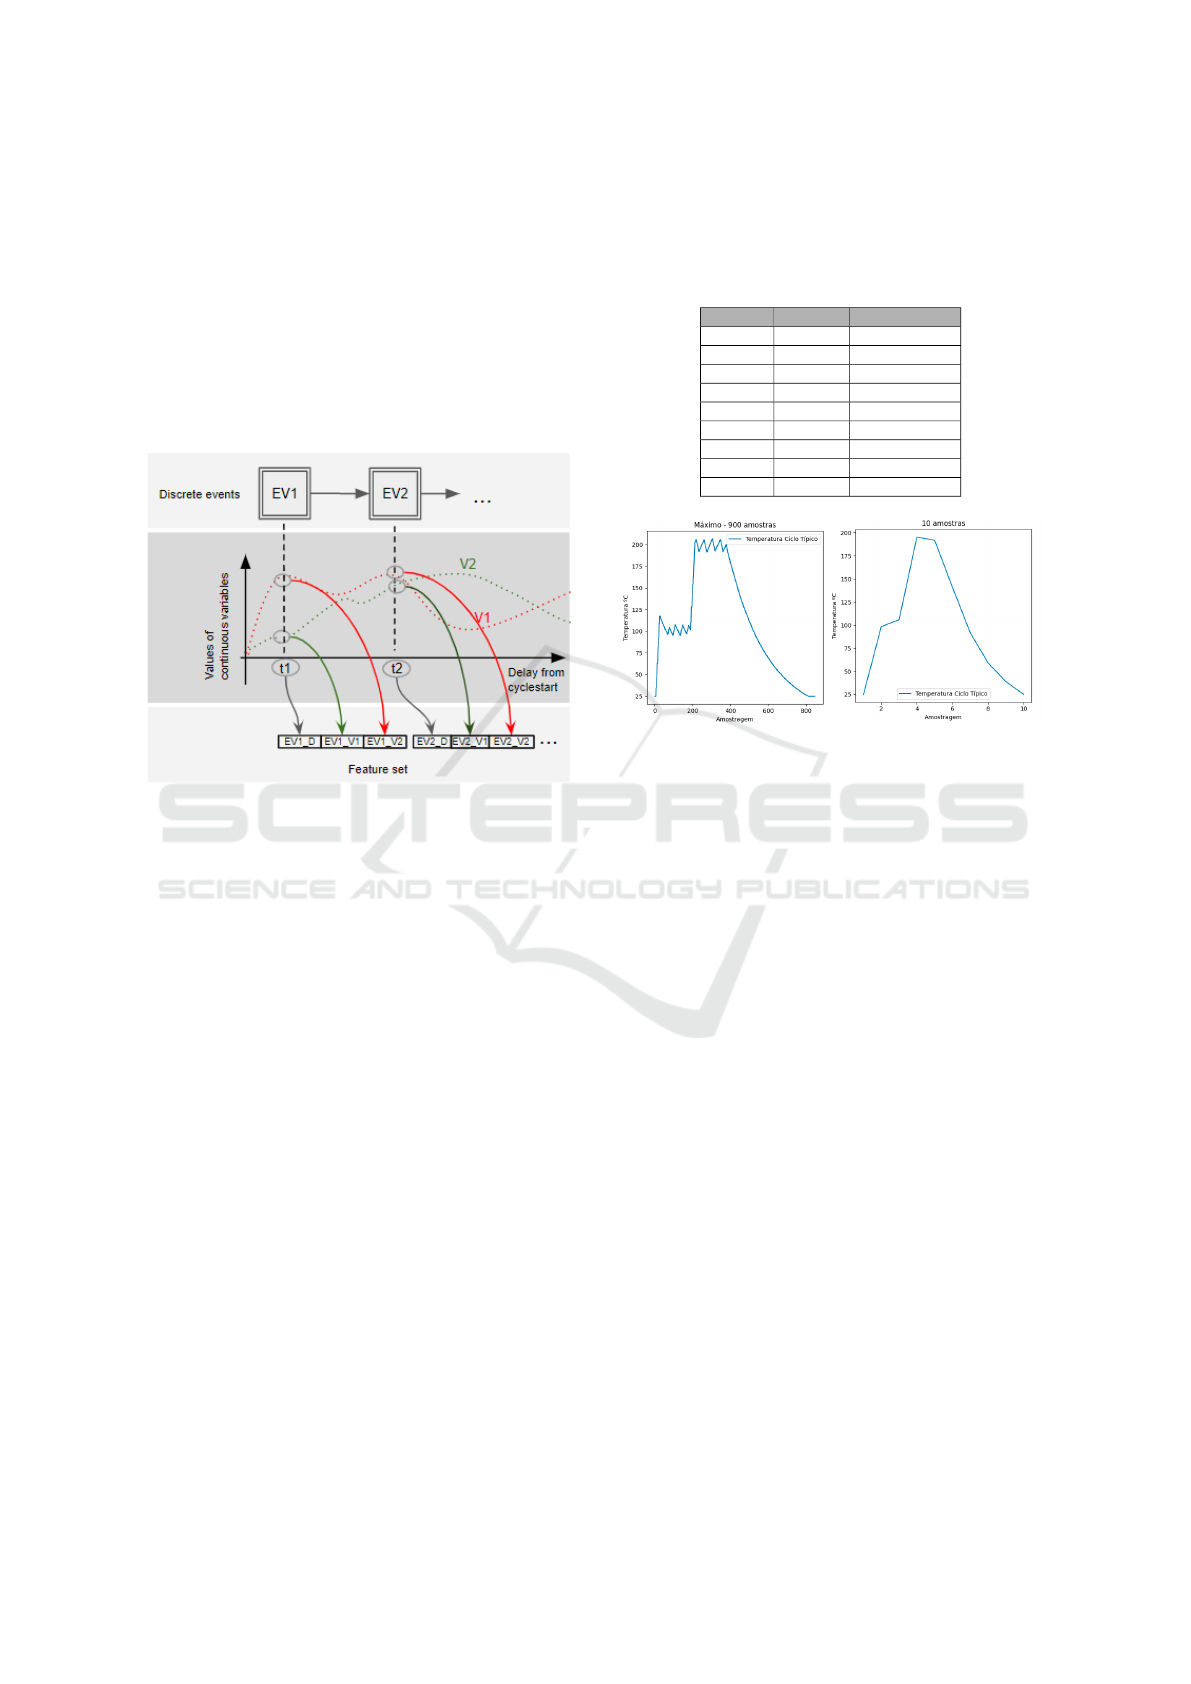
The outcome is a feature set that amalgamates
these discrete events with continuous variables, as
ilustrated in Figure 3, where each instance in the
dataset represents one machine cycle, filled with
timed delays of discrete events and the corresponding
values of continuous variables. This structure allows
for the detection of anomalies such as events occur-
ring out of order, delayed, or early, and issues with
calibration, utilities, or machine components:
Figure 3: Feature set preparation process combining dis-
crete events and continuous variables.
Round 2 embarked on a more abroad exploration
of anomaly detection capabilities by employing a dis-
tinct approach to data organization compared. While
both rounds focus on datasets that are cycle-oriented,
with each instance representing an entire machine
cycle, the key difference in Round 2 lies in a new
method of feature dataset definition. In this round, the
raw time-series data were restructured to capture sam-
ples of each variable at a fixed interval within each
cycle. This methodology requires less pre-processing
effort. However, depending on the number of samples
per cycle, it may incur a higher computational cost
and higher dimensionality, for the anomaly detection
models.
The expectation behind this schema was that a
more detailed data granularity would enable a more
accurate characterization of the machine’s behavior,
potentially leading to improved anomaly detection re-
sults compared to Round 1. To test this hypothesis,
the study examined how different number of samples
per cycle, representing a variety of operational scenar-
ios, would affect the performance of anomaly detec-
tion models. This involved creating various versions
of the dataset with different sampling intervals. Fig-
ure 4 shows an example of how the main variables
from the Furnace machine would look at different us-
ing 2 sampling rates.
Table 2: Different sample sizes for both experiments on
Round 2.
samples Furnace PickandPlace
10 X X
25 X X
50 X X
100 X X
200 X X
350 X
400 X
500 X
900 X
Figure 4: Illustration of feature temperature in Furnace with
2 differents sample sizes.
3 RESULTS
As outlined in the Materials and Methods section,
Round 1 involved applying 30 models across 10 se-
lected techniques for each simulated machine, total-
ing 600 experiments. In Round 2, 8 sampling vari-
ants were tested for the Furnace and 6 for the Pick-
and-Place machine, as detailed in Table 2, resulting
in 2400 models for the Furnace and 1800 for the
Pick-and-Place, bringing the total number of evalu-
ated Anomaly Detection (AD) models to 4800. This
section presents and discusses the results of both ex-
perimental rounds, as illustrated in Figure 2, focusing
on accuracy for unseen normal data and the F1 score
on the complete dataset (faulty + normal cases).
3.1 Round 1 - Analysis
The Figure 2 highlight the round 1 experiment from
which results are going to be discussed on this sec-
tion. The methodologies and evaluation metrics were
consistent with previous descriptions and methodol-
ogy.
The accuracy assessment on unseen normal (eval-
uation) data revealed commendable performance
across the anomaly detection techniques (see Figure
5 for details). When predicting both faulty and nor-
ICEIS 2025 - 27th International Conference on Enterprise Information Systems
924
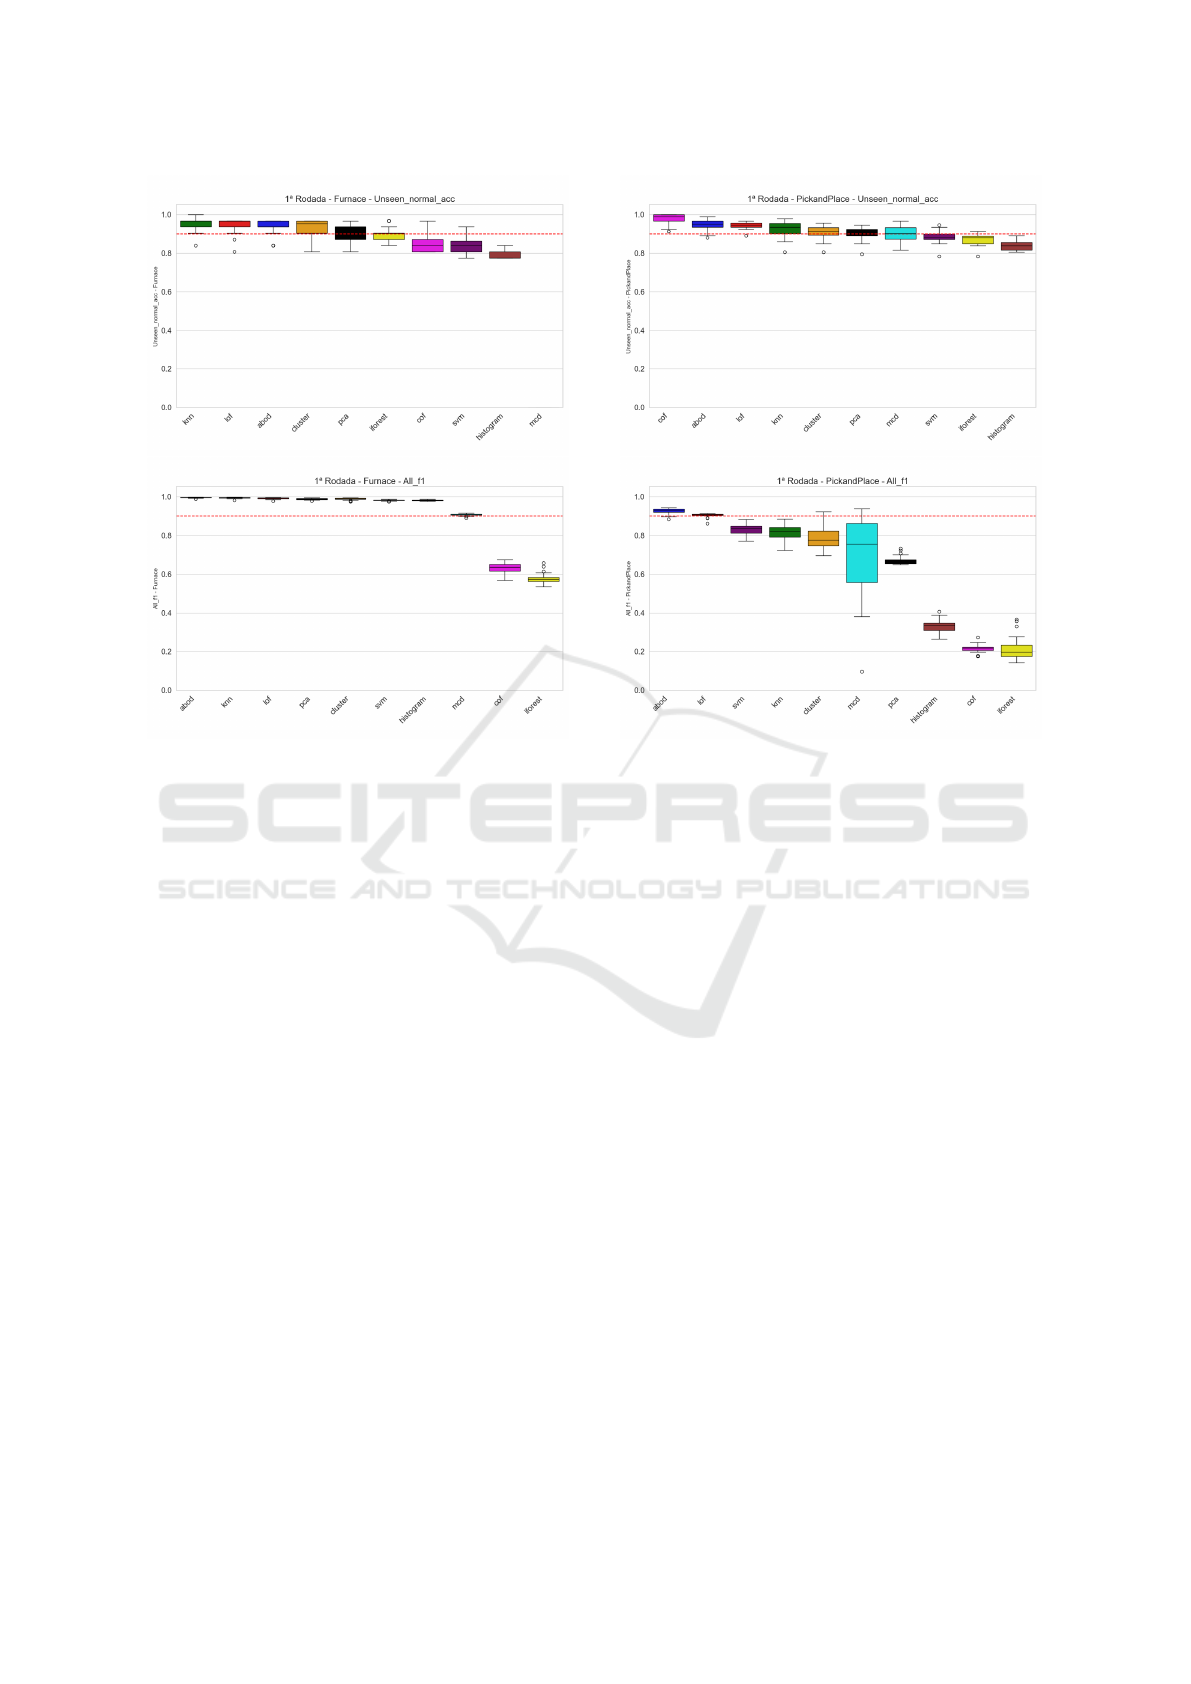
Figure 5: Results Accuracy on Unseen Normal Data + F1
Score on All Data - Furnace.
mal (all data set), the F1 score provided insights into
the overall effectiveness of the models. All of them
demonstrated robust performance (above 0.9 of F1)
except for COF and IFOREST which exhibited vary-
ing levels of effectiveness (see Figure 5 for details)
below 0.7.
The qualitative comparison emphasized the strong
performance of ABOD, KNN, LOF, PCA, CLUS-
TER, SVM, and histogram in terms of accuracy on
unseen normal data and F1 score on faulty plus nor-
mal data, demonstrating a high ability to distinguish
between normal and faulty conditions.
The same methodologies were applied to evalu-
ate anomaly detection techniques by extending the in-
vestigation to the pick-and-place machine. The accu-
racy of unseen normal data revealed distinct patterns
of performance for the pick-and-place machine.
When predicting both faulty and normal data,
ABOD, LOF, and SVM consistently outperformed
other techniques, effectively distinguishing between
normal and faulty conditions, whereas Histogram,
COF, and IFOREST exhibited lower effectiveness
(see Figure 6). Although COF achieved high accuracy
on unseen normal data for the Pick-and-Place ma-
chine, it failed to generalize for fault detection, show-
ing a significant drop in F1 score when faulty data was
introduced. In contrast, ABOD maintained strong
Figure 6: Results Accuracy on Unseen Normal Data + F1
Score on All Data - Pick and Place.
performance across both normal accuracy and F1
score, reinforcing its reliability. MCD exhibited un-
stable results, with noticeable variations in F1 scores,
while Histogram, COF, and IFOREST struggled with
fault identification. A holistic comparison between
the Furnace and Pick-and-Place experiments reveals
distinct patterns in anomaly detection performance,
with ABOD emerging as the most consistently effec-
tive technique across both systems, demonstrating its
versatility in different industrial contexts.
3.2 Round 2 Analysis
As a similar approach (but more diverse), the Figure 2
highlights the round 2 experiments and the it’s results
to be discussed on this section.
The experiments on the Furnace machine pro-
vided intriguing insights into the performance of
anomaly detection techniques across different sam-
ple sizes as show in Figure 7. Notably, as the sam-
ple size increased, there was a general trend of im-
provement in both Unseen Normal Accuracy and All
F1 Score. ABOD consistently secured a place in the
top four performers for Unseen Normal Accuracy in
seven out of eight experiments (see Table 5), show-
casing robustness across diverse sample sizes.
Anomaly Detection Techniques in the Service of Data Labeling for Fault Diagnosis in Manufaturing
925
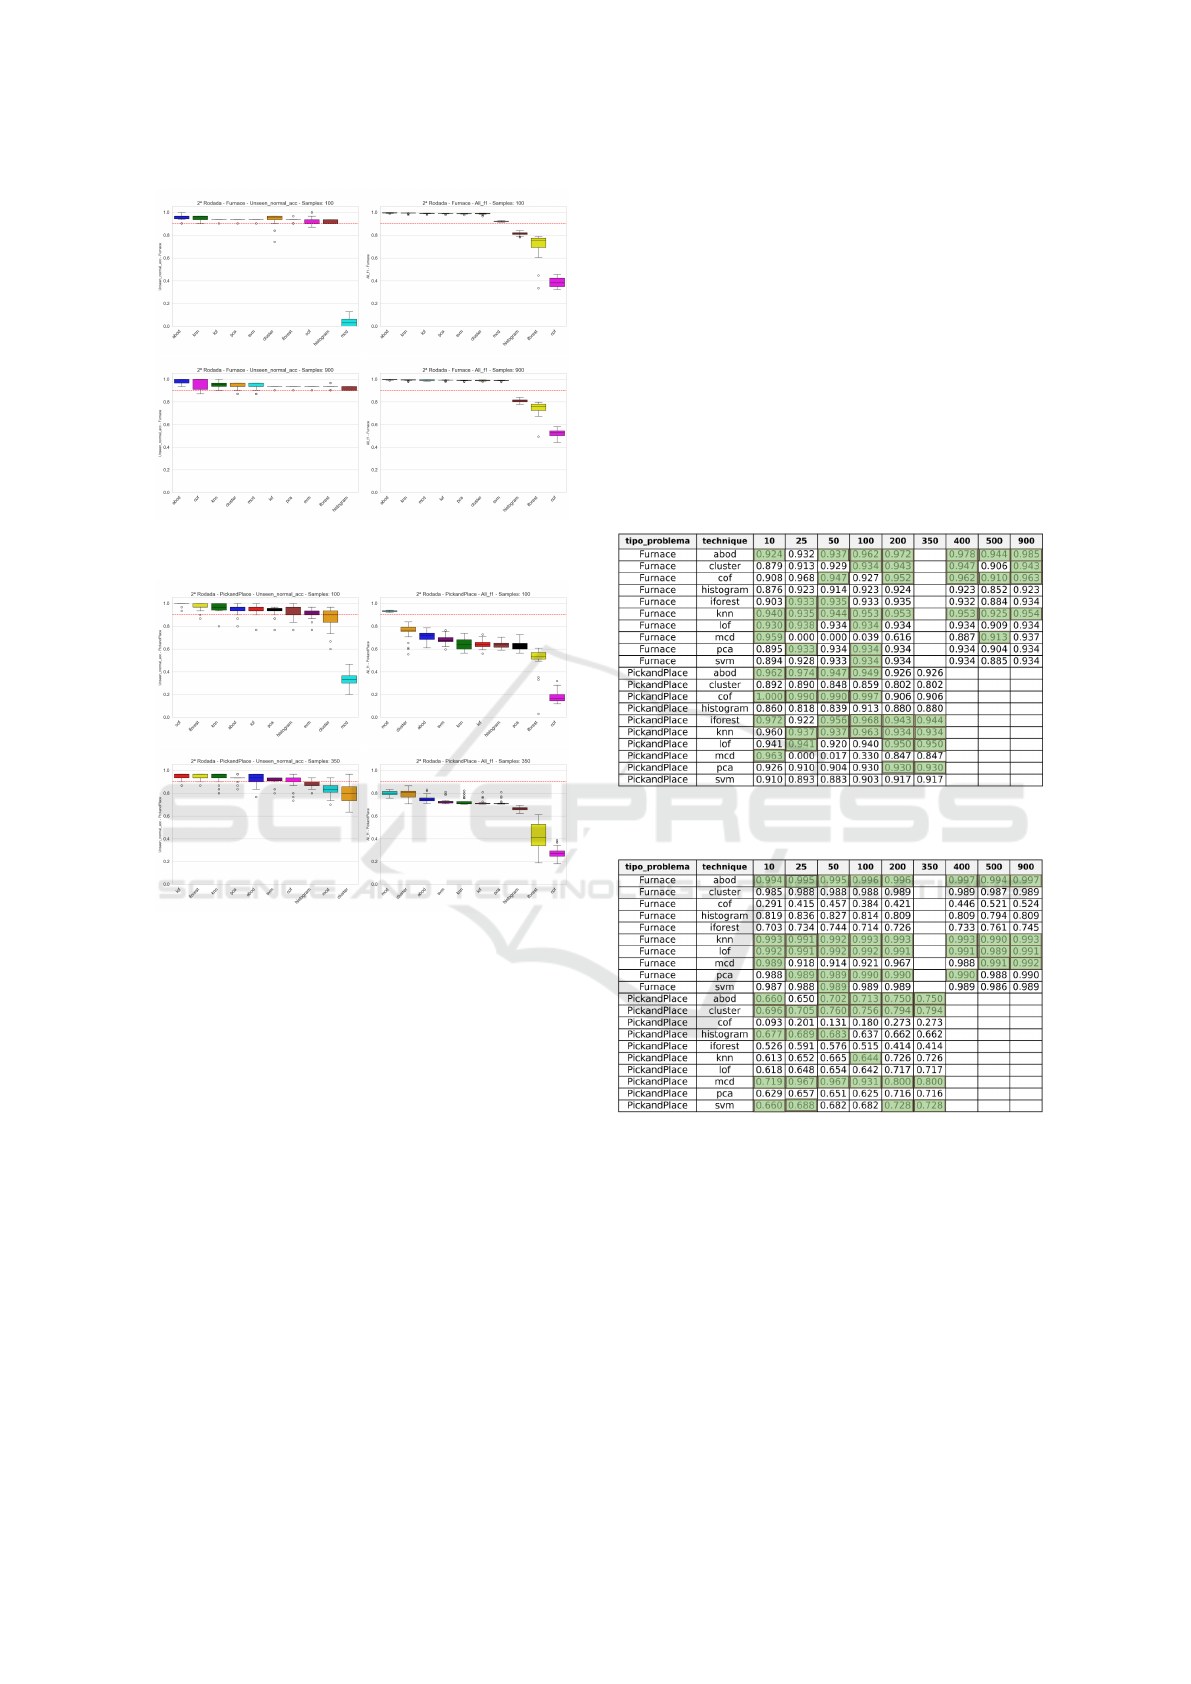
Figure 7: Results for Furnace on different samples [100 and
900 columns].
Figure 8: Results for Pick and Place on different samples
[100 and 350 columns].
KNN and LOF also demonstrated notable con-
sistency and effectiveness in Furnace experiments,
maintaining high rankings across different sample
sizes. This reliability suggests that these techniques
might exhibit consistent performance in fault detec-
tion within the context of the Furnace machine.
Similar to the Furnace experiments, the Pick and
Place machine experiments displayed variations in
technique performance (Figure 8 with different sam-
ple sizes. ABOD, again, stood out by securing a place
in the top four for Unseen Normal Accuracy in four
out of six experiments (see Table 5), defying the antic-
ipated variability based on sample size. This consis-
tent performance underscores ABOD’s potential ap-
plicability in diverse industrial scenarios.
3.2.1 Round 2: Cross-Machine Comparison
The analysis of results from Round 2 experiments
across both the Furnace and Pick and Place machines,
as show in Tables 3 and 4 (in green are the best for
each group), has highlighted the remarkable and con-
sistent performance of ABOD. This is particularly
striking in the Furnace experiments, where ABOD’s
effectiveness was notably pronounced. Such findings
gain prominence considering ABOD’s absence in re-
cent literature reviews on anomaly detection in indus-
trial settings (Albuquerque Filho et al., 2022). This
oversight in the literature emphasizes the novelty of
our results, suggesting that ABOD may have unique
and previously unexplored capabilities for anomaly
detection in certain industrial environments.
Table 3: Results for Unseen Normal Accuracy (samples x
techniques x machines).
Table 4: Results for All Data F1 Score (samples x tech-
niques x machines).
Increasing the number of samples improved
model performance, but without significant changes,
suggesting that data collection does not need to oc-
cur every 50 ms (the maximum for certain OPC UA
hardware). A longer sampling interval can be used
without major impacts on results, reducing techno-
logical costs and investments in data acquisition soft-
ware. The consistent performance of ABOD, along
with the reliability of KNN and LOF in the Furnace
machine, highlights the complexity of anomaly detec-
tion effectiveness and the need for further exploration.
These findings, rarely addressed in recent literature,
provide valuable insights into fault detection method-
ologies in industrial settings. Notably, IFOREST and
ICEIS 2025 - 27th International Conference on Enterprise Information Systems
926

COF performed poorly for both machines when ex-
posed to faulty data, reinforcing their limitations in
handling abnormal conditions.
Table 5: Summary of the number of times each technique
was in the top 4 for each machine regarding sample sizes
experiments.
4 DISCUSSION
The presented research embarked on a wide explo-
ration of anomaly detection techniques in the context
of fault detection for industrial machinery. Through
two rounds of investigation, the study examined dif-
ferent techniques across varying sample sizes and
two distinct machines: the Furnace and the Pick and
Place.
In both experimental rounds, models were initially
evaluated using only normal data, reflecting the typi-
cal scenario of a new industry implementing Indus-
try 4.0 capabilities. This allowed for selecting the
most suitable model before assessing its performance
in detecting real faults emulated through full dataset
exposure. The first round demonstrated the effec-
tiveness of various anomaly detection techniques in
identifying faults in the Furnace and Pick-and-Place
machines. ABOD consistently achieved high Unseen
Normal Accuracy across different sample sizes, chal-
lenging the assumption that technique effectiveness is
highly dependent on sample size. Additionally, KNN
and LOF proved to be reliable performers in the Fur-
nace machine, reinforcing their potential for robust
fault detection.
The second round further explored the impact of
sample size on anomaly detection. ABOD contin-
ued to deliver stable results across both machines, re-
inforcing its versatility and questioning conventional
assumptions about sample size reliability. A key fac-
tor in ABOD’s success is its reduced susceptibility to
the curse of dimensionality, as noted by Kriegel et al.
(Kriegel et al., 2008). By analyzing the variance of
angles between data vectors, ABOD effectively iden-
tifies outliers, making it a promising candidate for
industrial fault detection. This distinctive approach
warrants further investigation, potentially paving the
way for advancements in anomaly detection method-
ologies.
This study opens avenues for future investigations,
encouraging researchers and practitioners to explore
anomaly detection techniques beyond conventional
expectations, particularly in scenarios with varying
sample sizes. Additionally, it highlights the intricate
relationship between sample sizes, machine types,
and anomaly detection methods (as shown in Tables
3 and 4). These findings emphasize the need for a nu-
anced approach where technique selection is guided
by established practices and empirical observations
tailored to the specific industrial context. Naturally,
despite efforts to model and incorporate real-world
randomness, studies based on simulated data have in-
herent limitations. Therefore, future work should ex-
plore these techniques using real-world data to further
validate and refine the findings.
Furthermore, no comparison with other studies
was performed due to the scarcity of benchmark
datasets from industrial manufacturing machines,
which a key challenges on establishing the state of
the art in this fault diagnosis field(Leite et al., 2025),
Therefore, new studies may benefit from investigat-
ing new techniques over the same dataset used in this
study by contacting the authors.
5 CONCLUSIONS
The outcomes of this study significantly address the
predicament of limited labeled data in the discrete
manufacturing industry. By exploring ten differ-
ent anomaly detection techniques, trained exclusively
with normal data, we have quantified their effective-
ness in distinguishing normal from faulty conditions.
The results show that the Angle-Based Outlier Detec-
tion (ABOD) technique achieved an average increase
in F1-score compared to other methods, demonstrat-
ing its suitability for real-world applications in fault
detection.
One of the most prominent findings is the ef-
fectiveness of ABOD in handling manufacturing
data, where it consistently outperformed other mod-
els. This insight is particularly valuable for re-
searchers and professionals seeking robust and scal-
able anomaly detection methods for industrial ma-
chinery.
The comparative analysis between the two dataset
configurations led to a surprising conclusion: the less
detailed approach from previous work proved more
effective in fault detection than the more comprehen-
sive setup. This finding highlights that the quality and
relevance of data are often more critical than sheer
Anomaly Detection Techniques in the Service of Data Labeling for Fault Diagnosis in Manufaturing
927

quantity when constructing training sets for anomaly
detection models.
Ultimately, this research contributes insights to
the field of fault detection in industrial systems, chal-
lenging conventional notions and paving the way
for more nuanced and effective anomaly detection
methodologies. The findings encourage a shift to-
ward a more adaptive and context-aware approach in
implementing anomaly detection techniques for di-
verse industrial applications. These insights provide
a strong foundation for future studies aimed at refin-
ing anomaly detection strategies and validating them
in real-world manufacturing settings.
ACKNOWLEDGEMENTS
The authors would like to thank the research team
GPCDA (Grupo de Pesquisa em Ci
ˆ
encia de Dados e
Analytics) at PPGEC-UPE for all the invaluable con-
tributions to the discussions and for their support. We
need also to thank the huge contribution of Meka-
tronik’s Team for sharing the simulation data and for
the opportunity to work on methodology and exper-
iment execution. And to thank Stellantis Goiana for
all the support and incentive. Gratitude is extended to
CAPES and CNPq for their financial support, without
which this work would not have been possible.
This paper was financed in part by the
Coordenac¸
˜
ao de Aperfeic¸oamento de Pessoal de
N
´
ıvel Superior - Brazil (CAPES) - Finance Code
001, Fundac¸
˜
ao de Amparo a Ci
ˆ
encia e Tecnologia do
Estado de Pernambuco (FACEPE), the Conselho Na-
cional de Desenvolvimento Cient
´
ıfico e Tecnol
´
ogico
(CNPq) - Brazilian research agencies.
REFERENCES
Ahmad, R. and Kamaruddin, S. (2012). An overview of
time-based and condition-based maintenance in in-
dustrial application. Computers &industrial engineer-
ing.
Albuquerque Filho, J. E. D., Brand
˜
ao, L. C. P., Fernandes,
B. J. T., and Maciel, A. M. A. (2022). A review of
neural networks for anomaly detection. IEEE Access,
10:112342–112367.
Ali, M. (2020). PyCaret: An open source, low-code ma-
chine learning library in Python. PyCaret version 2.3.
Buitinck, L., Louppe, G., Blondel, M., Pedregosa, F.,
Mueller, A., Grisel, O., Niculae, V., Prettenhofer, P.,
Gramfort, A., Grobler, J., Layton, R., VanderPlas, J.,
Joly, A., Holt, B., and Varoquaux, G. (2013). API de-
sign for machine learning software: experiences from
the scikit-learn project. In ECML PKDD Workshop:
Languages for Data Mining and Machine Learning,
pages 108–122.
Dalenogare, L., Benitez, G., Ayala, N., and ... (2018). The
expected contribution of industry 4.0 technologies for
industrial performance. International Journal of . . . .
Huang, J., Wen, J., Yoon, H., Pradhan, O., Wu, T., and
Neill, Z. O. (2022). Energy & Buildings Real vs
. simulated : Questions on the capability of simu-
lated datasets on building fault detection for energy
efficiency from a data-driven perspective. Energy &
Buildings, 259:111872.
Kang, Z., Catal, C., and Tekinerdogan, B. (2020). Machine
learning applications in production lines : A system-
atic literature review. Computers & Industrial Engi-
neering, 149(August):106773.
Kriegel, H., Schubert, M., and Zimek, A. (2008). Angle-
based outlier detection in high-dimensional data. Pro-
ceedings of the 14th ACM . . . .
Leite, D., Andrade, E., Rativa, D., and Maciel, A. M.
(2025). Fault Detection and Diagnosis in Industry 4.0:
A Review on Challenges and Opportunities. Sensors,
25(1):1–34.
Leite, D., Martins, A. J., Rativa, D., Oliveira, J. D., and
Maciel, A. (2022). An automated machine learning
approach for real-time fault detection and diagnosis.
Sensors.
Ramesh, P., Dutta, S., Neog, S., Baishya, P., and ... (2020).
Implementation of predictive maintenance systems in
remotely located process plants under industry 4.0
scenario. . . . Engineering: In Honor of . . . .
Sakib, N. and Wuest, T. (2018). Challenges and opportuni-
ties of condition-based predictive maintenance: a re-
view. Procedia cirp.
Tsui, K., Chen, N., Zhou, Q., Hai, Y., and Wang, W. (2015).
Prognostics and health management: A review on data
driven approaches. Mathematical Problems in . . . .
Zonta, T., Costa, C. D., da Rosa Righi, R., and ... (2020).
Predictive maintenance in the industry 4.0: A system-
atic literature review. Computers &Industrial . . . .
ICEIS 2025 - 27th International Conference on Enterprise Information Systems
928
