
Integrating Satellite Images Segmentation and Electrical Infrastructure
Data to Identify Possible Urban Irregularities in Power Grid
´
Alisson Alves
1,2 a
, Lu
´
ısa Souza
1,2 b
, Luiz Cho-Luck
1 c
, Raniere Lima
1 d
, Carlos Augusto
1 e
,
Wesley Marinho
1,2 f
, Rafael Capuano
1 g
, Bruno Costa
1 h
, Marina Siqueira
1 i
, Jesa
´
ıas Silva
1 j
,
Raul Paradeda
3 k
and Pablo Javier Alsina
2 l
1
SENAI Institute of Innovation in Renewable Energy, Capit
˜
ao-Mor Gouveia Avenue, Natal-RN, Brazil
2
Graduate Program in Electrical and Computer Engineering, Federal University of Rio Grande do Norte, Natal-RN, Brazil
3
Department of Computer Science, State University of Rio Grande do Norte, Dr. Jo
˜
ao Medeiros Filho Avenue, Natal-RN,
Brazil
Keywords:
Electrical Infrastructure, Semantic Segmentation, Deep Learning, Remote Sensing, Geospatial Analysis,
Land Use Classification, Infrastructure Mapping.
Abstract:
Managing urban expansion and its impact on electrical infrastructure presents significant challenges, necessi-
tating innovative methodologies to address irregular settlements and commercial losses in the electricity sector.
This paper proposes an approach integrating convolutional neural networks and geospatial data to detect ur-
ban areas lacking electrical infrastructure. High-resolution Google Earth images and low-resolution Landsat
8 data were processed using advanced semantic segmentation architectures, LinkNetB7 and D-LinkNet50, to
analyze land use patterns. The segmentation outputs were combined with data from the Brazilian Geographic
Database of the Distribution System to generate comprehensive maps of electrical infrastructure coverage.
The study focused on the SBAU substation in Sabar
´
a, Minas Gerais, which demonstrated commercial losses
of up to 47.5% in specific feeders. Results demonstrated the effectiveness of deep learning models in identi-
fying mismatches between urban development and infrastructure coverage, highlighting areas with potential
irregular connections. This study contributes to advancing artificial intelligence applications in urban energy
management by providing a scalable framework for analyzing land use and electrical infrastructure.
1 INTRODUCTION
In Brazil, electricity consumption increased by 12.6%
between 2014 and 2023, reaching an all-time high of
616.3 TWh in 2023, according to the Brazilian En-
ergy Research Company (EPE, 2024). The indus-
trial (36.4%) and residential (27.5%) sectors domi-
a
https://orcid.org/0000-0002-7999-8189
b
https://orcid.org/0000-0002-3707-2097
c
https://orcid.org/0009-0003-7053-0453
d
https://orcid.org/0009-0006-2677-2983
e
https://orcid.org/0009-0000-7708-348X
f
https://orcid.org/0009-0009-7101-1632
g
https://orcid.org/0009-0004-9627-8177
h
https://orcid.org/0009-0003-7980-7332
i
https://orcid.org/0009-0005-2446-8753
j
https://orcid.org/0000-0002-6586-8340
k
https://orcid.org/0000-0002-4031-6275
l
https://orcid.org/0000-0002-2882-5237
nate the country’s energy consumption profile, par-
ticularly in the Southeast, which accounts for nearly
half of the national demand (EPE, 2024; Flores et al.,
2023). This rising demand underscores the impor-
tance of efficient infrastructure planning in densely
populated regions. Additionally, sectors such as live-
stock, though accounting for only 5% of total elec-
tricity consumption, significantly influence land use
and land cover changes (LULC) (Flores et al., 2023,
p. 22).
Understanding LULC changes is critical for ad-
dressing the impacts of urbanization on electrical in-
frastructure. Advances in remote sensing and deep
learning have proven instrumental in this domain, par-
ticularly in the segmentation of satellite images to
map urban and peri-urban areas (Archana and Jee-
varaj, 2024; Abujayyab et al., 2023). Convolutional
neural network (CNN) architectures excel at process-
ing multi-resolution geospatial data, enabling the de-
tection of urban patterns with high precision, even
Alves, Á., Souza, L., Cho-Luck, L., Lima, R., Augusto, C., Marinho, W., Capuano, R., Costa, B., Siqueira, M., Silva, J., Paradeda, R. and Alsina, P. J.
Integrating Satellite Images Segmentation and Electr ical Infrastructure Data to Identify Possible Urban Irregularities in Power Grid.
DOI: 10.5220/0013437500003929
In Proceedings of the 27th International Conference on Enterprise Information Systems (ICEIS 2025) - Volume 1, pages 929-936
ISBN: 978-989-758-749-8; ISSN: 2184-4992
Copyright © 2025 by Paper published under CC license (CC BY-NC-ND 4.0)
929

under challenging conditions of spatial and temporal
variation (Atas¸, 2023).
This study builds on these advances by integrat-
ing remote sensing data with georeferenced elec-
trical infrastructure datasets, specifically the Brazil-
ian Geographic Database of the Distribution Sys-
tem (BGDDS). By leveraging high-resolution Google
Earth imagery and low-resolution Landsat 8 data,
combined with advanced CNN-based segmentation
architectures, this work identifies discrepancies be-
tween urban land use and electrical infrastructure cov-
erage. These insights aim to support urban energy
planning and mitigate commercial losses in Brazil’s
electricity sector.
2 RELATED WORKS
This section presents the main related works that uti-
lize machine learning and deep learning approaches
to evaluate land use and land cover in urban contexts,
highlighting their advances, challenges, and contri-
butions in processing and analyzing remote sensing
data.
Khan and Sudheer (2022) applied a combination
of Artificial Neural Networks and Cellular Automata
(ANN-CA) to model urban growth in Islamabad, Pak-
istan, and project future land use changes. The study
utilized Landsat image data from 1991 to 2021 to as-
sess the increase in urbanized areas and predict their
future expansion by 2041. The approach highlighted
the unplanned growth of the city, emphasizing the
importance of policy interventions to mitigate nega-
tive environmental impacts, such as the loss of green
spaces.
The extraction of LULC class features was also
addressed by Rani et al. (2024), who utilized the U-
Net model to perform semantic segmentation of satel-
lite images. The study demonstrated the effectiveness
of U-Net for extracting features of buildings, vegeta-
tion, and water bodies from high-resolution images,
achieving an F1 score of 92%. The application of
this automated technique enables rapid classification
of large datasets, reducing the need for human inter-
vention and enhancing the efficiency of land use anal-
ysis.
The study by He et al. (2024) focused on the de-
tailed classification of urban buildings using a deep
neural network for low-resolution satellite images.
The research proposed UB-FineNet, a model that
addresses the class imbalance problem by applying
high-resolution techniques and contrastive learning.
This approach provides a robust solution for fine-
grained building classification in large urban areas,
supporting urban planning and resource management.
Ullah et al. (2024) investigated the impact of land
use changes on land surface temperature (LST) in
Kabul, Afghanistan. Using a combination of sup-
port vector machines (SVM) and cellular automata
with logistic regression (CA-LR), the study demon-
strated a direct correlation between urbanization and
rising air temperatures. Projections for 2046 indi-
cate an increase in urbanized areas and, consequently,
higher surface temperatures, highlighting the adverse
effects of unplanned urban expansion on the local at-
mosphere.
Although numerous studies apply machine learn-
ing techniques for LULC prediction, urban detection,
and environmental impact analysis, little research ex-
plores the relationship between unplanned urban de-
velopment and its impact on electrical infrastructure.
Issues such as illegal connections and irregular set-
tlements, exacerbated by deeply rooted cultural prac-
tices, compromise the efficiency, safety, and planning
of the electrical system. In this context, the use of
machine learning to identify urbanized areas, analyze
energy demands and predict potential anomalies in
consumption within these regions can offer valuable
solutions for sustainable urban planning.
3 METHODOLOGY
The methodology employs deep learning techniques
to analyze urban growth through satellite image seg-
mentation, identifying land use and land cover areas.
The process involved acquiring and preprocessing im-
ages and binary masks, training segmentation algo-
rithms with labeled data, and analyzing urban density
based on the BGDDS. Additionally, an energy bal-
ance framework was used to evaluate non-technical
losses (NTL) by region and detect anomalies in feeder
measurements.
3.1 Datasets Used
3.1.1 Satellite Sensors and Image Preprocessing
To examine the impact of different resolution levels
on land use segmentation, images of varying reso-
lutions were obtained. A Python script automated
the download of high-resolution Google Earth im-
ages (50-60 cm/pixel) and low-resolution Landsat 8
images (30 m/pixel), using binary masks from Open
Buildings V3 Polygons (Sirko et al., 2021) and the
MapBiomas project (Rosa et al., 2019). Preprocess-
ing involved converting images to PNG, segmenting
them into 384 × 384 pixel patches, and balancing the
ICEIS 2025 - 27th International Conference on Enterprise Information Systems
930
dataset to remove pairs without pixels of interest.
Google Earth, via Google Earth Engine (Gore-
lick, 2013), provided high-resolution images from ur-
ban areas of Brazil. Thirty images (8192 × 3059 pix-
els) were processed using a cropping algorithm, gen-
erating approximately 5040 smaller images. A filter
removed pairs without white pixels (buildings), leav-
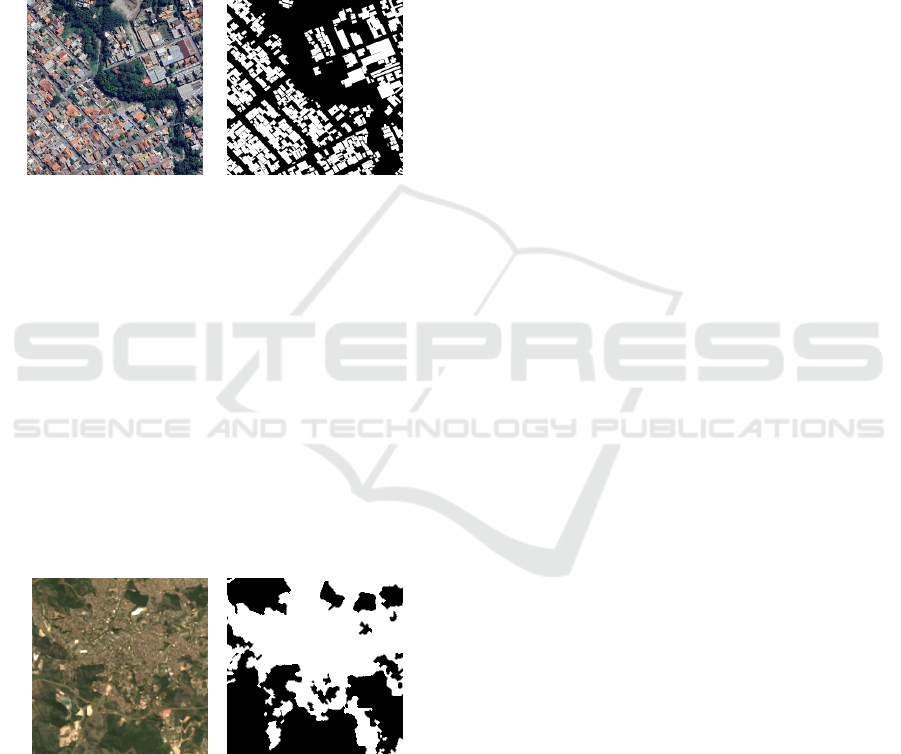
ing 1029 balanced pairs. Figure 1 illustrates an exam-
ple of an image and its corresponding binary mask,
obtained from Open Buildings V3 Polygons, which
details building outlines.
(a) Google Earth image. (b) Open Buildings mask.
Figure 1: Pair of Google Earth images of a region of Brazil
containing a cut-out of a satellite image in its original com-
position (RGB) with its respective mask obtained through
the Open Buildings V3 Polygons.
The Landsat 8 satellite (Avdan and Jovanovska,
2016) has two main sensors: OLI (Operational Land
Imager) and TIRS (Thermal Infrared Sensor). The
OLI captures multispectral images in nine bands with
a 30-meter spatial resolution, while the TIRS collects
data in two thermal bands with a 100-meter resolu-
tion, resampled to 30 meters to align with the OLI. For
this study, 30-meter multispectral images were used,
with a temporal resolution of 16 days and 510 images
in total. The Figure 2 shows an example of an RGB
image and the reference mask.
(a) Landsat 8 image. (b) MapBiomas mask.
Figure 2: Pair of images with 30 meters per pixel resolution
for neural network training. (a) RGB satellite image from
Landsat 8. (b) Groundtruth of land cover from MapBiomas.
3.1.2 Brazilian Geographic Database of the
Distribution System
The Brazilian National Electric Energy Agency
(ANEEL) mandates electricity distributors to provide
BGDDS, an annually updated geographic model that
represents Brazil’s electrical system, detailing assets
such as operational areas and infrastructure, including
high, medium, and low voltage networks, transform-
ers, poles, feeders, substations, and transmission tow-
ers. BGDDS supports grid planning, operation, and
oversight, ensuring infrastructure keeps pace with ur-
ban growth. In this study, this data was used to map
the electrical infrastructure of Minas Gerais, integrat-
ing remote sensing to identify built-up areas lacking
network coverage.
3.1.3 Integrated Framework for Monitoring the
Distribution Electrical Grid
Given the extensive number of assets managed by a
Brazilian electrical company, a tool was developed to
ensure energy balance consistency and assess com-
mercial losses at different levels (feeder, substation,
and region). The Framework integrates data from
operational measurements, telemetry-based loss as-
sessments, load flow analysis, and BGDDS network
information with monthly energy load records.
The validation process begins with data extraction
from the Framework database, followed by an ETL
(Extract, Transform, Load) workflow. Data is pre-
processed to remove inconsistencies, handle missing
values, and align with company standards. Once val-
idated, the dataset is formatted into a JSON payload
for advanced analysis.
This approach enables ranking substations by an-
nual commercial losses, identifying problematic feed-
ers, and calculating expected consumption based on
measured data, technical losses, and distributed gen-
eration, simulating ideal conditions without commer-
cial losses.
3.2 Image Segmentation Algorithms:
Architectures and Basic
Characteristics
Semantic segmentation is a crucial technique in com-
puter vision that classifies each pixel in an image
into categories such as roads, buildings, vegetation,
and water. In this context, CNN-based models have
demonstrated superior precision and computational
efficiency compared to traditional methods (Jiwani
et al., 2021). For this study, two semantic segmenta-
tion algorithms were applied to divide an image into
semantically meaningful regions, labeling each pixel
according to its respective class. The architectures
used for the analysis of various remote sensors were
LinkNetB7 and D-LinkNet50, they will be described
next.
Integrating Satellite Images Segmentation and Electrical Infrastructure Data to Identify Possible Urban Irregularities in Power Grid
931

3.2.1 Convolutional Neural Networks
Architectures
The first semantic segmentation neural network used
was LinkNetB7 (Chaurasia and Culurciello, 2017),
which employs a pretrained EfficientNet-B7 as its en-
coder, enhancing feature extraction and model gen-
eralization. With compound scaling for parameter
adjustment (Akyel and Arıcı, 2022), the architec-
ture combines encoder blocks (dimensionality reduc-
tion) and decoder blocks (image reconstruction), us-
ing batch normalization, ReLU, skip connections, and
class weighting to improve segmentation. Simple and
efficient, the model requires less data and training
time while maintaining results comparable to other
methodologies (Figure 10 B).
The second neural network used was D-
LinkNet50 (Zhou et al., 2018), originally designed for
road segmentation in satellite images but adaptable to
other domains with parameter and label adjustments.
It employs ResNet50 as its encoder, a 50-layer net-
work suitable for complex tasks (Li and Liu, 2022).
Its architecture, illustrated in Figure 10 (A), is divided
into three blocks: A (encoder, which generates a com-
pact latent representation), B (uses dilated convolu-
tions to expand the receptive field while preserving
spatial details), and C (decoder, which restores im-
age resolution via transposed convolutions, similar to
LinkNet) Zhou et al. (2018).
3.2.2 Training Parameters and Environment
The training hyperparameters were defined based on
the literature (Zhou et al., 2018; Akyel and Arıcı,
2022) and previous experiments, including an initial
learning rate of 0.001, a binarization threshold of 0.3,
and a batch size of 8. Two loss functions were tested:
BCE IoU, which combines Binary Cross Entropy and
IoU to penalize discrepancies and overlaps (Batchkala
and Ali, 2021), and Dice BCE, which balances lo-
cal and global accuracy in segmentation (Montazerol-
ghaem et al., 2023). To avoid overfitting (Afaq and
Rao, 2020), training was limited to 60 epochs with
early stopping after five epochs without significant
improvement in the loss curve.
Data augmentation techniques, such as rotation,
flipping, and shifting, were applied, generating 12
variations per training image to improve model gener-
alization. Non-augmented satellite images were used
for validation, ensuring artificial diversification and
robust learning. The algorithms were implemented
in Python using PyTorch, running on a machine with
an AMD Ryzen Threadripper 3970X x64 processor
and an NVIDIA GeForce RTX 4090 GPU (24 GB),
accelerated by the CUDA toolkit, complemented by
256 GB of RAM.
3.3 Detection of Urban Areas Covered
by Electrical Infrastructure
The methodology is based on the principle that ar-
eas with high urban occupation but lacking electrical
infrastructure are susceptible to irregular settlements
and illegal connections. To identify them, a map
of the electrical infrastructure was created using the
’PONNOT’ layer from BGDDS, filtering only poles
in urban areas, which represent the highest capillarity
of the grid (Figure 4). Image segmentation identified
occupied areas not covered by the map, generating in-
sights into regions prone to illegal connections. This
information enables operational teams to act more as-
sertively in combating commercial losses.
The PONNOT buffer, which simulates the cover-
age of electrical infrastructure from poles, was cre-
ated using mathematical morphology techniques. The
closing operation, composed of dilation (boundary
expansion) and erosion (boundary refinement) with
the same structuring element (SE), was applied to
smooth contours, fill gaps, and connect nearby areas,
ensuring continuous coverage (Gonzalez and Woods,
2000; Solomon and Breckon, 2013). This approach
eliminated gaps between buffers, resulting in a homo-
geneous area (Figure 4). The final electrical infras-
tructure coverage map is presented in Section 4.
4 RESULTS AND DISCUSSIONS
The study area was selected based on two criteria:
urbanization and supply by a substation with high
commercial losses. The SBAU substation, located in
Sabar
´
a, Minas Gerais, met these criteria, recording a
commercial loss of 32.094 MWh in 2023, equivalent
to 26% of all measured energy—well above the na-
tional average of 6.7% (ANEEL, 2025).
SBAU serves ∼ 30, 000 low and medium-voltage
customers across ∼ 85 km
2
through four feeders:
SBAU02, SBAU03, SBAU04, and SBAU05. Figure
5 shows their historical measurement data. SBAU05
(Figure 5 d) had the highest commercial loss rate
(47.5%), aligning with studies linking non-technical
losses to socioeconomic factors (ANEEL, 2025). No-
tably, its data consistency suggests it as a key case for
loss mitigation studies.
Other feeders also exhibit relevant patterns.
SBAU02 (Figure 5 a) had the lowest loss (6%) in
2023, serving the fewest customers. SBAU03 (Fig-
ure 5 b) showed stable losses with three notable vari-
ICEIS 2025 - 27th International Conference on Enterprise Information Systems
932
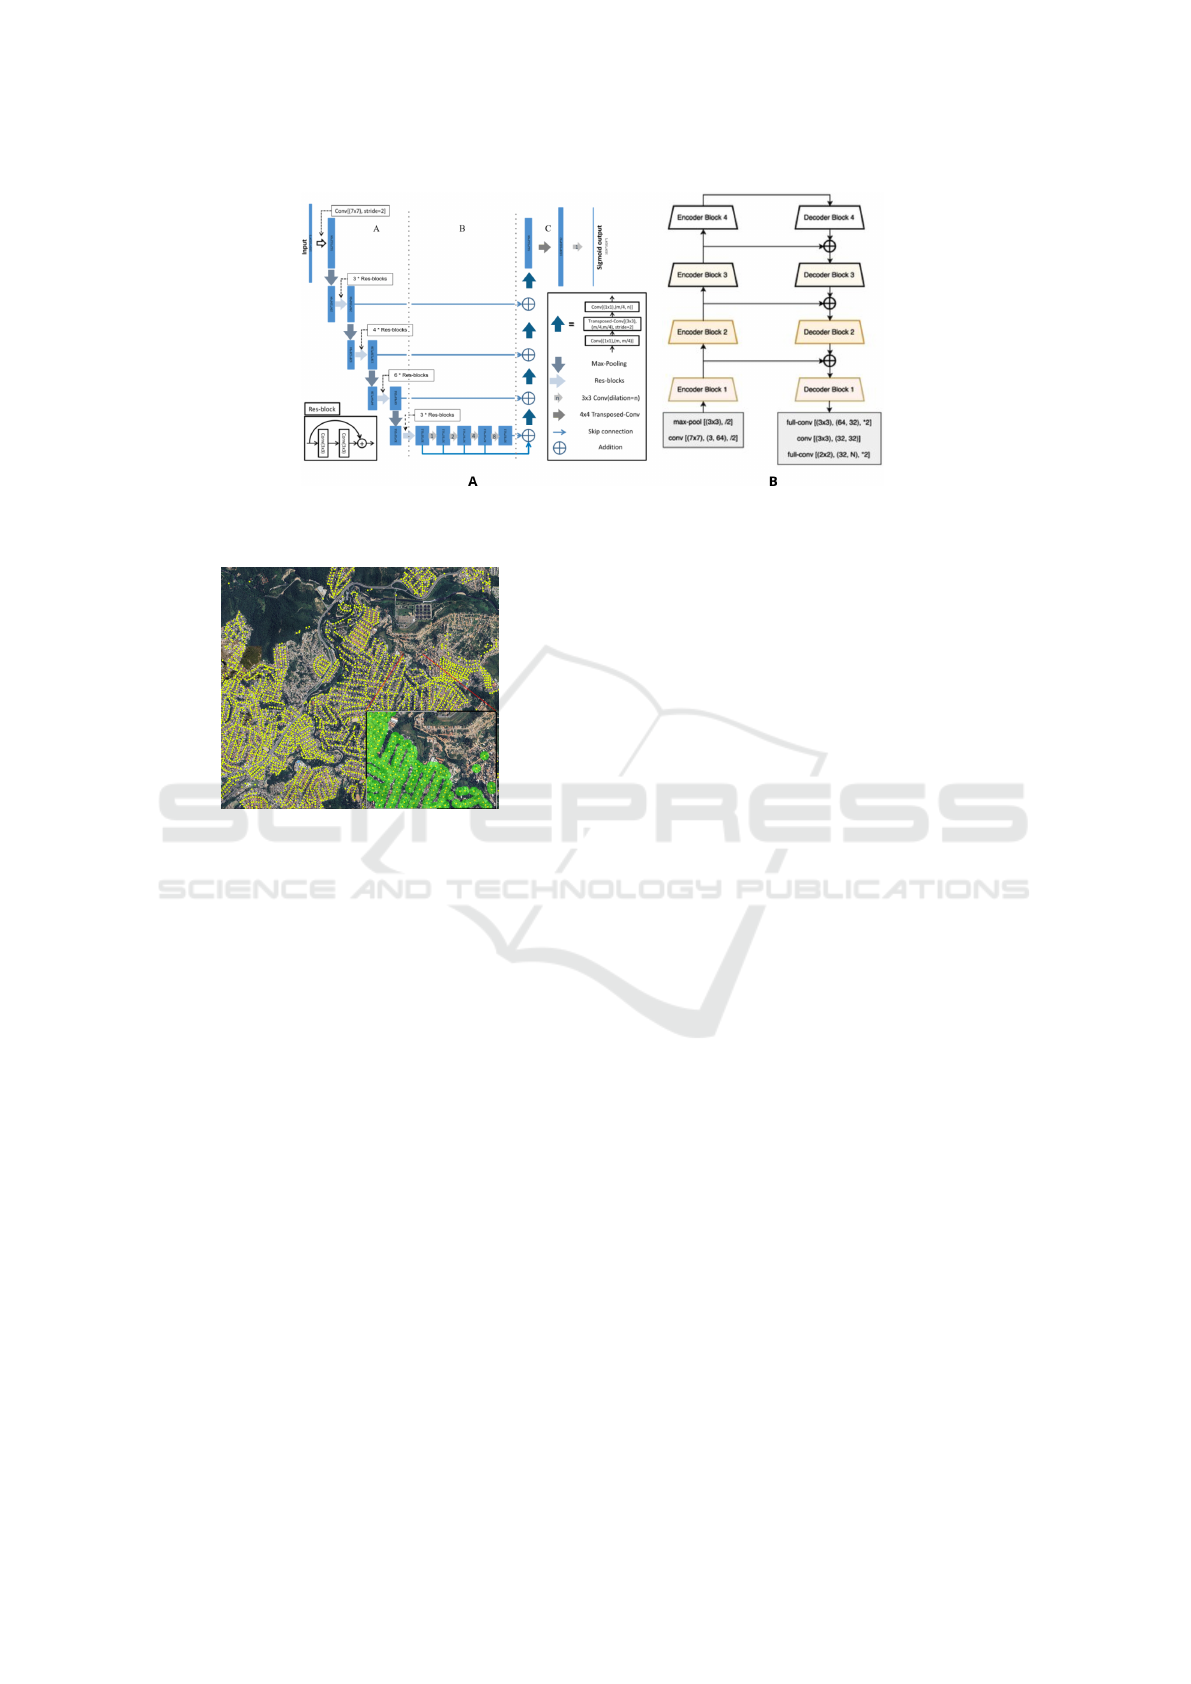
Figure 3: (a) Architecture of the D-LinkNet50 Deep Neural Network, (B) LinkNet Deep Neural Network Architecture.
Adapted from: Chaurasia and Culurciello (2017); Zhou et al. (2018).
Figure 4: The image illustrates the PONNOT points (yel-
low) representing electrical infrastructure poles and their
corresponding buffers (green), which simulate the coverage
area of electrical infrastructure.
ations, while SBAU04 (Figure 5 c) had pronounced
fluctuations, possibly due to operational maneuvers or
irregularities.
Following this analysis, the next step was to assess
the pole infrastructure coverage in the feeder-supplied
regions to identify buildings not connected to the en-
ergy grid.
After training and validating the satellite image
segmentation models for land use and land cover de-
tection, performance metrics such as accuracy, f1-
score, and IoU were evaluated. Additionally, Table
1 presents the number of epochs required for each
model to reach the stopping criterion, as well as the
corresponding training time.
Deep learning techniques, such as U-Net, achieve
up to 95% accuracy in land use classification
(
´
Agton de Oliveira, 2020). However, the choice of ar-
chitecture and loss function depends on image resolu-
tion and application context. High-resolution images
are ideal for detailed building identification, whereas
lower-resolution images are better suited for large-
scale detection tasks.
For Google Earth images, BCEIoU loss yielded
the best performance for LinkNetB7, reaching opti-
mal results in 30 epochs. In contrast, DICE BCE
achieved the highest overall accuracy, requiring 36
epochs and a training time of 4 hours and 38 min-
utes. For Landsat 8, LinkNetB7 combined with DICE
BCE achieved an impressive accuracy of 0.97 in just
12 epochs.
Table 1 highlights the significant impact of ar-
chitecture and loss function on segmentation perfor-
mance. BCE IoU proved superior for high-resolution
images, while DICE BCE outperformed in lower-
resolution scenarios. The variation in training time
and required epochs underscores the importance of
careful model selection based on the specific task and
data characteristics.
Figures 6 and 8 provide qualitative insights into
the model’s performance, showcasing its ability to
handle both detailed and large-scale features. Addi-
tionally, Figures 7 and 9 present the prediction masks
for Google Earth and Landsat 8 images, respectively,
further illustrating the model’s adaptability across dif-
ferent resolutions.
Google Earth images enable individual building
block differentiation, whereas Landsat 8 images re-
veal only occupation patches. High-resolution images
are preferred for precise urban monitoring, as they
differentiate individual lots, crucial for detailed analy-
sis. In contrast, low-resolution images merge multiple
lots, reducing clarity but remaining useful for track-
ing rapid urban growth. Sensor selection should align
with monitoring needs: low-resolution images suit
dense or rapidly urbanizing areas, where changes are
more noticeable at the edges, while high-resolution
images are essential for low-density regions, such as
rural areas, to detect subtle land use changes.
Figure 10 (A and B) present maps generated
through semantic segmentation of land use and oc-
Integrating Satellite Images Segmentation and Electrical Infrastructure Data to Identify Possible Urban Irregularities in Power Grid
933
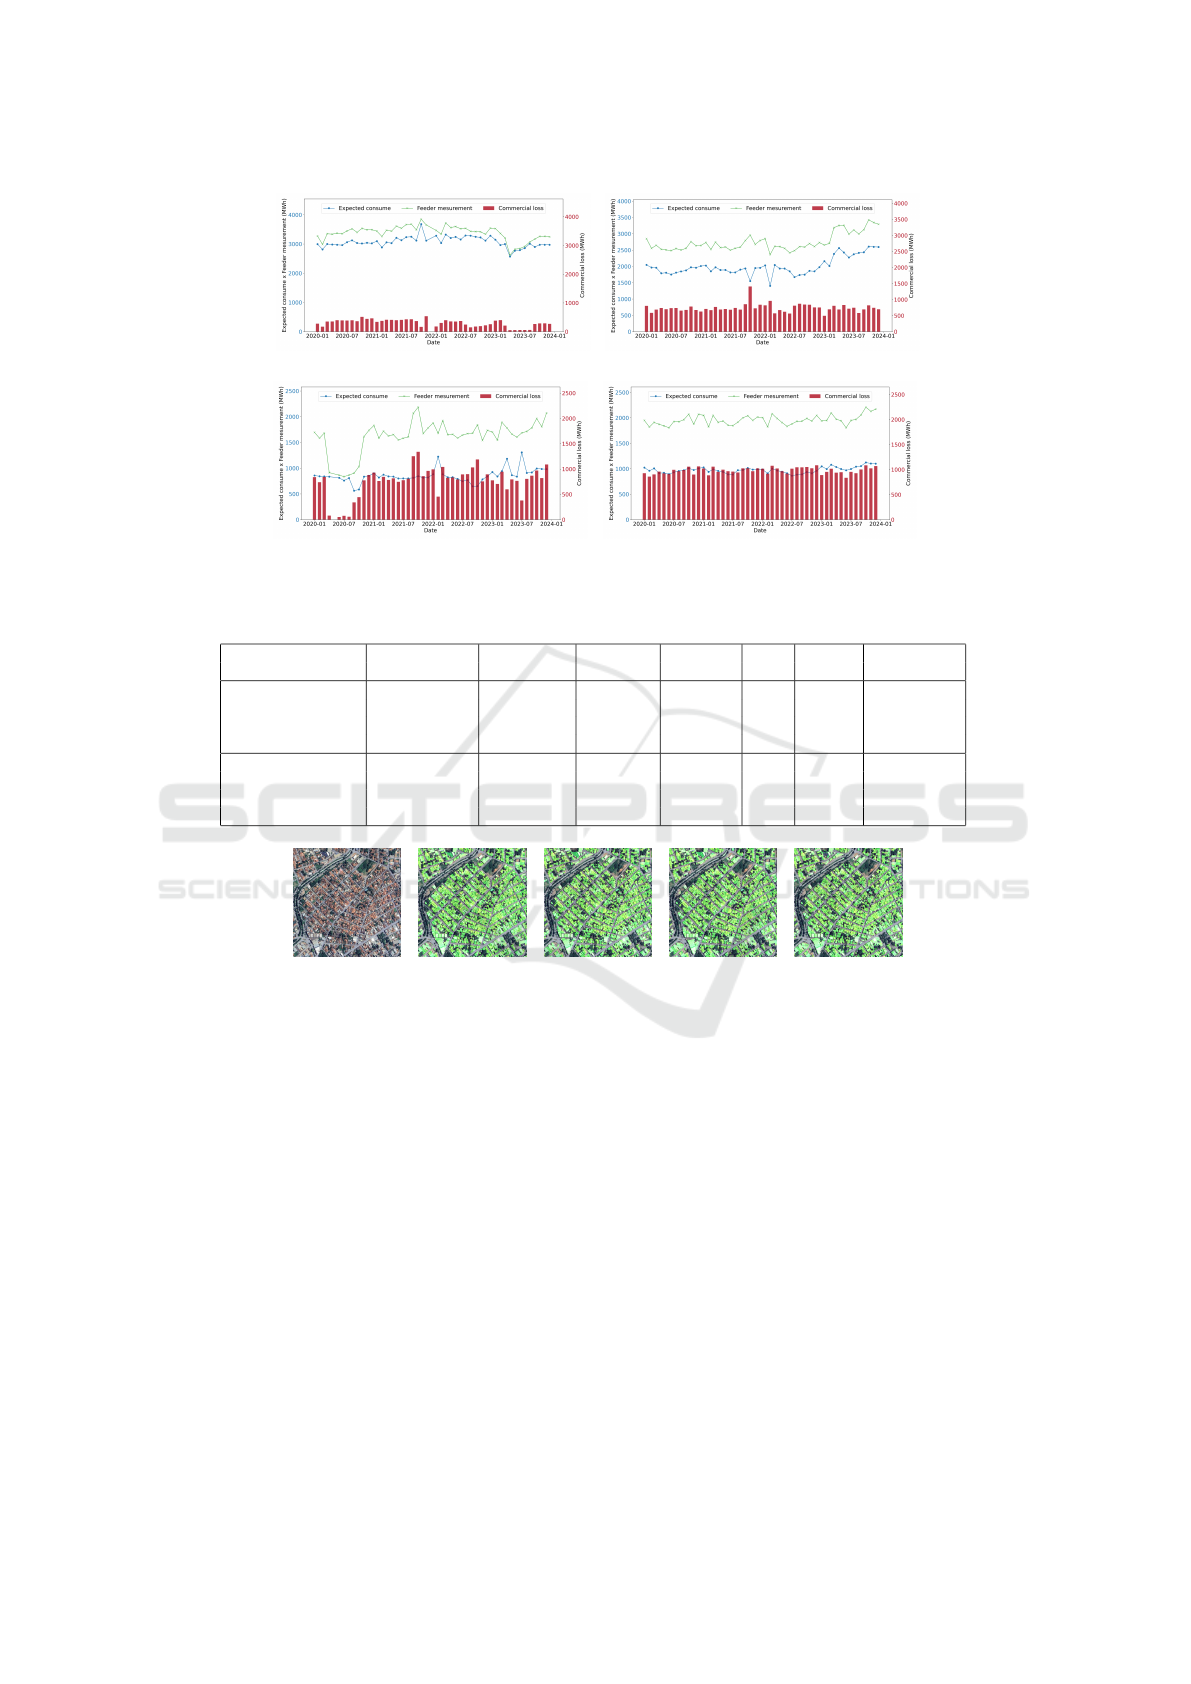
(a) SBA02 (b) SBA03
(c) SBA04 (d) SBA05
Figure 5: Historical series of feeder measurements, expected consumption, and NTL for the SBAU substation.
Table 1: Performance of the Segmentation Neural Network trained with images from different sensors.
Satellite
Architecture
Loss
Accuracy F1-Score IoU Epochs
Training
Sensor Function Time
LinkNetB7 BCEIoU 0,86 0,78 0,77 30 10 h 19 min
Google Earth LinkNetB7 DICE BCE 0,85 0,77 0,76 6 2 h 19 min
(∼ 0,60 m / pixel) D-LinkNet50 BCEIoU 0,84 0,75 0,74 28 9 h 22 min
D-LinkNet50 DICE BCE 0,84 0,75 0,73 27 9 h 01 min
LinkNetB7 BCEIoU 0,96 0,96 0,93 46 7 h 26 min
Landsat 8 LinkNetB7 DICE BCE 0,97 0,96 0,94 12 2 h 03 min
(30 m / pixel) D-LinkNet50 BCEIoU 0,94 0,92 0,88 19 3 h 04 min
D-LinkNet50 DICE BCE 0,95 0,94 0,90 16 2 h 36 min
(a) (b) (c) (d) (e)
Figure 6: Prediction results overlaid on the original for the Google Earth satellite image. (a) Original image; (b) LinkNetB7
BCEIoU; (c) LinkNetB7 DICE BCE; (d) D-LinkNet50 BCEIoU; (e) D-LinkNet50 DICE BCE.
cupation, overlaid with electrical infrastructure cov-
erage (in green). Urban areas are highlighted (in red),
emphasizing densely occupied regions, particularly
those without electrical grid access.
As shown in Figure 10 (A and B), regions near the
SBAU05 and SBAU04 feeders exhibit evident urban
occupation but lack electrical infrastructure coverage
in the official data. This absence, combined with
the high percentage of commercial losses recorded
in these feeders, suggests that these areas may corre-
spond to irregular settlements or illegal connections.
Furthermore, the spatial detail provided by the
segmentation of Google Earth images enabled a more
precise identification of urban occupation areas, while
the Landsat 8 images, with their lower resolution,
posed challenges in detecting smaller clusters. There-
fore, the combination of segmentation data with the
analysis of electrical infrastructure proved effective in
identifying potentially problematic regions, providing
valuable insights for better management and monitor-
ing efforts.
5 CONCLUSIONS
The combination of CNNs with geospatial analysis
techniques has proven effective in detecting irregu-
lar occupations in urban areas, integrating popula-
tion, infrastructure, and satellite data. However, the
study has limitations, such as geographic restrictions
(Sabar
´
a, Minas Gerais), reliance on specific satellite
data (Google Earth and Landsat 8), and the lack of
real-time integration with utility operational systems.
ICEIS 2025 - 27th International Conference on Enterprise Information Systems
934
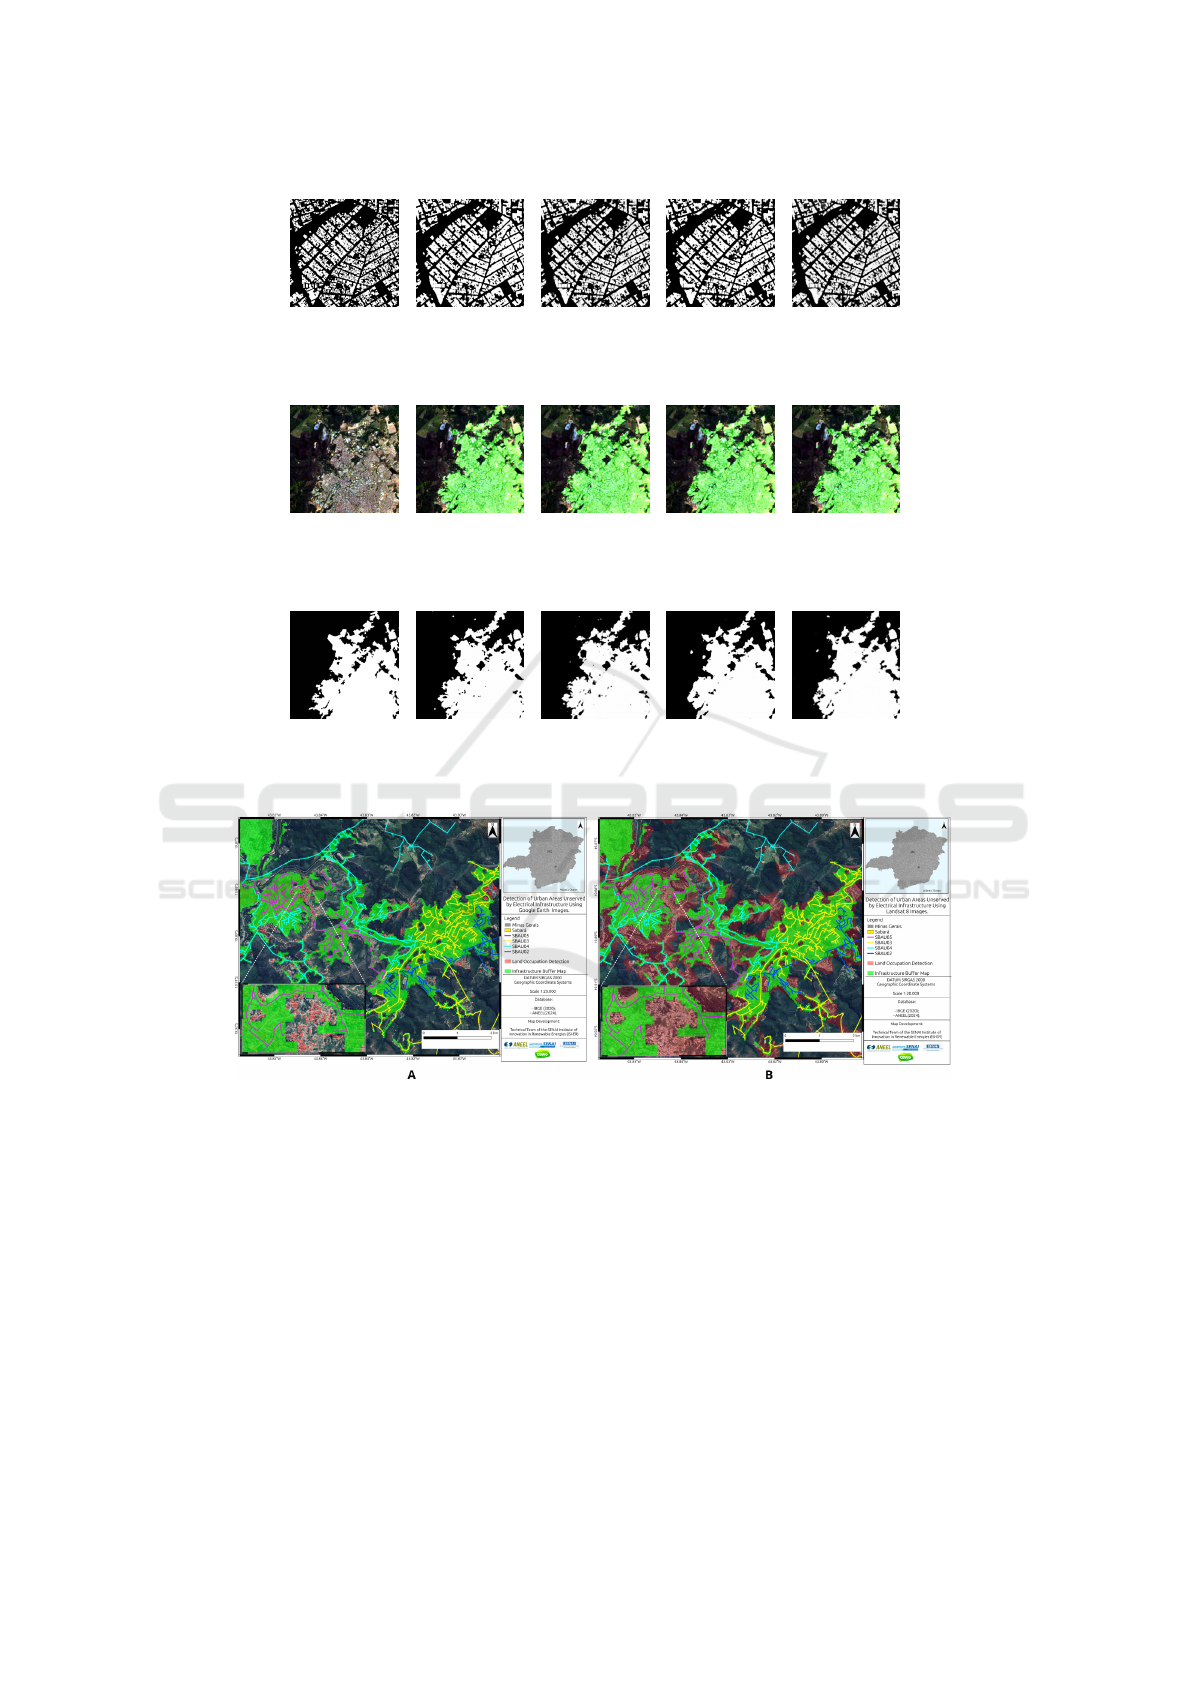
(a) (b) (c) (d) (e)
Figure 7: Prediction results for the Google Earth satellite image dataset. (a) Ground truth; (b) LinkNetB7 BCEIoU; (c)
LinkNetB7 DICE BCE; (d) D-LinkNet50 BCEIoU; (e) D-LinkNet50 DICE BCE.
(a) (b) (c) (d) (e)
Figure 8: Prediction results overlaid on the original for the Landsat 8 satellite image dataset. (a) Original satellite image; (b)
LinkNetB7 BCEIoU; (c) LinkNetB7 DICE BCE; (d) D-LinkNet50 BCEIoU; (e) D-LinkNet50 DICE BCE.
(a) (b) (c) (d) (e)
Figure 9: Prediction results for the Landsat 8 satellite image dataset. (a) Ground truth; (b) LinkNetB7 BCEIoU; (c) LinkNetB7
DICE BCE; (d) D-LinkNet50 BCEIoU; (e) D-LinkNet50 DICE BCE.
Figure 10: Land Use Prediction Using (A) Google Earth Satellite Images , (B) Landsat 8 Satellite and CEMIG Electrical Grid
Coverage.
To advance, future research should expand the ge-
ographic scope, incorporate real-time and diverse data
(socioeconomic and urban expansion), and explore
more advanced neural architectures or hybrid models.
Additionally, the development of a decision-support
framework for utilities, with urban monitoring tools
and demand forecasting, can enhance energy plan-
ning. Studies on the socioeconomic impacts of irreg-
ular settlements are also necessary for more compre-
hensive policies.
This research paves the way for artificial intel-
ligence applications in urban energy management,
promoting sustainable development and equitable re-
source distribution.
ACKNOWLEDGEMENTS
We thank CEMIG, ANEEL (PD-04950-0664/2023),
CNPq, and CAPES for their financial support and col-
laboration, which were essential for this study and
for advancing research, development, and innovation
(R&D&I) in the electrical sector.
Integrating Satellite Images Segmentation and Electrical Infrastructure Data to Identify Possible Urban Irregularities in Power Grid
935

REFERENCES
Abujayyab, S. K., Almajalid, R., Wazirali, R., Ahmad, R.,
Tas¸o
˘
glu, E., Karas, I. R., and Hijazi, I. (2023). In-
tegrating object-based and pixel-based segmentation
for building footprint extraction from satellite images.
Journal of King Saud University-Computer and Infor-
mation Sciences, 35(10):101802.
Afaq, S. and Rao, S. (2020). Significance of epochs on
training a neural network. Int. J. Sci. Technol. Res,
9(06):485–488.
Akyel, C. and Arıcı, N. (2022). Linknet-b7: noise re-
moval and lesion segmentation in images of skin can-
cer. Mathematics, 10(5):736.
ANEEL (2025). Energy loss reports - light in the tariff.
Accessed: January 3, 2025.
Archana, R. and Jeevaraj, P. E. (2024). Deep learning mod-
els for digital image processing: a review. Artificial
Intelligence Review, 57(1):11.
Atas¸,
˙
I. (2023). Performance evaluation of jaccard-dice co-
efficient on building segmentation from high resolu-
tion satellite images. Balkan Journal of Electrical and
Computer Engineering, 11(1):100–106.
Avdan, U. and Jovanovska, G. (2016). Algorithm for
automated mapping of land surface temperature us-
ing landsat 8 satellite data. Journal of sensors,
2016(1):1480307.
Batchkala, G. and Ali, S. (2021). Real-time polyp segmen-
tation using u-net with iou loss.
Chaurasia, A. and Culurciello, E. (2017). Linknet: Exploit-
ing encoder representations for efficient semantic seg-
mentation. In 2017 IEEE visual communications and
image processing (VCIP), pages 1–4. IEEE.
EPE (2024). Balanc¸o Energ
´
etico Nacional 2024. Acesso
em: 30 set. 2024.
Flores, J. L. O. et al. (2023). Consumo de energia e cresci-
mento econ
ˆ
omico no brasil.
Gonzalez, R. C. and Woods, R. E. (2000). Processamento
de imagens digitais. Editora Blucher.
Gorelick, N. (2013). Google earth engine. In EGU gen-
eral assembly conference abstracts, volume 15, page
11997. American Geophysical Union Vienna, Austria.
He, Z., Yao, W., Shao, J., and Wang, P. (2024). Ub-finenet:
Urban building fine-grained classification network for
open-access satellite images. ISPRS Journal of Pho-
togrammetry and Remote Sensing, 217:76–90.
Jiwani, A., Ganguly, S., Ding, C., Zhou, N., and Chan,
D. M. (2021). A semantic segmentation network
for urban-scale building footprint extraction using rgb
satellite imagery. arXiv preprint arXiv:2104.01263.
Khan, A. and Sudheer, M. (2022). Machine learning-based
monitoring and modeling for spatio-temporal urban
growth of islamabad. The Egyptian Journal of Remote
Sensing and Space Science, 25(2):541–550.
Li, S. and Liu, X. (2022). Multi-type road extraction and
analysis of high-resolution images with d-linknet50.
In 2022 3rd International Conference on Geology,
Mapping and Remote Sensing (ICGMRS), pages 244–
248. IEEE.
Montazerolghaem, M., Sun, Y., Sasso, G., and Haworth, A.
(2023). U-net architecture for prostate segmentation:
the impact of loss function on system performance.
Bioengineering, 10(4):412.
Rani, K. P., Rao, K. S., Sreedevi, P., Subbaraju, G. V.,
Dastagiriah, C., and Padmavathi, J. (2024). Land
cover extraction from satellite imagery using u-net
model. In Proceedings of the 11th International Con-
ference on Computing for Sustainable Global Devel-
opment, pages 1361–1367.
Rosa, M., Shimbo, J. Z., and Azevedo, T. (2019).
Mapbiomas-mapeando as transformac¸
˜
oes do territ
´
orio
brasileiro nas
´
ultimas tr
ˆ
es d
´
ecadas. VIII Simp
´
osio de
Restaurac¸
˜
ao Ecol
´
ogica, pages 95–100.
Sirko, W., Kashubin, S., Ritter, M., Annkah, A., Bouchareb,
Y. S. E., Dauphin, Y., Keysers, D., Neumann, M.,
Cisse, M., and Quinn, J. (2021). Continental-scale
building detection from high resolution satellite im-
agery. arXiv preprint arXiv:2107.12283.
Solomon, C. and Breckon, T. (2013). Fundamentos de
processamento digital de imagens-Uma abordagem
pr
´
atica com exemplos em MatLab.
Ullah, S., Qiao, X., and Abbas, M. (2024). Addressing the
impact of land use land cover changes on land surface
temperature using machine learning algorithms. Sci-
entific Reports, 14(1):18746.
Zhou, L., Zhang, C., and Wu, M. (2018). D-linknet: Linknet
with pretrained encoder and dilated convolution for
high resolution satellite imagery road extraction. In
Proceedings of the IEEE conference on computer vi-
sion and pattern recognition workshops, pages 182–
186.
´
Agton de Oliveira, P. (2020). Deep learning na segmentac¸
˜
ao
autom
´
atica de imagens de sat
´
elite. 24 pages. Tra-
balho de Conclus
˜
ao de Curso (Graduac¸
˜
ao) - Engen-
haria Agr
´
ıcola e Ambiental.
ICEIS 2025 - 27th International Conference on Enterprise Information Systems
936
