
Anomaly Detection on Univariate Time Series Data Using Exponentially
Weighted Moving Average (AnEWMA)
Jalaa Hoblos
a
Computer Science Department, Stony Brook University, Stony Brook, NY, U.S.A.
Keywords:
Anomaly Detection, EWMA, Time Series, Exponentially Weighted Moving Average, Control Limits.
Abstract:
Anomaly detection in time series data is a critical task with wide-ranging applications in industries such as
finance, cybersecurity, healthcare, and manufacturing. It involves the identification of data points or patterns
that deviate significantly from the expected behavior, thereby ensuring the integrity and reliability of data
analysis and decision-making processes. Several methods have been developed to address this challenge, each
offering unique advantages and addressing different aspects of the problem, ranging from statistical meth-
ods, to machine learning techniques, and dynamic time warping methods. In this work, we present a novel
Anomaly Detection approach (AnEWMA) able to identify anomalies through the application of the Expo-
nentially Weighted Moving Average (EWMA). AnEWMA leverages the responsiveness of EWMA to subtle
shifts in data trends, enabling the detection of anomalies in a lightweight and computationally efficient manner.
AnEWMA adjusts the control limits of the monitoring system using tuned heuristic multipliers. Traditional
methods often rely on fixed control limits, which can lead to a high rate of false positives or missed anoma-
lies, especially in the presence of noisy or non-stationary data. The proposed AnEWMA algorithm shows
promising results when compared with state-of-the-art unsupervised and semi-supervised anomaly detection
methods using stream data from popular Benchmarks.
1 INTRODUCTION
Internet of Things (IoT) devices, such as sensors
and smart devices, continuously generate big data as
they monitor environments, processes, user interac-
tions, and system performance. These data points
are collected at regular intervals, creating time se-
ries data. However, this data often accommodates
unexpected fluctuations, known as anomalies, that
could signal critical events or errors in data collec-
tion. Anomaly detection is, therefore, vital for main-
taining data’ integrity and ensuring reliable analyses.
One renowned technique for anomaly detection is the
Exponentially Weighted Moving Average (EWMA),
which emphasizes recent observations, making it sen-
sitive to changes in the data stream. This article
aims to investigate the application of the Exponen-
tially Weighted Moving Average for the timely detec-
tion of anomalies in time series data, underscoring its
potential in enhancing forecasting accuracy and data
quality.
Previous work (Braei and Wagner, 2020) shows
that the statistical approaches perform best on uni-
variate time series by detecting point and collective
a
https://orcid.org/0009-0009-3319-5776
anomalies. Statistical methods can perform well with
limited data compared to machine learning or deep
learning approaches that often require large datasets.
They also require less computation time compared to
other methods.
The authors in (Borror et al., 1999) show
that EWMA is generally robust to mild departures
from normality, maintaining acceptable performance
even when the underlying distribution is moderately
skewed or has heavier tails than the normal distribu-
tion. However, they found that severe departures from
normality, such as highly skewed or extremely heavy-
tailed distributions, can significantly impact the con-
trol chart’s performance, leading to an increased false
alarm rate or reduced detection of process shifts.
They also suggest that one should carefully consider
the characteristics of their process data and adjust the
EWMA control chart parameters accordingly to en-
sure reliable monitoring and control in the presence
of non-normal distributions.
In this work, we introduce a detection algorithm
based on the EWMA (AnEWMA) and we show that
it is capable of detecting deviations from established
patterns with both adequate sensitivity and specificity
when compared to other anomaly detection algo-
rithms. AnEWMA simplicity and low computational
402
Hoblos, J.
Anomaly Detection on Univariate Time Series Data Using Exponentially Weighted Moving Average (AnEWMA).
DOI: 10.5220/0013437800003944
In Proceedings of the 10th International Conference on Internet of Things, Big Data and Security (IoTBDS 2025), pages 402-409
ISBN: 978-989-758-750-4; ISSN: 2184-4976
Copyright © 2025 by Paper published under CC license (CC BY-NC-ND 4.0)

overhead, compared to more complex machine learn-
ing models, makes it an attractive option for a wide
range of applications. Importantly, the effectiveness
of the AnEWMA in our tests suggests its potential as
a standalone tool in scenarios where the prompt and
accurate detection of anomalies is essential, negating
the necessity for extensive historical data and reduc-
ing the time to implementation.
The contributions of this work are summarized as
follows:
1. Effective Anomaly Detection: AnEWMA demon-
strates adequate sensitivity and specificity in de-
tecting deviations from established patterns.
2. Simplicity and Efficiency: Its simplicity and low
computational overhead makes it a practical alter-
native to more complex machine learning models.
3. Standalone Tool Potential: The algorithm’s effec-
tiveness suggests it can be used as a standalone
tool, especially in scenarios requiring prompt and
accurate anomaly detection, without the need for
extensive historical data, thus reducing implemen-
tation time.
This paper is organized as follows: Section 2
briefly covers major research work in anomaly detec-
tion in time series. Section 3 reviews the Exponen-
tially Weighted Moving Average method. Sections 4
and 5 describe in detail the methodology and Section
6 shows the detection algorithm, AnEWMA. Section
7 presents the simulation implementation, assump-
tions, and performance results. Section 8 presents the
conclusion and future work.
2 BACKGROUND
Adams et al. (Adams and MacKay, 2007) presents
a Bayesian online changepoint detection is a method
used for identifying changes in the statistical proper-
ties of a time series in real-time. A changepoint is
defined as a time when the statistical properties of the
data abruptly shift. The algorithm detects the most
recent changepoint in the current input values by ana-
lyzing the probability distributions of time series par-
titions, which are derived from changepoints identi-
fied in past values. However, the algorithm requires
a well-specified probabilistic model for the data. If
the model is poorly chosen or does not fit the data ac-
curately, the changepoint detection performance will
degrade significantly.
The authors in (Maciag et al., 2019) introduce a
novel approach called Online Evolving Spiking Neu-
ral Networks for Unsupervised Anomaly Detection
(OeSNN-UAD). The article shows that the spiking
neural networks evolve over time, adapting to new
data without the need for retraining and incorporates
dynamic normalization to handle variations in the
data stream. But the evolving nature of the network
and the use of spiking neurons can make the imple-
mentation complex and computationally demanding.
D
¨
aubener et al. (D
¨
aubener et al., 2019) conducted
an empirical comparison of common machine learn-
ing and statistical methods for anomaly detection.
Their findings indicate that Gaussian processes and
support vector machines perform slightly better than
other algorithms.
Garcia et al. (Bl
´
azquez-Garc
´
ıa et al., 2021) pre-
sented a structured and comprehensive state-of-the-
art on outlier detection techniques in time series data.
The authors propose a taxonomy based on three main
aspects: the type of input data, the type of out-
lier, and the nature of the detection method. The
paper discusses various types of outliers, including
point anomalies, contextual anomalies, and collective
anomalies It also covers a wide range of detection
methods, such as statistical methods, machine learn-
ing approaches, and hybrid techniques.
The article (Laptev et al., 2015) introduces a
framework developed by Yahoo Labs for detecting
anomalies in large-scale time-series data. The frame-
work aims to provide early detection of anomalies
to maintain data consistency and protect against ma-
licious attacks. The framework uses a combination
of anomaly detection and forecasting models with an
anomaly filtering layer to improve accuracy and scal-
ability. The framework shows a 50-60% improvement
in precision and recall across various use cases.
Thill et al. (Thill et al., 2017) proposed an on-
line regression anomaly detector (SORAD) for de-
tecting anomalies in streaming data using the Yahoo
S5 dataset (Webscope, 2015). The authors show that
SORAD outperformed other detection algorithms on
these datasets. However, the algorithm doesn’t work
well on the Numenta Anomaly Benchmark (NAB)
datasets.
Schneider et al. (Schneider et al., 2016) intro-
duces an algorithm to detect anomalies by estimating
the similarity between new data points and the dis-
tribution of regular data. EXPoSE is a kernel-based
method that uses an inner product with a reproduc-
ing kernel Hilbert space embedding, making no as-
sumptions about the data distribution. It offers linear
time complexity for batch learning and constant time
for online learning and predictions. However, the per-
formance of EXPoSE heavily depends on the choice
of the kernel function, which may require domain-
specific knowledge and experimentation.
Etsy Skyline (Stanway, 2013) is an open-source
Anomaly Detection on Univariate Time Series Data Using Exponentially Weighted Moving Average (AnEWMA)
403

anomaly detection system developed by Etsy to mon-
itor and detect anomalies in real-time time-series
data. Skyline is designed to scale with Etsy?s infras-
tructure, providing fast and efficient anomaly detec-
tion across large datasets without requiring predefined
thresholds for alerting. However, setting up and tun-
ing Skyline can be complex and requires significant
computational power and memory.
Wang et al. (Wang et al., 2011) aims to develop
lightweight, accurate methods for online anomaly de-
tection to improve data center management. The au-
thors propose using the Tukey method and the Rel-
ative Entropy statistic for anomaly detection. These
techniques are adapted to handle the specific needs
of data centers, such as large-scale environments and
continuous monitoring. They are designed to be effi-
cient and to improve over standard Gaussian assump-
tions in terms of performance. While the methods are
lightweight, they may still face challenges when scal-
ing to extremely large data centers with diverse and
complex workloads. In addition, implementing and
tuning these statistical techniques can be complex,
requiring significant expertise and computational re-
sources.
The authors in (Mejri et al., 2024) provides
a comprehensive evaluation of recent unsupervised
anomaly detection techniques in time-series data. It
goes beyond standard performance metrics like preci-
sion, recall, and F1-score by incorporating additional
metrics and protocols tailored specifically for time-
series data. The study evaluates model size, stability,
and the performance of different approaches with re-
spect to various types of anomalies.
DeepAnT (Munir et al., 2019) is a deep learning-
based approach designed to detect anomalies in time
series data. The paper proposes the use of 1D Con-
volutional Neural Network (CNN)s for time series
anomaly detection, arguing that CNNs are effective
in capturing temporal patterns. The CNN takes a slid-
ing window of previous time steps to predict the next
value. The results indicate that DeepAnT is capable of
detecting both point anomalies and collective anoma-
lies and it also shows better performance compared to
traditional anomaly detection techniques, particularly
in time series where patterns are non-linear or com-
plex.
Twitter inc. (Kejariwal, 2015) developed an
Anomaly Detection R package. The package aims
to automatically detect anomalies in large-scale time-
series data, such as spikes in user engagement on
social media platforms. It uses Seasonal Hybrid
Extreme Studentized Deviate (S-H-ESD) to detect
both global and local anomalies by decomposing the
time series and applying robust statistical metrics.
Nonetheless, implementing and refining the algorithm
can be complex and may require significant expertise
and its effectiveness can vary depending on the spe-
cific context and nature of the data.
3 EXPONENTIALLY WEIGHTED
MOVING AVERAGE (EWMA)
The Exponentially Weighted Moving Average
(EWMA) (Lucas and Saccucci, 1990) is a popular
statistical technique used in various fields, including
finance, economics, and engineering, to analyze
and forecast time series data. This technique is
particularly useful in situations where recent data
points are more relevant than older ones, as it assigns
greater weight to more recent observations.
The EWMA is calculated by taking the weighted
average of the current and previous values, where the
weights decay exponentially as the data points be-
come older. This method provides a smoothing effect
on the data, reducing the impact of short-term fluc-
tuations and noise, while still capturing the underly-
ing trends and patterns. The Exponentially Weighted
Moving Average (EWMA) statistic Z
t
at time t is
given by:
Z
t
= λX
t
+ (1 − λ)Z
t−1
(1)
where:
• λ is the smoothing constant ( 0 < λ ≤ 1 )
• X
t
is the observation at time t
• Z
t−1
is the EWMA statistic at the previous time
period
The Lower and Upper Control Limits for the
EWMA chart are calculated as shown in Eq. 2:
UCL
t
= µ
0
+ Lσ
r
λ
2 − λ
(1 − (1 − λ)
2t
)
LCL
t
= µ
0
− Lσ
r
λ
2 − λ
(1 − (1 − λ)
2t
)
(2)
where:
• µ
0
is the target mean
• σ is the standard deviation of the process
• L the multiplier that determines the width of the
control limits
4 METHODOLOGY
We start by dividing the dataset of size n in smaller
subsets of fixed size m, except the last subset which
may be smaller.
IoTBDS 2025 - 10th International Conference on Internet of Things, Big Data and Security
404
Most anomaly detection algorithms utilize be-
tween 30% to 40% of the data for training. However,
in this work, we rely on a smaller subset of data to
gain insight into the behavior of the entire dataset. We
take the first 20% of the dataset, and we build on it the
expected behavior of the dataset. Simply put, we as-
sume that the values in this subset are within the nor-
mal ranges. This subset, which we call ∆, becomes
fundamental because it serves later as a reference for
assessing deviations from the standard behavior.
We denote the values in the dataset by x and we
assume that we have k subsets other than ∆. Using
EWMA Eq. 1, we compute the set of predicted values
of ∆ and we call it τ. We then compute the residuals
defined as the difference between the actual values of
x and the predicted EWMA values in τ. We name the
residuals set of ∆ by Γ. Eq. 3 shows the residuals’
equation for subset ∆.
Γ
j
=| x
j
− τ
j
| ∀ j ∈ ∆ (3)
Utilizing the residuals computed in Eq. 3, we de-
velop an upper and lower control limits (UCL
∆
and
LCL
∆
) for subset ∆, similar to those shown in Eq. 2.
These values are later used to detect anomalies for the
rest of the dataset as we explain thereafter. However,
before computing UCL
∆
and LCL
∆
, we need to esti-
mate the multiplier L as shown in Eq. 2. Unlike stan-
dard EWMA, which uses one multiplier, we utilize
two multipliers, L and L’, where L is used to calculate
the UCL and L’ is used determine the LCL.
To calculate the multipliers for subset ∆, we use
the residuals set Γ. The computation of L
∆
and L
′
∆
of
subset ∆ are shown in details in Section 4.1. We then
use these multipliers to determine the control limits
UCL
∆
and LCL
∆
as shown in Eq. 4:
UCL
∆
=
¯
Γ + L
∆
· Σ
LCL
∆
=
¯
Γ − L
′
∆
· Σ
(4)
where
¯
Γ is the mean of Γ and Σ is the standard devi-
ation of Γ of subset ∆. As one can notice, UCL and
LCL shown in 4 were inspired from the EWMA con-
trol limits computation.
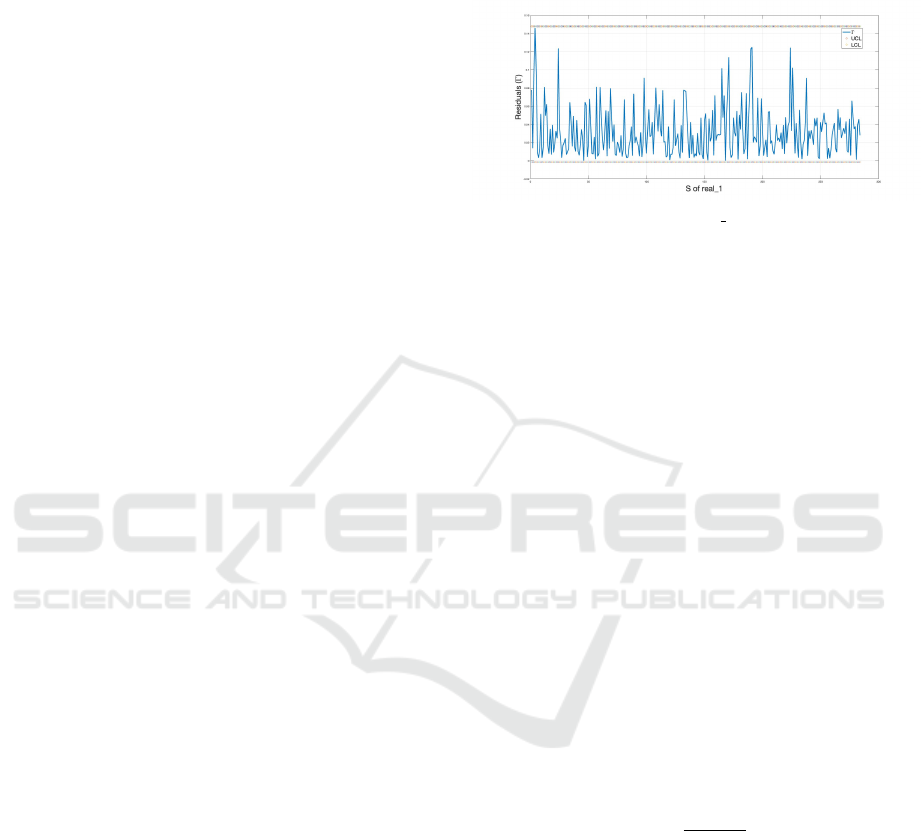
4.1 Computing the Multipliers of
Subset ∆
Before digging into the details of computing the mul-
tipliers,We need to stress the importance of selecting
the appropriate control limits for detecting anomalies
accurately. To approximate the multipliers L
∆
, L
′
∆
, we
begin by plotting the residuals Γ to learn about the
behavior of the data series. We determine the multi-
pliers in such a way that all residuals fall between the
UCL
∆
and the LCL
∆
. For example, Figure 1 illustrates
the LCL
∆
and UCL
∆
in ∆ of real
1
(Webscope, 2015),
where L
∆
is assigned 4.3 and L
′
∆
is assigned to 1.25.
Additionally, the UCL
∆
and LCL
∆
values are 0.1478
and −0.0016, respectively.
Figure 1: Residuals in ∆ of real 1 , LCL
∆
, and UCL
∆
.
These values are subsequently utilized to compute
the upper and lower control limits of future data sub-
sets as shown later.
5 CONTROL LIMITS
COMPUTATION
Due to potential high fluctuations of the values in the
subsequent sets, it is not realistic to use the fixed val-
ues of L
∆
and L
′
∆
on all future subsets. Thus, the mul-
tipliers should be dynamic, changing with the data but
always within the expected behavior of that of subset
∆.
To estimate the multipliers, and thus, the upper
and lower control limits of all future data subsets, we
begin by calculating the residuals Ω of each subset s,
the same way we did for subset ∆. We then compute
the ratio, ρ, of the standard deviation of the residuals
in each subset s to the standard deviation of the resid-
uals of ∆ (which we named earlier Σ). The ratio is
illustrated in Eq.5. This ratio shows the deviation of
values in each subset, from the standard behavior.
ρ(s) =
std(Ω
s
)
Σ
(5)
The ratio ρ(s) is a measure of the variability in
subset s, normalized by Σ. This means ρ(s) scales the
deviation within the subset against the overall vari-
ability.
Intuitively, if the variation among the residuals is
low, then L
∆
, and L
′
∆
can be more fitting and there is
no reason for multiplying by ρ to compute the new
multipliers. On the other hand, a large variance in
the residuals suggest greater fluctuations, resulting in
larger multipliers. Thus, if ρ(s) is less than 1, this
means that the subset’ data behavior is close of that
of ∆, and thus, we use the original L
∆
, L
′
∆
of subset
∆ to compute the control limits of s. Otherwise, we
Anomaly Detection on Univariate Time Series Data Using Exponentially Weighted Moving Average (AnEWMA)
405

compute the multipliers of s as shown in Eq. 6. L
′
s
is
computed the same way.
L
s
=
(
L
∆
if ρ(s) < 1
L
∆
+ α · ρ(s), Otherwise
(6)
where α is a scaling factor set to 0.7. The value of α
is obtained by experience.
By multiplying α with the deviation term (ρ(s)),
we scale the control limits based on the observed vari-
ability. If the variability is higher (i.e., ρ(s) ≥ 1),
the scaling factor α can help ensure that the control
limits are not too tight, reducing the likelihood of
false alarms. A larger α increases the tolerance for
deviations from the mean, effectively increasing the
safety margin where data points are considered nor-
mal. Conversely, a smaller α narrows the control lim-
its, making the system more sensitive to deviations
and therefore more likely to flag anomalies.
We then use L
s
and L
′
s
to compute UCL
s
and LCL
s
as shown in Eq. 7.
UCL
s
=
¯
Γ + L
∆
· Σ, if ρ(s) < 1,
LCL
s
=
¯
Γ − L
∆
· Σ, if ρ(s) < 1,
UCL
s
=
¯
Γ + (L
∆
+ α · ρ(s)) · Σ, if ρ(s) ≥ 1,
LCL
s
=
¯
Γ − (L
∆
+ α · ρ(s)) · Σ, if ρ(s) ≥ 1.
(7)
6 THE DETECTION
ALGORITHM (AnEWMA)
To detect anomalies, we use the control limits we
computed earlier in Section 5. The idea is as follows:
for any subset, s, if a value in its residuals set Ω
s
is
greater than UCL
s
or less than LCL
s
, its correspond-
ing value x in the dataset is considered an anomaly.
In simpler terms, if a residual exceeds the predefined
control limits, it is highly likely that the data value in
the subset is abnormal.
We specify the size of each subset m to 350. This
value is decided upon after running the AnEWMA
prodigious number of times on multiple time series
datasets from various benchmarks. We found that
smaller subset sizes decrease the False Positives (FPs)
but increase the False Negatives (FNs). On the other
hand, larger subset sizes increase the FPs, but also de-
crease the FNs. Thus, we conclude that 350 is the
most appropriate trade-off between decreasing both
FPs and increasing FNs.
In addition, we set λ to 0.01. We choose a small
smoothing factor because when λ is close to 0, the
EWMA gives more weight to past values, resulting
in a smoother average that is less sensitive to recent
changes. Thus, the residuals show less variability and
be more stable over time, as it smooths out short-term
fluctuations.
Algorithm 1 shows the anomaly detection algo-
rithm AnEWMA.
Algorithm 1: Anomaly detection Based on EWMA
(AnEWMA).
Data: The time series dataset (x) of size n
Result: A: set of anomalies, initially A =
/
0
1 Compute the EWMA values for all x
2 Compute the residuals Γ of ∆
3 Compute L
∆
, L
′
∆
,UCL
∆
, and LCL
∆
4 Compute the residuals Ω
s
of all subsets
1 < s < k
5 Compute ρ(s) for all subsets s
6 Compute L
s
, L
′
s
,UCL
s
, and LCL
s
using ρ(s)
// Compute the anomalies for each
subset s
7 for s ← 1 to k do
8 for j ← 1 to m do
// for each value j ∈ s
9 if Ω
j
< LCL
s
| Ω
j
> UCLs then
10 A ← A ∪ {x
j
}
11 end
12 end
13 end
All steps in Algorithm 1 take a linear time to pro-
cess, including steps 7 and 8 since k · m = n, where
n is the size of the dataset. Therefore, the time com-
plexity of AnEWMA is O(n). We run AnEWMA on
multiple dataset input sizes and measure the time of
each run. The results confirm the linear complexity.
7 RESULTS
To evaluate AnEWMA, we use the coincidence ma-
trix shown in Table 1 and the following metrics:
Table 1: Coincidence Matrix.
Predicted Positive Predicted Negative
Actual Positive TP FN
Actual Negative FP TN
False Positives (FP) = FP (8)
False Negatives (FN) = FN (9)
True Positives (FP) = TP (10)
IoTBDS 2025 - 10th International Conference on Internet of Things, Big Data and Security
406
F1-score =
2 · Precision · Recall
Precision + Recall
(11)
Precision =
TP
TP + FP
(12)
Recall =
TP
TP + FN
(13)
We test AnEWMA on the Numenta and the Ya-
hoo A1 benchmarks, and we compare the results to
the state-of-art machine learning anomaly detection
algorithms.
7.1 Numenta Anomaly Benchmark
(NAB)
We run AnEWMA on the Real AWS CloudWatch
time series from the Numenta Anomaly Benchmark
(NAB). AWS CloudWatch provides detailed metrics
for monitoring the CPU utilization of your EC2 in-
stances (Ahmad et al., 2017).
Table 2 shows the F1-Score, the Precision and the
Recall values after running AnEWMA on the AWS
CloudWatch data series. In addition, Table 3 com-
pares AnEWMA to other state-of-art detection meth-
ods, including (Wang et al., 2011; D
¨
aubener et al.,
2019; Stanway, 2013; Adams and MacKay, 2007;
Munir et al., 2019; Lavin and Ahmad, 2015; Ahmad
et al., 2017; Maciag et al., 2019; Schneider et al.,
2016; Kejariwal, 2015).
Table 2: AnEWMA Performance Metrics.
NAB Benchmark F1-Score Precision Recall
Real AWS Cloud Watch 0.262 0.578 0.23
Table 3: F1-Score of AnEWMA and other Anomaly Detec-
tion Algorithms.
Anomaly Detection Algorithm F1-Score
Bayes Changepoint 0.006
EXPoSE 0.015
Gaussian Processes 0.5
Relative Entropy 0.018
Numenta 0.017
NumentaTM 0.018
Skyline 0.053
Twitter ADVec 0.013
DeepAnT 0.146
OeSNN-UAD 0.369
AnEWMA
⋆
0.262
As presented in Table 3, AnEWMA’ outperformed
seven other machine learning anomaly detection algo-
rithms.
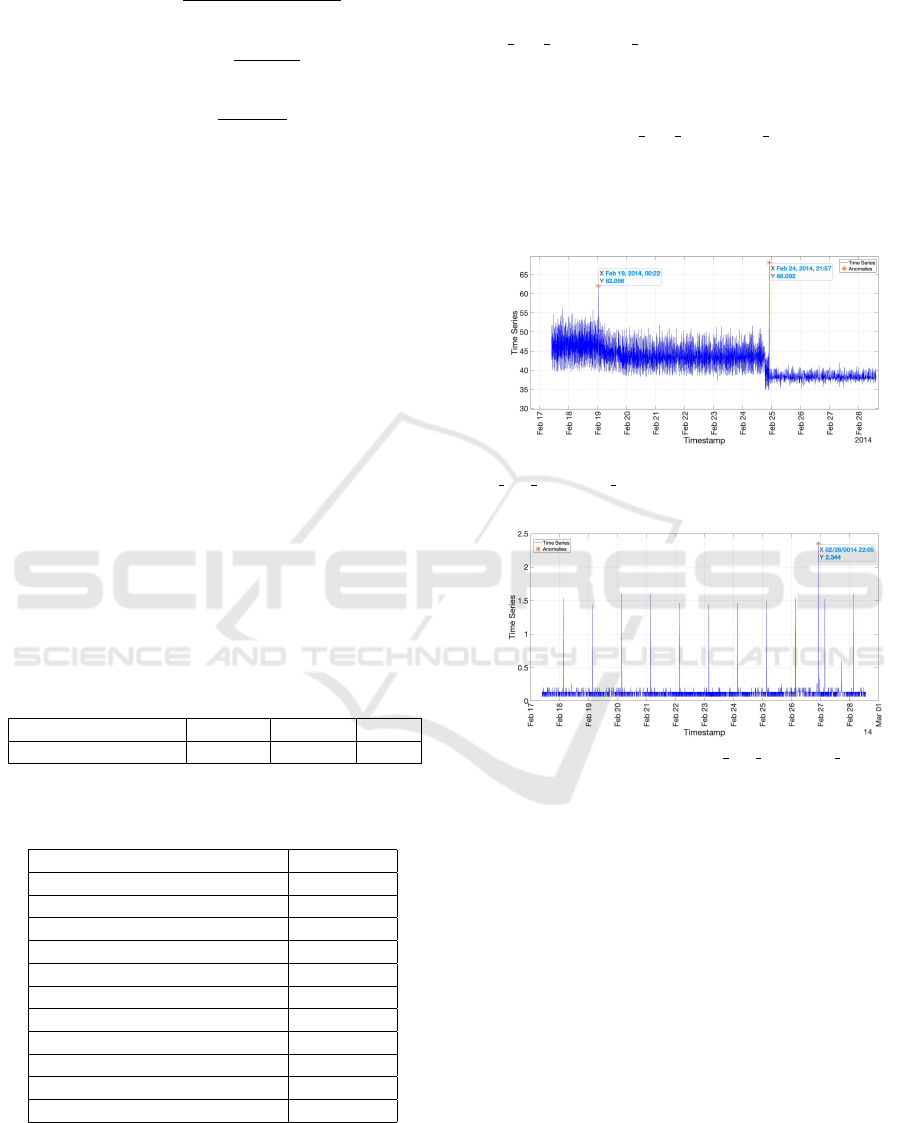
Here we include a few Figures showing
the performance of AnEWMA on a couple
of files from the Real AWS benchmark. File
’ec2 cpu utilization 5f5533.csv’ contains 2 anoma-
lies, one at time ’2014-02-19 00:22:00’, and the other
at time ’2014-02-24 18:37:00’. Figure 2 shows that
AnEWMA detects 1 anomaly but also returns 1 FP
and 1 FN. File ’ec2 cpu utilization 24ae8d.csv’ has
2 anomalies, at times ’2014-02-26 22:05:00’, and
’2014-02-27 17:15:00’. As presented in Figure in
3, AnEWMA detects only 1 anomaly but without
returning any FPs or FNs.
Figure 2: Flagged Anomalies in
ec2 cpu utilization 5f5533.
Figure 3: Flagged Anomaly in ec2 cpu utilization 24ae8d.
7.2 Yahoo Data Set
The Yahoo Webscope3 dataset (Webscope, 2015),
made available by Yahoo Labs, includes 367 real and
synthetic time series with point anomaly labels. Each
time-series comprises between 1,420 and 1,680 in-
stances. This anomaly detection benchmark is di-
vided into four sub-benchmarks: A1, A2, A3, and A4.
In this work, we use the A1 Benchmark. The dataset
contains 67 files featuring real-time series data. It
specifically contains real Yahoo membership login
data, tracking the aggregate status of logins on the
Yahoo network. Each file comprises three time se-
ries: timestamps, input values, and labels indicating
whether each input value is anomalous or not. We
note here that the anomaly column is not used in
this work. It is used just to check for accuracy of
AnEWMA.
Anomaly Detection on Univariate Time Series Data Using Exponentially Weighted Moving Average (AnEWMA)
407
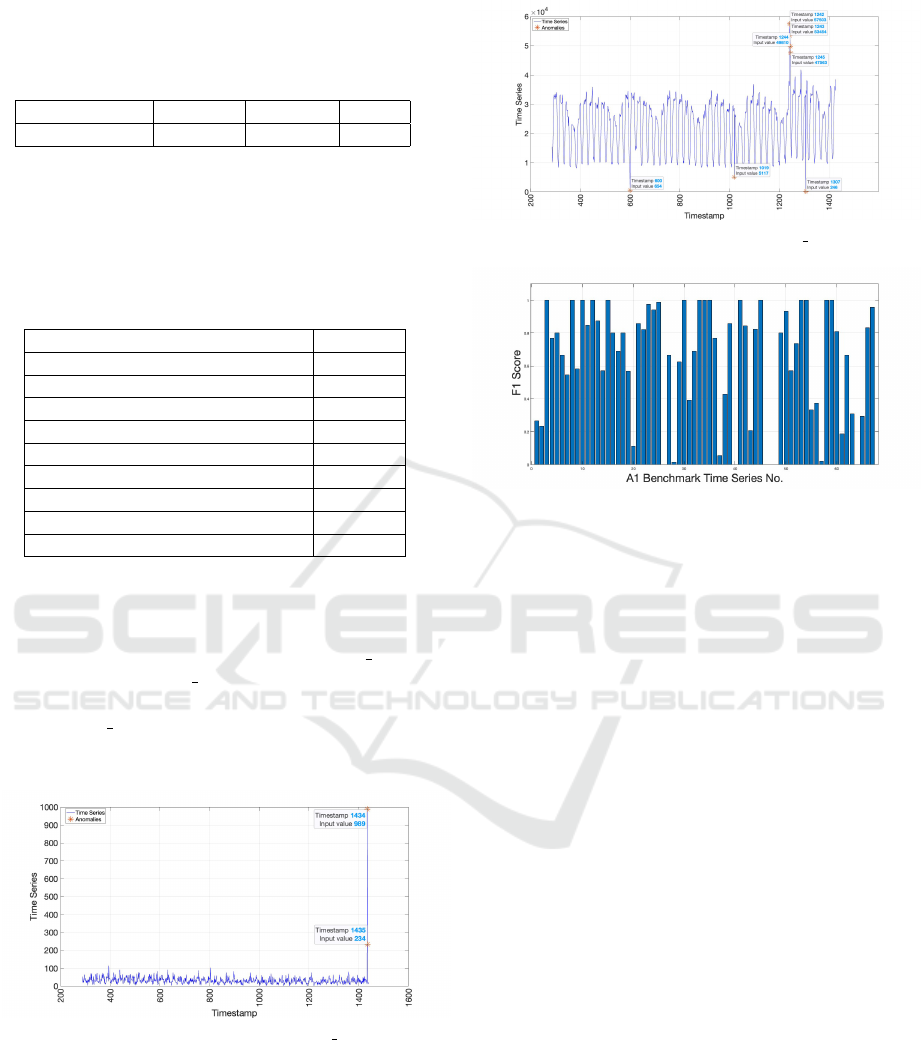
Table 4 summarizes the results when we run
AnEWMA on the Yahoo A1 Benchmark.
Table 4: AnEWMA on Yahoo A1 Benchmark.
Sub Benchmark F1-Score Precision Recall
A1 0.64 0.727 0.7
We also compare AnEWMA to other popular de-
tection algorithms including (Twitter, 2021; Munir
et al., 2019; Laptev et al., 2015; Thill et al., 2017;
Maciag et al., 2019; D
¨
aubener et al., 2019). Table 5
shows the results.
Table 5: F1-Score of Popular Detection Algorithms.
Anomaly Detection Algorithm F1-Score
Yahoo EGADS 0.47
Twitter Anomaly Detection (α = 0.1) 0.48
Twitter Anomaly Detection (α = 0.2) 0.47
DeepAnT(LSTM) 0.44
DeepAnT(CNN) 0.46
SORAD 0.67
OeSNN-UAD 0.7
Gaussian Processes 0.58
AnEWMA
⋆
0.64
Again, AnEWMA shows promising results com-
ing third among nine other detection algorithms.
Figures 4 and 5 show that AnEWMA is capable
of pinpointing the exact 2 anomalies in real 12 and
all 7 anomalies in real 34 datasets from the Yahoo
A1 sub-benchmark without any FPs or FNs. Inci-
dentally, real 12 dataset includes an anomaly in its ∆
but it didn’t impede AnEWMA from finding future
anomalies accurately.
Figure 4: Flagged Anomalies in real 12.
In addition, Figure 6 shows the F1-Score obtained
when we run AnEWMA for all 65 files in A1 sub-
benchmark.
Figure 5: Flagged Anomalies in real 34.
Figure 6: F1-Score for A1 Benchmark.
8 DISCUSSION AND
CONCLUSION
In this study, we have presented an Anomaly de-
tection algorithm based on Exponentially Weighted
Moving Average (AnEWMA), without resorting to
traditional machine learning methods. Our approach
leverages the simplicity and efficiency of the EWMA
technique to effectively identify anomalies in the data.
Most of the detection algorithms use a larger dataset
for training the data but AnEWMA used only 20% of
the earliest data to learn about the behavior of the data
values, and therefore, catching anomalies early.
Through experimentation, we have demonstrated
the capability of AnEWMA to reasonably detect
anomalies in various datasets. By utilizing the
inherent properties of EWMA, we have achieved
promising results, showcasing the algorithm’s ro-
bustness and adaptability across different scenarios.
AnEWMA stands out against other machine learning
algorithms in terms of simplicity, low computation
time, efficiency and accuracy.
We recognize that AnEWMA performance is in-
fluenced by two key parameters: the scaling factor α
and the subset size m. It takes a careful tuning for
better results and advanced work to find the optimum
results. Nevertheless, once these parameters are de-
termined, AnEWMA is straightforward to implement
and apply.
Moving forward, further research will focus
IoTBDS 2025 - 10th International Conference on Internet of Things, Big Data and Security
408

on exploring the optimization and refinement of
AnEWMA, as well as its application in real-world set-
tings across diverse domains.
In conclusion, our study highlights the effective-
ness of the EWMA based algorithm as a valuable tool
for anomaly detection, offering a straightforward yet
powerful solution that can be readily deployed in var-
ious practical applications.
REFERENCES
Adams, R. P. and MacKay, D. J. (2007). Bayesian
online changepoint detection. arXiv preprint
arXiv:0710.3742.
Ahmad, S., Lavin, A., Purdy, S., and Agha, Z. (2017). Un-
supervised real-time anomaly detection for streaming
data. Neurocomputing, 262:134–147. Online Real-
Time Learning Strategies for Data Streams.
Bl
´
azquez-Garc
´
ıa, A., Conde, A., Mori, U., and Lozano,
J. A. (2021). A review on outlier/anomaly detection
in time series data. 54(3).
Borror, C., Montgomery, D., and Runger, G. (1999). Ro-
bustness of the ewma control chart to non-normality.
Journal of Quality Technology, 31(3):309–316.
Braei, M. and Wagner, S. (2020). Anomaly detection in
univariate time-series: A survey on the state-of-the-
art. ArXiv.
D
¨
aubener, S., Schmitt, S., Wang, H., Krause, P., and B
¨
ack,
T. (2019). Anomaly detection in univariate time se-
ries: An empirical comparison of machine learning
algorithms. In Industrial Conference on Data Mining.
Kejariwal, A. (2015). Introducing practical and robust
anomaly detection in a time series. Twitter Engineer-
ing Blog. Web, 15.
Laptev, N., Amizadeh, S., and Flint, I. (2015). Generic
and scalable framework for automated time-series
anomaly detection. page 1939–1947.
Lavin, A. and Ahmad, S. (2015). Evaluating real-
time anomaly detection algorithms – the numenta
anomaly benchmark. In 2015 IEEE 14th International
Conference on Machine Learning and Applications
(ICMLA). IEEE.
Lucas, J. M. and Saccucci, M. S. (1990). Exponentially
weighted moving average control schemes: Properties
and enhancements. Technometrics, 32(1):1–12.
Maciag, P. S., Kryszkiewicz, M., Bembenik, R., Lobo, J. L.,
and Ser, J. D. (2019). Unsupervised anomaly detec-
tion in stream data with online evolving spiking neural
networks. Neural networks : the official journal of the
International Neural Network Society, 139:118–139.
Mejri, N., Lopez-Fuentes, L., Roy, K., Chernakov, P.,
Ghorbel, E., and Aouada, D. (2024). Unsupervised
anomaly detection in time-series: An extensive evalu-
ation and analysis of state-of-the-art methods. Expert
Systems with Applications, 256:124922.
Munir, M., Siddiqui, S. A., Dengel, A., and Ahmed, S.
(2019). Deepant: A deep learning approach for un-
supervised anomaly detection in time series. IEEE
Access, 7:1991–2005.
Schneider, M., Ertel, W., and Ramos, F. (2016). Expected
similarity estimation for large-scale batch and stream-
ing anomaly detection. Machine Learning, 105:305–
333.
Stanway, A. (2013). Etsy skyline. Online Code Repos.
Thill, M., Konen, W., and B
¨
ack, T. (2017). Online anomaly
detection on the webscope s5 dataset: A comparative
study. In 2017 Evolving and Adaptive Intelligent Sys-
tems (EAIS), pages 1–8.
Twitter (2021). Twitter ad.
Wang, C., Viswanathan, K., Choudur, L., Talwar, V., Sat-
terfield, W., and Schwan, K. (2011). Statistical tech-
niques for online anomaly detection in data centers.
In 12th IFIP/IEEE international symposium on in-
tegrated network management (IM 2011) and work-
shops, pages 385–392. IEEE.
Webscope, Y. (2015). Labeled anomaly detection dataset-v.
1.0.
Anomaly Detection on Univariate Time Series Data Using Exponentially Weighted Moving Average (AnEWMA)
409
