
Digital Touchpoints: Generating Synthetic Data for Elderly Smartphone
Interactions
Bilal Maqbool
a
and Sebastian Herold
b
Department of Mathematics and Computer Science, Faculty of Health, Science and Technology, Karlstad University,
Karlstad, Sweden
{bilal.maqbool, sebastian.herold}@kau.se
Keywords:
Usability Evaluation (UE), Accessibility, Elderly, Older Adult (OA), Synthetic Data Generation (SDG),
Machine Learning.
Abstract:
Context: Ensuring smartphone interfaces are usable and accessible is essential for elderly users, particularly
those with motor impairments, who face challenges with touchscreen interactions. Problem: Hand tremors
and limited motor control can hinder touchscreen accuracy and efficiency. Meanwhile, recruiting elderly par-
ticipants for usability studies can be challenging, often resulting in limited interaction data. Objectives: This
study aimed to investigate elderly users’ smartphone interaction patterns, identify key challenges, and gen-
erate synthetic data to address data scarcity for usability research. Method: A custom-designed mobile app
collected interaction data from 51 elderly participants performing tapping, dragging, and tracing tasks. Hand
steadiness was assessed using accelerometer data. Gaussian Process Regression (GPR) and Long Short-Term
Memory (LSTM) models were used to generate synthetic datasets replicating user interaction patterns. Re-
sults: Users with shaky hands struggled with precision tasks, especially involving smaller GUI elements, while
larger elements improved performance. Continuous control was also found to be challenging in tracing tasks.
Synthetic datasets successfully replicated spatial, temporal, and distributional metrics, demonstrating potential
utility in future usability evaluation research. Conclusions: Inclusive GUI designs and adaptive features can
improve accessibility for the elderly with limited motor control. Synthetic data can offer a potential solution
for further usability evaluation research in building AI-driven design evaluation tools, reducing reliance on
resource-intensive participant recruitment in earlier prototypes. Future work should examine diverse tasks and
scenarios and involve people with severe motor impairments.
1 INTRODUCTION
Ensuring usability and accessibility in digital systems
is essential to effective technology design. Although
closely related, these concepts focus on distinct yet
complementary aspects (Wegge and Zimmermann,
2007). Usability emphasizes efficiency, effectiveness,
and user satisfaction, often considering baseline phys-
ical and cognitive abilities. Accessibility expands this
perspective by designing systems to be inclusive, ac-
commodating equitable and diverse needs, including
users with varying disabilities. Integrating accessibil-
ity into the design process can ensure that the majority
of user groups can benefit without requiring signifi-
cant adaptations or retrofits.
Usability and accessibility are crucial aspects
in digital healthcare (DH), directly influencing user
a
https://orcid.org/0000-0002-1309-2413
b
https://orcid.org/0000-0002-3180-9182
engagement and digital health interventions suc-
cess (Shamsujjoha et al., 2021). Poor usability in
electronic health records (EHRs) has been linked to
serious errors, such as inappropriate drug administra-
tion, highlighting the risks of complex interface de-
sign (Pew Trusts, 2019). A study of 9,000 DH tech-
related safety reports found that usability issues con-
tributed to nearly one-third of reported errors, high-
lighting the pressing need for improved system de-
signs (Ratwani et al., 2018). Furthermore, research
suggests that businesses, including those in health-
care, achieve better outcomes by prioritizing usability
and design (Sheppard et al., 2018).
Smartphone usage is common in Europe, with
65–68% of individuals over 65 in the UK and Ger-
many, respectively, owning a smartphone (O’Dea,
2021; Davies, 2024). The widespread availabil-
ity of health-related mobile applications, exceeding
100,000 as of 2022, highlights the growing role of
126
Maqbool, B. and Herold, S.
Digital Touchpoints: Generating Synthetic Data for Elderly Smartphone Interactions.
DOI: 10.5220/0013439200003938
Paper published under CC license (CC BY-NC-ND 4.0)
In Proceedings of the 11th International Conference on Information and Communication Technologies for Ageing Well and e-Health (ICT4AWE 2025), pages 126-140
ISBN: 978-989-758-743-6; ISSN: 2184-4984
Proceedings Copyright © 2025 by SCITEPRESS – Science and Technology Publications, Lda.

technology in health management (Butcher and Hus-
sain, 2022). However, DH applications often fail
to address key human-centric factors such as usabil-
ity and accessibility, resulting in ineffective solu-
tions that exclude critical user groups, such as older
adults and individuals with disabilities (Shamsujjoha
et al., 2021). Older adults, in particular, face dif-
ficulties with touchscreen technologies due to chal-
lenges such as small interface elements and tasks re-
quiring precision or speed, leading to frustration and
unintended inputs (Maqbool and Herold, 2024; Joshi,
2018; Elboim-Gabyzon et al., 2021). These issues,
often associated with age-related physical limitations
like reduced motor control, emphasize the importance
of tailored designs that could accommodate their spe-
cific needs (Maqbool and Herold, 2024; Joshi, 2018).
Despite its importance, recruiting the elderly for
usability evaluations remains challenging, particu-
larly among those with motor or cognitive impair-
ments, leading to small, non-representative sam-
ple sizes that can limit the generalizability of find-
ings (Maqbool and Herold, 2024; Sinabell and Am-
menwerth, 2024). Studies have also reported dif-
ficulties in retaining participant involvement due to
accessibility barriers, health constraints, and logis-
tical issues, further complicating data collection ef-
forts (Maqbool and Herold, 2024).
User interface (UI) Interaction data from usability
and accessibility studies can offer valuable insights
into how users, particularly those with physical dis-
abilities, interact with technology. Despite its poten-
tial, this data is rarely reused, resulting in repeated
collection efforts and inefficient resource use (Jiang
et al., 2024). The use of interaction data for user im-
itation modeling, which simulates scenarios such as
individuals with shaky hands interacting with touch-
screens, can help researchers evaluate design alterna-
tives and accessibility features (Maqbool et al., 2024).
This approach can optimize the use of existing inter-
action datasets and minimize the need for resource-
intensive recruitment efforts.
However, despite its potential, a key challenge
lies in the limited size of datasets typically produced
by usability and accessibility studies, which con-
strains the training of machine learning models re-
quired for robust simulation-based user models. Syn-
thetic data generation has emerged as a promising so-
lution to data scarcity, allowing researchers to repli-
cate the properties of limited datasets and increase
their size (Maqbool et al., 2024). Furthermore, it
can facilitate the training of accessibility-focused ma-
chine/imitation learning models.
Generating high-quality synthetic data demands
careful modeling of the unique interaction behaviors
exhibited by elderly users, particularly those with
motor impairments, to ensure fidelity and usability.
Therefore, in this paper, our goal is to collect smart-
phone UI interaction data from elderly users using
a custom-designed mobile application, focused on
touchscreen tasks such as tapping, dragging, and trac-
ing to analyze user interaction patterns. The col-
lected data will support the generation of synthetic
datasets using machine learning techniques to miti-
gate the scarcity of user interaction data. Further-
more, the fidelity of the synthetic data will be evalu-
ated for reliability and applicability in developing AI-
driven design evaluation tools. To guide this work, we
formulated the following research questions:
• RQ.1: What interaction patterns are exhibited by
elderly users during smartphone interaction tasks?
• RQ.2: How effectively can the synthetic data
replicate the observed interaction patterns of el-
derly users?
The structure of the paper is as follows: Section 2
reviews the existing literature; Section 3 details the re-
search methodology; Section 4 presents the findings;
Section 5 discusses the results, their implications, and
potential threats to validity; and Section 6 concludes
the paper, highlighting future research directions.
2 LITERATURE REVIEW
This literature review explores the challenges faced
by elderly users in interacting with touchscreen in-
terfaces and the role of synthetic data generation in
addressing data scarcity.
2.1 Motor Skill Limitations and
Accessibility Challenges
The increasing reliance on smartphones in daily life
has emphasized the need to address accessibility chal-
lenges for elderly users, as age-related declines in
motor skills, such as dexterity, can significantly af-
fect their ability to use touchscreen technology effec-
tively, which is often not designed with their needs
in mind. This misalignment causes frustration, higher
error rates, slower responses, and often leads to dis-
engagement from technology (Nicolau et al., 2014;
Joshi, 2018; Nurgalieva et al., 2019).
Tapping, a fundamental smartphone interaction,
can be challenging for elderly users, especially those
with shaky hands. Hwangbo et al. found that smaller
targets and closely spaced icons increase error rates
and slow interaction times for elderly, recommending
larger touch targets and adequate spacing (Hwangbo
Digital Touchpoints: Generating Synthetic Data for Elderly Smartphone Interactions
127

et al., 2013). Additionally, Shao et al. observed that
right-handed elderly users often deviate to the right
when tapping, a tendency intensified by hand tremors,
and proposed offset models for automatic correction
to improve accuracy and reduce input errors (Shao
et al., 2023).
Dragging gestures, requiring precision and fine
motor control, are particularly challenging for el-
derly users, especially those with hand tremors.
Salman et al. highlighted the difficulty elderly face
with drag-and-drop interactions, recommending task
simplification or alternative methods (Salman et al.,
2019). Shao et al. noted that elderly users often
adopt a two-phase strategy: an initial movement to-
ward the target, followed by a calibration phase for
re-positioning (Shao et al., 2023). While effective,
this approach increases interaction time and cognitive
load, emphasizing the need for interfaces that mini-
mize precision demands.
Gestures requiring fine motor skills, such as
pinch-to-zoom, pose significant challenges for el-
derly. Brunzini et al. found that while tapping had the
highest success rates, complex gestures like drag-and-
drop and pinch-to-zoom were notably harder for indi-
viduals with systemic sclerosis (SSc) (Brunzini et al.,
2022). The study stressed the importance of adap-
tive designs tailored to specific motor impairments
and the role of prior technology familiarity in user
performance. Salman et al. further stressed the im-
portance of reducing gesture complexity to accom-
modate motor impairments, suggesting that simplified
layouts and alternative interaction methods could sig-
nificantly improve accessibility (Salman et al., 2019).
Nicolau et al. also identified tapping as the most
effective method for motor-impaired users but with
difficulties around the button edges and corners, rec-
ommending larger target sizes (Nicolau et al., 2014).
Similarly, Kobayashi et al. found that while prac-
tice improved user performance in tasks like tapping,
dragging, and pinching, persistent challenges such as
small target sizes and unclear instructions highlighted
the need for interfaces with larger, well-defined tar-
gets and simplified navigation structures (Kobayashi
et al., 2011).
A design framework for smartphone user inter-
faces tailored to elderly users emphasizes the need
for simplified layouts, larger icons, and customizable
settings to accommodate individual preferences and
abilities (Salman et al., 2023). Moreover, studies also
point to difficulties faced by the elderly with moving
targets, text entry on virtual keyboards, and dynamic
elements like scrolling text, underscoring the need for
intuitive and accessible input methods (Elguera Paez
and Zapata Del R
´
ıo, 2019).
2.2 Synthetic Data Generation (SDG)
The generation of synthetic time series data is a chal-
lenging yet has become increasingly crucial across di-
verse fields, from healthcare (Jamshidi et al., 2024) to
finance (Ranja et al., 2023). The growing use of data-
driven methods, privacy concerns about real-world
data, and the high costs and complexity of data acqui-
sition are some factors driving this demand. Gener-
ating synthetic sensor data is commonly achieved us-
ing Generative Adversarial Networks (GANs). These
networks include a generator, which generates syn-
thetic data based on real datasets, and a discrimina-
tor, which evaluates the data to identify whether it is
real or generated (Islam et al., 2022). TimeGANs are
a specialized form of GANs designed to capture the
temporal dependencies in time series data, which tra-
ditional GANs often fail to address adequately. This
is achieved by incorporating a seq2seq style adversar-
ial autoencoder that ensures the temporal distribution
of synthetic samples does not collapse (Yoon et al.,
2019; Beck and Chakraborty, 2024).
The DoppelGANger (DGANs) model, another
specialized GANs, is designed to handle the unique
challenges of complex time series data, such as long-
term temporal correlations (Lin et al., 2020). The
model leverages GANs to generate data, ensuring
that the synthetic data closely resembles training data
in terms of both temporal and feature characteristics
Lin et al. demonstrated the efficacy of DGANs in gen-
erating synthetic network traffic data, capturing struc-
tural properties, and achieving up to 43% better fi-
delity than baseline methods (Lin et al., 2020). Dan-
nels utilized DGANs to generate synthetic time series
with associated recession indicators (Dannels, 2023).
The study showed that training forecasting models on
synthetic data improved short-range forecasting per-
formance for Treasury yields and enhanced the mod-
els’ ability to predict future recessions.
Gaussian Process Regression (GPR) is an-
other prominent method for generating synthetic
data (Schulz et al., 2018). GPR is a non-parametric
method, offering a means to quantify uncertainty in
predictions, which is critical for noisy or incomplete
real-world datasets. GPR defines a distribution over
functions, allowing synthetic data generation by sam-
pling from this distribution. Susiluoto et al. devel-
oped the satGP software, using GPR to generate syn-
thetic datasets from satellite observations by model-
ing the spatial and temporal dependencies in environ-
mental data for testing and validating predictive mod-
els (Susiluoto et al., 2020). In machine learning, GPR
has been used to generate synthetic datasets for eval-
uating algorithm performance under controlled con-
ICT4AWE 2025 - 11th International Conference on Information and Communication Technologies for Ageing Well and e-Health
128

ditions (Stephenson et al., 2022). By simulating data
with known properties, researchers can assess model
robustness and accuracy, supporting the development
of reliable and generalizable outcomes.
Long Short-Term Memory (LSTM) networks,
a type of recurrent neural network (RNN), are
also instrumental in generating synthetic time series
data (Hochreiter, 1997). LSTMs excel at capturing
long-term dependencies within sequential data, mak-
ing them suitable for tasks that require an under-
standing of temporal dynamics. Schwarz’s study uses
LSTM to generate a synthetic financial time series
that closely represents the real market data’s probabil-
ity distributions (Schwarz, 2024). Notably, the model
outperforms traditional methods in non-linear scenar-
ios, offering robust applications in risk management,
scenario analysis, and trading strategy development.
Despite the growing importance of synthetic data
generation to address data scarcity, its application to
smartphone interaction data for elderly users remains
under-explored. This gap is particularly critical given
the need for inclusive technology design and the prob-
lems highlighted in Section 1. Building on our previ-
ous work (Maqbool et al., 2024), which focused on
generating synthetic drag-and-drop interaction data,
this study expands its scope to include elderly users
with shaky hands. It also includes additional interac-
tion tasks, such as tapping and tracing, to better sim-
ulate the range of motor control challenges faced by
this population.
3 METHODOLOGY
3.1 Target Population and Recruitment
Strategy
The study involved elderly participants aged 65 and
above, recruited through opportunistic sampling. Re-
cruitment relied on private and professional networks
to ensure access to this demographic, which is often
challenging to reach in research.
3.2 Questionnaire and Observation
At the start of the study, participants were asked a
structured questionnaire designed to collect demo-
graphic information and details about smartphone
usage habits. Participants’ smartphone interactions
were observed while performing tasks, focusing on
how they held and used the device. This observational
data complemented the questionnaire and offered in-
sights into interaction patterns.
3.3 Task 0: Hand Steadiness
Assessment
Participants completed a hand steadiness calibration
task to measure hand stability before starting the
smartphone interaction tasks. They sat on a chair,
placed the smartphone flat on their palm with the
screen facing up, and were instructed to lift their
arm to chest level, holding the phone steady for 10
seconds with each hand. Hand movement/shakiness
was recorded using the smartphone’s built-in ac-
celerometer sensor, providing an objective measure-
ment (Polvorinos-Fern
´
andez et al., 2024). The ac-
celerometer sensor recorded three-dimensional (x, y,
z) acceleration data during this task.
Participants were categorized into two groups
based on the steadiness of their dominant hand during
calibration: those with minimal shakiness and those
with noticeable hand shakiness. The terms “shaky”
and “non-shaky” in this study do not indicate med-
ically diagnosed tremor-related conditions or severe
motor impairments, but instead reflect a comparative
difference in relative hand stability among partici-
pants.
Accelerometer data was preprocessed by trans-
forming three-dimensional acceleration into a scalar
magnitude using the Euclidean norm, preserving key
movement characteristics while simplifying the data.
Preprocessing also included outlier and noise re-
moval, data normalization, aligning timestamps to a
uniform interval, and resampling data points to ad-
dress sampling inconsistencies. A Butterworth Band-
Pass Filter (0.5–10 Hz) was applied to isolate hand
movement and shakiness frequencies while reducing
any potential sensor drift and data noise (Polvorinos-
Fern
´
andez et al., 2024). Finally, Gaussian smoothing
was used to refine the signal for analysis.
Power Spectral Density (PSD) was used to ex-
tract frequency-domain features, focusing on the
3.5–7.5 Hz band, which corresponds to hand shaki-
ness frequencies during postural activities (Hess and
Pullman, 2012; Heida et al., 2013). Statistical fea-
tures within this frequency band and acceleration
summed magnitudes were derived from the filtered
data. Participants were clustered using a threshold-
based method, where higher summed magnitudes and
frequencies within the specified band helped to iden-
tify “shaky” participants. K-Means clustering fur-
ther validated the “shaky” and “non-shaky” clusters
by grouping participants based on the extracted fea-
tures, ensuring the method’s robustness.
Digital Touchpoints: Generating Synthetic Data for Elderly Smartphone Interactions
129

3.4 Graphical User Interface (GUI)
Interaction Tasks
Participants engaged in a series of UI interaction
tasks using a custom-designed smartphone applica-
tion. These tasks were designed to assess common
touchscreen actions and various aspects of user inter-
action, including speed (time taken for each action),
accuracy (touch-points and tapping precision), preci-
sion (drag/tracing movements and control in position-
ing), and the number of attempts required to complete
each task.
1. Task 1: Participants tapped on a square button
of three sizes (48, 56, and 64 dp), randomly dis-
played on the screen locations. Each size ap-
peared 11 times, total 33 taps.
2. Task 2: Participants dragged a square button
(56 dp) from a starting position to a target box
(84 dp) that appeared randomly on the screen, re-
peated 11 times.
3. Task 3: Participants traced lines along the edges
of a square box, either once or several times.
3.5 Synthetic Data Generation
Building on the data collected and analyzed, this
phase focused on generating synthetic user interac-
tion data. We explored other GAN-based models
such as TIMEGANs and ACTGANs to assess their
potential for generating synthetic data. In our previ-
ous work, we used DoppelGANger (DGANs) to gen-
erate synthetic drag-and-drop interaction data (Maq-
bool et al., 2024). While DGANs demonstrated good
results, their computational demands limit practical
scalability, prompting this research to explore GPR
and LSTM models, considering comparative resource
efficiency and the required model complexity for gen-
erating synthetic data.
To generate synthetic data for Task 1, we em-
ployed GPR to model user taps on three square button
sizes. The GPR was trained on continues displace-
ment from the target center (Dx, Dy), timestamp data,
and encoded categorical features such as target size
and button location on the grid. The GPR kernel was
carefully constructed and fine-tuned to model various
aspects of the data. The GPR kernel combined four
components. A Constant Kernel (C) was initialized
at 2.0 with bounds [10
−6
, 10
6
] to control the over-
all scale. An RBF Kernel for smooth relationships
and a Matern Kernel to account for less smooth varia-
tions. The RBF and Matern kernels had initial length
scales of 1.0, with bounds [10
−4
, 10
4
] and [10
−4
, 10
3
],
respectively. A White Kernel was initialized with a
noise level of 10
−5
and bounds [10
−9
, 10
9
], ensuring
adaptability to varying noise levels. The GPR ker-
nel was optimized iteratively for best-fit parameters.
A regularization term α = 0.1 was added to prevent
overfitting and ensure robust predictions.
Feature preparation involved one-hot encoding
for categorical variables and scaling for continuous
variables to ensure standardization. The input ma-
trix combined these processed features into a unified
dataset for training. The GPR model optimization was
performed with the fmin l bfgs b optimizer, using
10 restarts to avoid local minima and allowing up to
1,000 iterations for effective convergence. Synthetic
taps were generated by sampling from the trained
GPR models, capturing realistic spatial and temporal
tap patterns and variability observed in the original
data.
To generate synthetic data for Task 2 and Task 3,
we first preprocessed the dataset by removing outliers.
For Task 2, time series exceeding the fourth quartile
(Q4) in length were excluded to avoid skewing the
training process. For both tasks, the time series were
interpolated and resampled to ensure consistent se-
quence lengths across users, simplifying model train-
ing and ensuring uniform input data. To standardize
drag directions, Task 2 paths were preprocessed to
start from the top-right grid position relative to the tar-
get center, while Task 3 paths were aligned clockwise,
starting from the top-right corner. These adjustments
facilitated easier learning of patterns and ensured that
the trained model generalizes better, considering lim-
ited training data.
A bidirectional LSTM model was trained to pre-
dict drag and tracing paths based on timestamps,
capturing temporal correlations. Input data passed
through a bidirectional LSTM layer with dropout
and regularization to mitigate overfitting, followed
by a Dense output layer to predict numeric coordi-
nates while preserving temporal correlations. The
model compiled using Adam optimizer (learning rate:
0.0005) and was trained for 30 and 40 epochs with a
batch size of 8 and 20 for Task 2 and Task 3, respec-
tively. Early stopping and best-performing weights
ensured optimal performance. A custom callback
monitored the Mean Squared Error (MSE) loss and
the Mean Absolute Error (MAE) metric, ensuring ro-
bust model convergence.
Post-processing involved applying Exponential
Moving Average (EMA) smoothing to reduce noise
while preserving overall trends. Generated time
series were evaluated by comparing their distribu-
tions with the original data, using statistical mea-
sures (mean, std, etc.), Wasserstein distances (WD),
Jensen–Shannon distances (JSD), and qualitative as-
ICT4AWE 2025 - 11th International Conference on Information and Communication Technologies for Ageing Well and e-Health
130

sessments to analyze generated synthetic data and
model fidelity (Stenger et al., 2024).
For Wasserstein Distance (WD) we compared nor-
malized (MinMaxScaler(-1, 1)) each synthetic time
series with all original time series. WD was calcu-
lated using optimal transport theory to determine the
minimum “cost” of transforming the synthetic distri-
bution into the original, with probability distributions
weights based on each value’s magnitude determined
its relative importance and proportional to drag/trace
paths. Each synthetic series was matched to the clos-
est original series by finding the smallest WD.
For Jensen-Shannon (JS) Distance, synthetic and
original time series values were binned into 50 equal-
sized bins, and the JS Distance was computed as
the square root of the average Kullback-Leibler (KL)
divergence between distributions. This symmetric,
bounded similarity measure (0 to 1) identified the
closest original series for each synthetic series by
minimizing JS distance.
3.6 Ethical Compliance
We applied the Etikpr
¨
ovningsmyndigheten (EPM) -
(Dnr 2024-03934-01) to ensure ethical compliance.
The EPM has determined that our project is not sub-
ject to ethics review as it does not involve any inter-
ventions on research subjects or processing of per-
sonal data as defined under Sections 3-4 of the Ethical
Review Act. Additionally, the Ethical Review Au-
thority has provided an advisory opinion stating that
there are no ethical objections to our research project.
Furthermore, participation in the study was volun-
tary and reporting was anonymous. Participants could
proceed upon reading the study information, getting
informed about their rights, and giving their consent.
4 RESULTS
4.1 Participants’ Information
A total of 51 elderly individuals from Sweden (25),
Pakistan (19), Italy (5), and Germany (2) participated
in the study. Based on the hand steadiness assessment
(described in Sec. 3.3), 21 participants were identi-
fied as having higher levels of hand shakiness. Par-
ticipants were clustered into two groups using cut-
off thresholds determined by the midpoint between
k-means centroids from PSD analysis and summed
magnitude of acceleration. Participants were labeled
as “shaky” if the % of power in the 3.5–7.5 Hz fre-
quency band exceeded 22% and the summed magni-
tude of acceleration (Euclidean norm) was higher than
150.
Of the 21 participants, most were aged 65–69,
comprising 7 males (33%) and 2 females (10%). In
the 70–74 age group, there were 4 males (19%) and
4 females (19%), while the 80–84 group included 2
males (10%) and 2 females (10%).
Among 21 elderly with shaky hands, 9 used smart-
phones multiple times a day (8 males, 38%; 1 female,
4.8%). Another 10 used smartphones a few times
a day (5 males and 5 females, each 24%), while 2
females (10%) reported a few times a week usage.
These results indicate most participants use smart-
phones daily, with usage varying between frequent
and moderate levels.
During Task 1, 16 participants held the smart-
phone in their left hand and interacted using their
right-hand fingers, 4 reversed this style, and 1 used
both hands for holding and both thumbs for interac-
tion. This interaction style remained consistent across
Tasks 2 and 3.
4.2 Graphical User Interface (GUI)
Interaction
4.2.1 Task 1
In general, for Task 1, the results showed that larger
button sizes (i.e., 56 dp and 64 dp) were associated
with slightly lower average tap durations compared
to 48 dp, and fewer repeated attempts—particularly
among shaky participants.
Tap Duration: Shaky and non-shaky partici-
pants had almost similar tap durations across all but-
ton sizes, with a mean of 1356 ms for shaky (ap-
prox. 7.6% longer) and 1260 ms for non-shaky. This
suggests that while shaky participants took slightly
longer on average to complete taps, they might also
exhibit comparatively different tap behaviors (e.g.,
more misses or corrections).
Participants with shaky hands were further ana-
lyzed based on changes in velocity between the first
and second halves of the tapping task. The analy-
sis revealed that 19 participants had an increase in
average velocity in the second half (average 32%,
ranging between 10%-116%), suggesting familiar-
ity/adaptation to the task over time or improved motor
control. One participant maintained similar velocities
across both halves, reflecting consistent performance
throughout the task. In contrast, only one participant
had a decrease in velocity (8%) in the second half,
possibly due to fatigue, loss of focus, or reduced mo-
tor control as the session progressed.
Number of Attempts: The average number of at-
Digital Touchpoints: Generating Synthetic Data for Elderly Smartphone Interactions
131

Figure 1: Tap heatmaps for shaky vs. non-shaky partici-
pants.
tempts highlights the relationship between speed and
accuracy. Shaky participants took more attempts, es-
pecially on smaller button sizes. At 48 dp, shaky
participants averaged 2.2 attempts, 83% higher than
1.2 among non-shaky participants. As button size in-
creased to 56 dp and 64 dp, the shaky group’s mean
attempts dropped to 1.2 and 1.1, respectively. Overall,
shaky participants required more attempts (1.6) across
all button sizes than non-shaky participants (1.1), sug-
gesting higher difficulty in achieving a successful tap
on the first try, particularly for smaller targets.
Tap Accuracy: For square buttons of widths 48,
56, and 64 dp, we assessed how often shaky hands
participants’ taps were scattered away from the tar-
get center location (Fig .1) and landed outside the tar-
get area. For 48 dp, shaky participants had roughly
40% of taps outside, compared to about 13% for
non-shaky. This gap became smaller as the button
size increased: for 56 dp and 64 dp, shaky partici-
pants’ outside-tap proportion dropped to about 16%
and 10% as compared to 10% and 6% for non-shaky
participants, respectively. This possibly reflects that
bigger target areas can reduce the impact of hand
shakiness. Overall, across all sizes, shaky participants
still registered a higher mean proportion of taps out-
side (25%) than non-shaky (10%).
Participants with shaky hands had higher average
tap deviations (distance) from the target button center
compared to non-shaky participants: 57 px (79%) vs.
43 px (58%) for 48 dp, 51 px (61%) vs. 46 px (55%)
for 56 dp, and 50 px (52%) vs. 45 px (49%) for
64 dp, with higher percentages indicating poorer pre-
cision. While the tap rate inside the button improved
for shaky participants with larger button sizes, the tap
distance increased, possibly due to inconsistent con-
trol over larger tap ranges.
The on-screen buttons were categorized based on
their positions within a 3x2 UI grid layout, con-
sisting of three rows (top, middle, bottom) and two
columns (left, right) for shaky participants’ accessi-
bility analysis. This division provided a structured
framework to analyze button appearances and interac-
tions across distinct screen regions. For small buttons,
the Top-Right grid was most challenging, with 37% of
taps outside boundaries. Medium-sized buttons im-
proved accuracy across most locations, with Bottom-
Left and Top-Right grids showing 19% and 16% of
taps outside boundaries, respectively. Larger buttons
achieved over 90% accuracy (taps inside) in most po-
sitions, demonstrating ease of use. Notably, Top-
Right reached 100% accuracy, while Bottom-Left had
92%.
In summary, participants with shaky hands tends
to tap almost the same as non-shaky participants but
were less accurate (higher outside rate for smaller but-
tons). As button size increases from 48 dp to 64 dp,
both groups see improvements in accuracy (fewer out-
side taps) and require fewer attempts overall, indicat-
ing that larger targets help accommodate user vari-
ability, particularly for those with hand shakiness.
4.2.2 Task 2
Analysis of the dragging task revealed underlying dif-
ferences in performance between participants with
shaky and non-shaky hands when interacting with a
56 dp button and dropping it into an 84 dp target. Al-
though the mean drag duration for shaky participants
was approximately 1435 ms, compared to 1450 ms
for non-shaky participants. However, the standard
deviation for shaky participants was 866 ms while
non-shaky participants had 749 ms. A slightly higher
standard deviation for shaky participants suggests that
their drag durations are more varied and less consis-
tent compared to non-shaky participants.
Overall, both groups required around 1.12 at-
tempts per trial, indicating comparable efficiency at
the task level despite the motor challenges faced by
shaky users. Success rates followed a similar pattern,
with shaky participants achieving about 91% success
rate and non-shaky participants around 92%.
Additional insights come from the velocity and
acceleration metrics. Shaky users showed slightly
higher mean velocities (877 px/s vs. 840 px/s) and
higher variability (standard deviation of 467 px/s
vs. 436 px/s), indicating faster, yet more inconsis-
tent movements compared to non-shaky users. The
distribution of mean velocity in Fig. 2 showed no-
table differences in variability. Non-shaky partici-
pants had a narrower distribution, indicating more
consistent performance, whereas shaky participants
had a broader spread, reflecting higher variability in
their mean velocity. A more pronounced difference
was also observed in acceleration, with shaky par-
ticipants showing a higher mean acceleration differ-
ence of 4,642 px/s
2
(31%) than non-shaky partici-
pants. This likely reflects abrupt or jerky changes in
ICT4AWE 2025 - 11th International Conference on Information and Communication Technologies for Ageing Well and e-Health
132
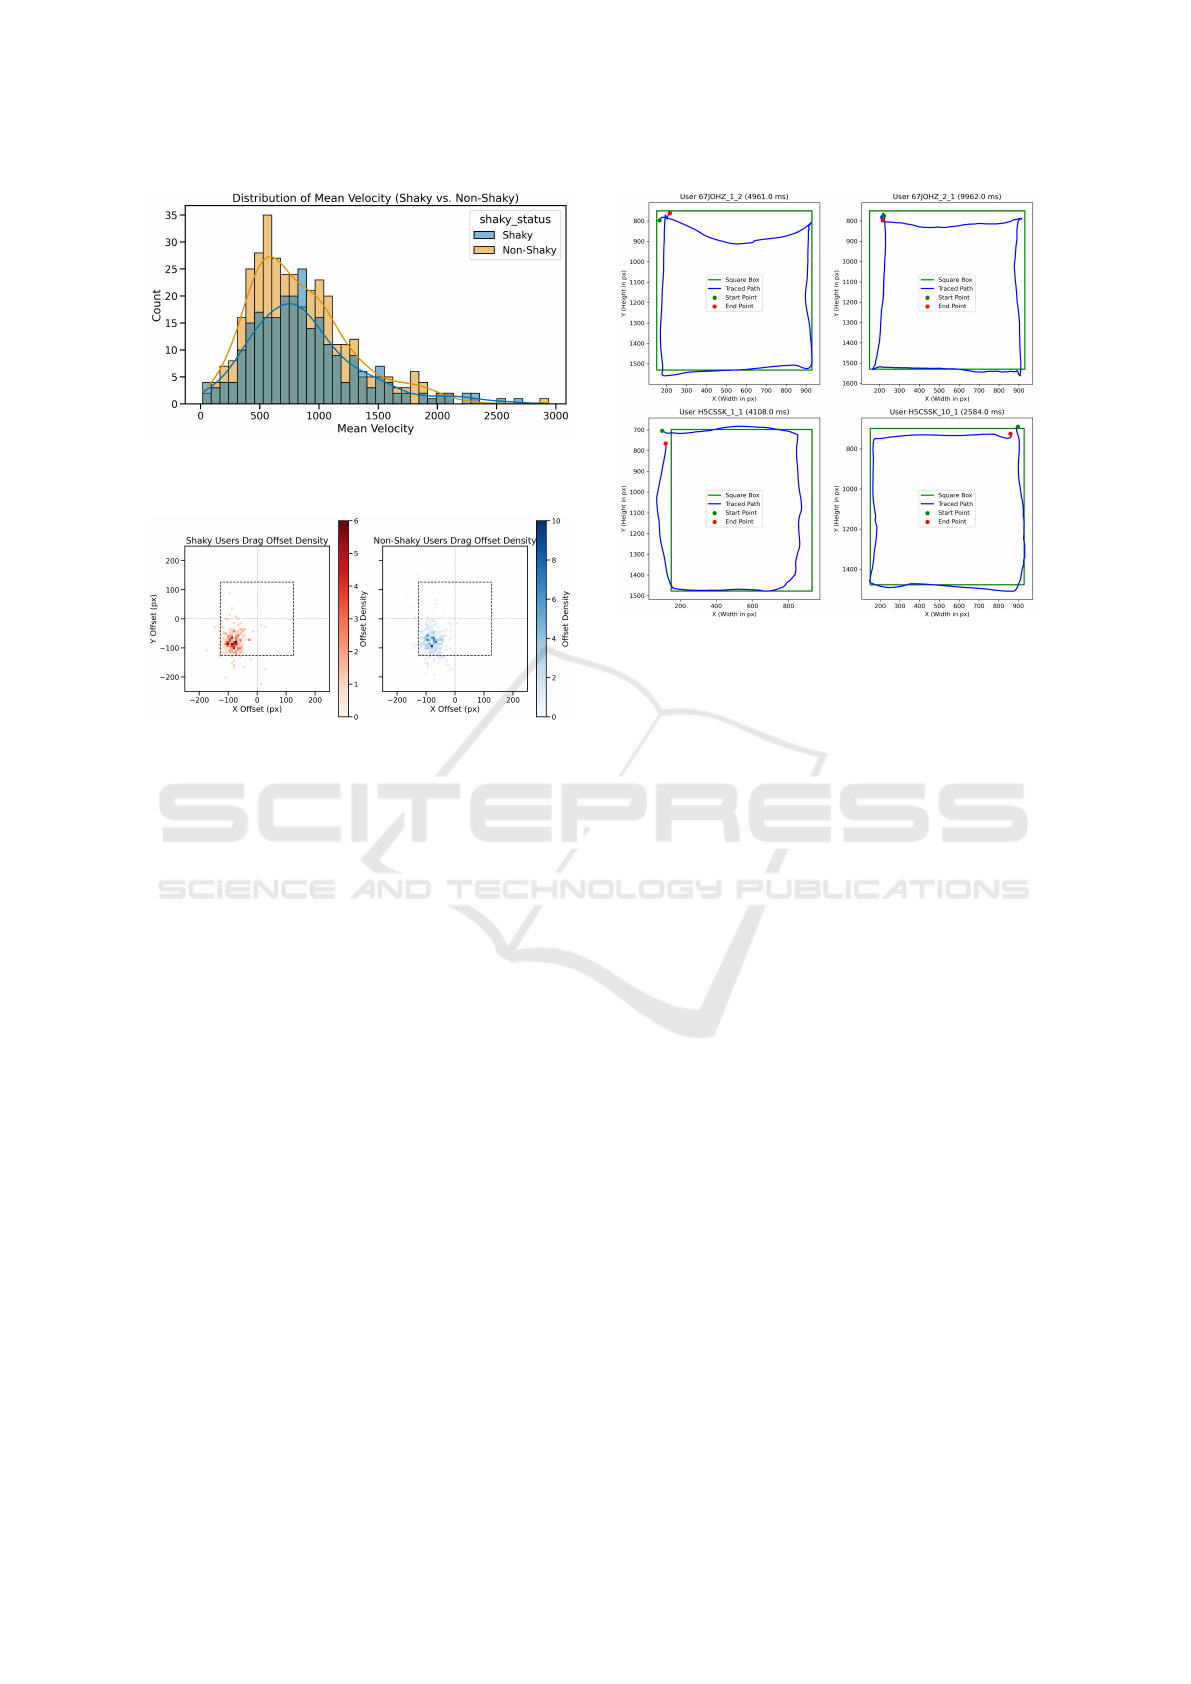
Figure 2: Distribution of mean velocity for shaky vs. non-
shaky participants.
Figure 3: Drag accuracy heatmaps (target box-view) for
shaky vs. non-shaky participants.
speed to correct their drag path due to handshakes.
Despite comparable success rates and the number
of attempts observed, participants with shaky hands
dropped the button farther from the target center than
non-shaky participants. Offset data (Fig. 3) show a
mean distance of 181 px (+24%) for shaky partici-
pants, compared to 146 px for non-shaky participants.
The higher offset indicates a tendency to drop the but-
ton near the edges of the target box, suggesting partic-
ipants still rely on the target’s tolerance to complete
tasks. The variability in accuracy was also notably
higher for shaky participants (std: 242 px) than for
non-shaky participants (std: 150 px). This highlights
that participants with shaky hands not only tended to
overshoot the target but also exhibited higher incon-
sistency in their interactions, highlighting the critical
impact of hand stability on precision.
4.2.3 Task 3
The analysis of the tracing task provides insights
into the interaction differences between participants
with comparatively shaky and non-shaky hand move-
ments. The results show notable differences in the
two groups’ attempts, tracing durations, and devi-
ations. Shaky participants required slightly more
attempts per trial, averaging 1.4 (std: 0.8), com-
pared to non-shaky participants, who averaged 1.3 at-
Figure 4: Elderly Users with Shaky Hands Tracing Patterns.
tempts (std: 0.6). Similarly, shaky participants had
a longer mean tracing duration of 6129 ms (std:
3780 ms), whereas non-shaky participants completed
the tasks faster, with an average duration of 4503 ms
(std: 2751 ms). The total deviation from the expected
path was also higher for shaky participants, averaging
45,183 px (std: 45,548 px), compared to 26,207 px
(std: 27,603 px) for non-shaky participants. Fig. 4
shows how elderly users with shaky hands trace a
square box, highlighting varied interaction patterns,
including differences in path smoothness, deviations,
movement dynamics, and completion times. While
shaky participants needed slightly more attempts than
non-shaky participants, their longer tracing durations
and higher deviations suggest increased difficulty in
maintaining precise control during the task.
The analysis of starting positions revealed that
most participants began tracing at the Top-Left (39
instances), followed by the Top-Right (16), with
fewer starting at the Bottom-Left (7) or Bottom-Right
(2). The tracing direction was predominantly clock-
wise (54 instances), with fewer participants tracing
counter-clockwise (10). These trends suggest a pref-
erence for specific starting points and movement pat-
terns, offering insights for designing tasks that align
better with user behaviors.
4.2.4 Observations
In addition to the data-driven analysis, we also ob-
served several important behaviors during the inter-
action tasks:
• Quick Taps: Overall, participants seemed to en-
joy the tapping tasks, almost like a simple game.
Digital Touchpoints: Generating Synthetic Data for Elderly Smartphone Interactions
133
Many participants showed quick responses when
tapping on different screen locations.
• Adjusting Smartphone Position: Many partici-
pants were observed repositioning the smartphone
using their hand holding the smartphone to com-
pensate range of hand interacting with the smart-
phone. This behavior allowed them to better align
their dominant hand with the on-screen targets,
potentially improving their interaction accuracy.
• Long Press: Despite the presence of vibration
feedback to confirm successful taps, some partic-
ipants were observed holding their taps for ex-
tended durations. This behavior may reflect un-
certainty about whether the input was registered,
or an effort to stabilize their finger on the target.
• Preference for Anchoring: Participants fre-
quently stabilized their elbows on surfaces such
as a lap. The data show that participants during
Tasks 1, 2, and 3, usually rested their elbows on
their lap (20, 23, 23) or kept them tucked close
to their body (9, 11, 9), respectively. This stabi-
lization appeared to mitigate the effects of hand
shakiness and provided better control during in-
teraction tasks requiring finer precision.
4.3 Synthetic Data Generation for
Shaky Hand Participants
4.3.1 Task 1
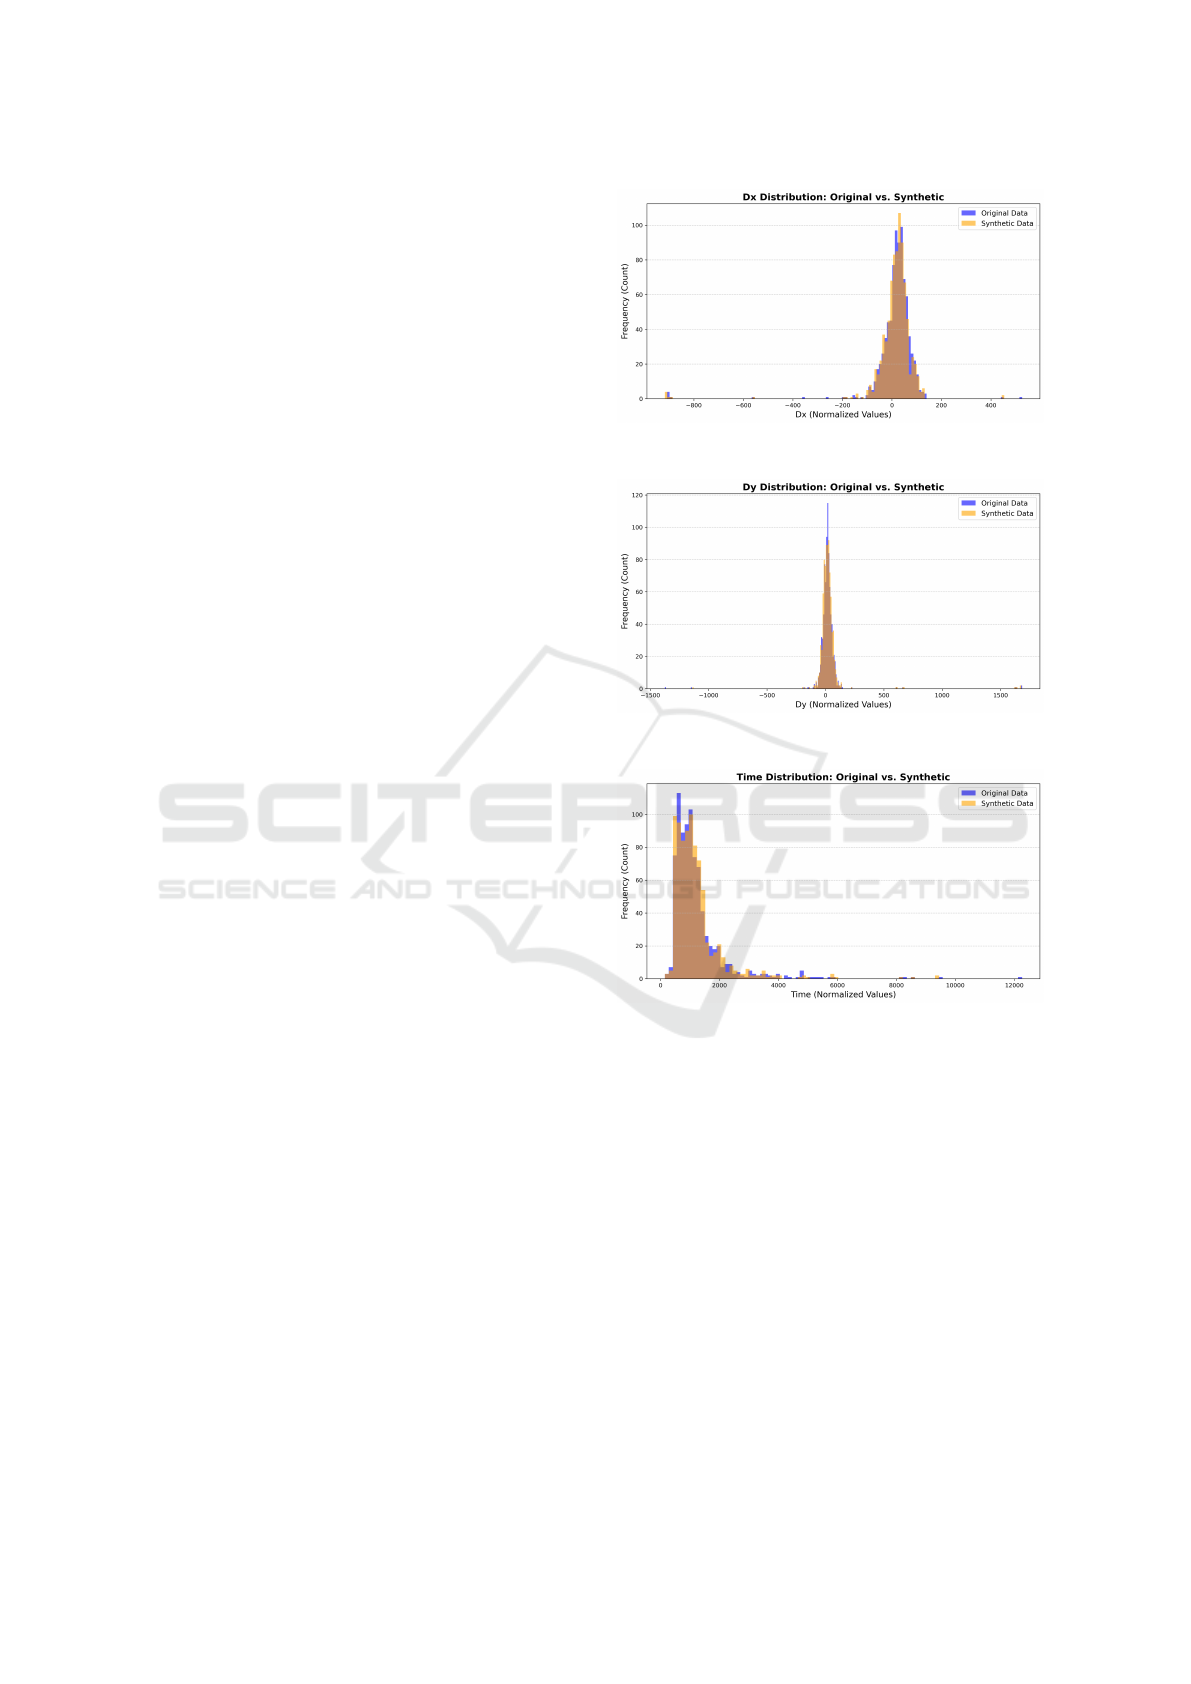
The training dataset consists of 828 tap events across
different button sizes and grid locations. The mean
Dx was 15 px (std: 91) and Dy was 23 px (std: 139),
indicating a tendency for taps slightly upward and
right from the button center on average. The mean
tap time was, 1,356 ms (std: 1,021), with min 148 ms
and max 12,261 ms.
The GPR model configuration effectively cap-
tured both structured patterns and modeled variability
in the dataset. We generated synthetic data 15 times
the size of the training dataset (n= 12,420). The GPR-
synthetic dataset closely mirrors the properties of the
original dataset while offering consistency across grid
locations and button sizes. The synthetic data showed
mean displacements (Dx: 16 px, Dy: 24 px) and
tap duration (1,231 ms) closely matching the origi-
nal dataset. Variability, indicated by standard devi-
ations, was slightly lower in the synthetic data (Dx:
86 px, Dy: 130 px) compared to the original (Dx:
91 px, Dy: 138 px), overall synthetic data maintain-
ing the diversity of user tapping behaviors. Addition-
ally, the synthetic data preserved the tapping difficul-
ties that participants encountered by reproducing er-
Figure 5: Task 1 - Tap Dx Density.
Figure 6: Task 1 - Tap Dy Density.
Figure 7: Task 1 - Tap Time Density.
ror rates across locations and button sizes, original:
n = 135 (16.3%) and synthetic: n = 1,977 (15.9%).
The synthetic data closely replicated the original data
distributions for Dx, Dy, and time, as also seen in the
plots in Fig .5, Fig .6 and Fig .7, with aligned cen-
tral peaks and preserved variability, including extreme
ranges.
4.3.2 Task 2
For Task 2, 225 time series were used to train and gen-
erate synthetic data. A Bidirectional LSTM layer with
512 units was configured to process combined numer-
ical (x and y drag paths) and categorical features (time
stamps/intervals). The model demonstrated rapid im-
provement during the initial epochs, with significant
reductions in MSE and MAE by Epoch 6, followed by
ICT4AWE 2025 - 11th International Conference on Information and Communication Technologies for Ageing Well and e-Health
134
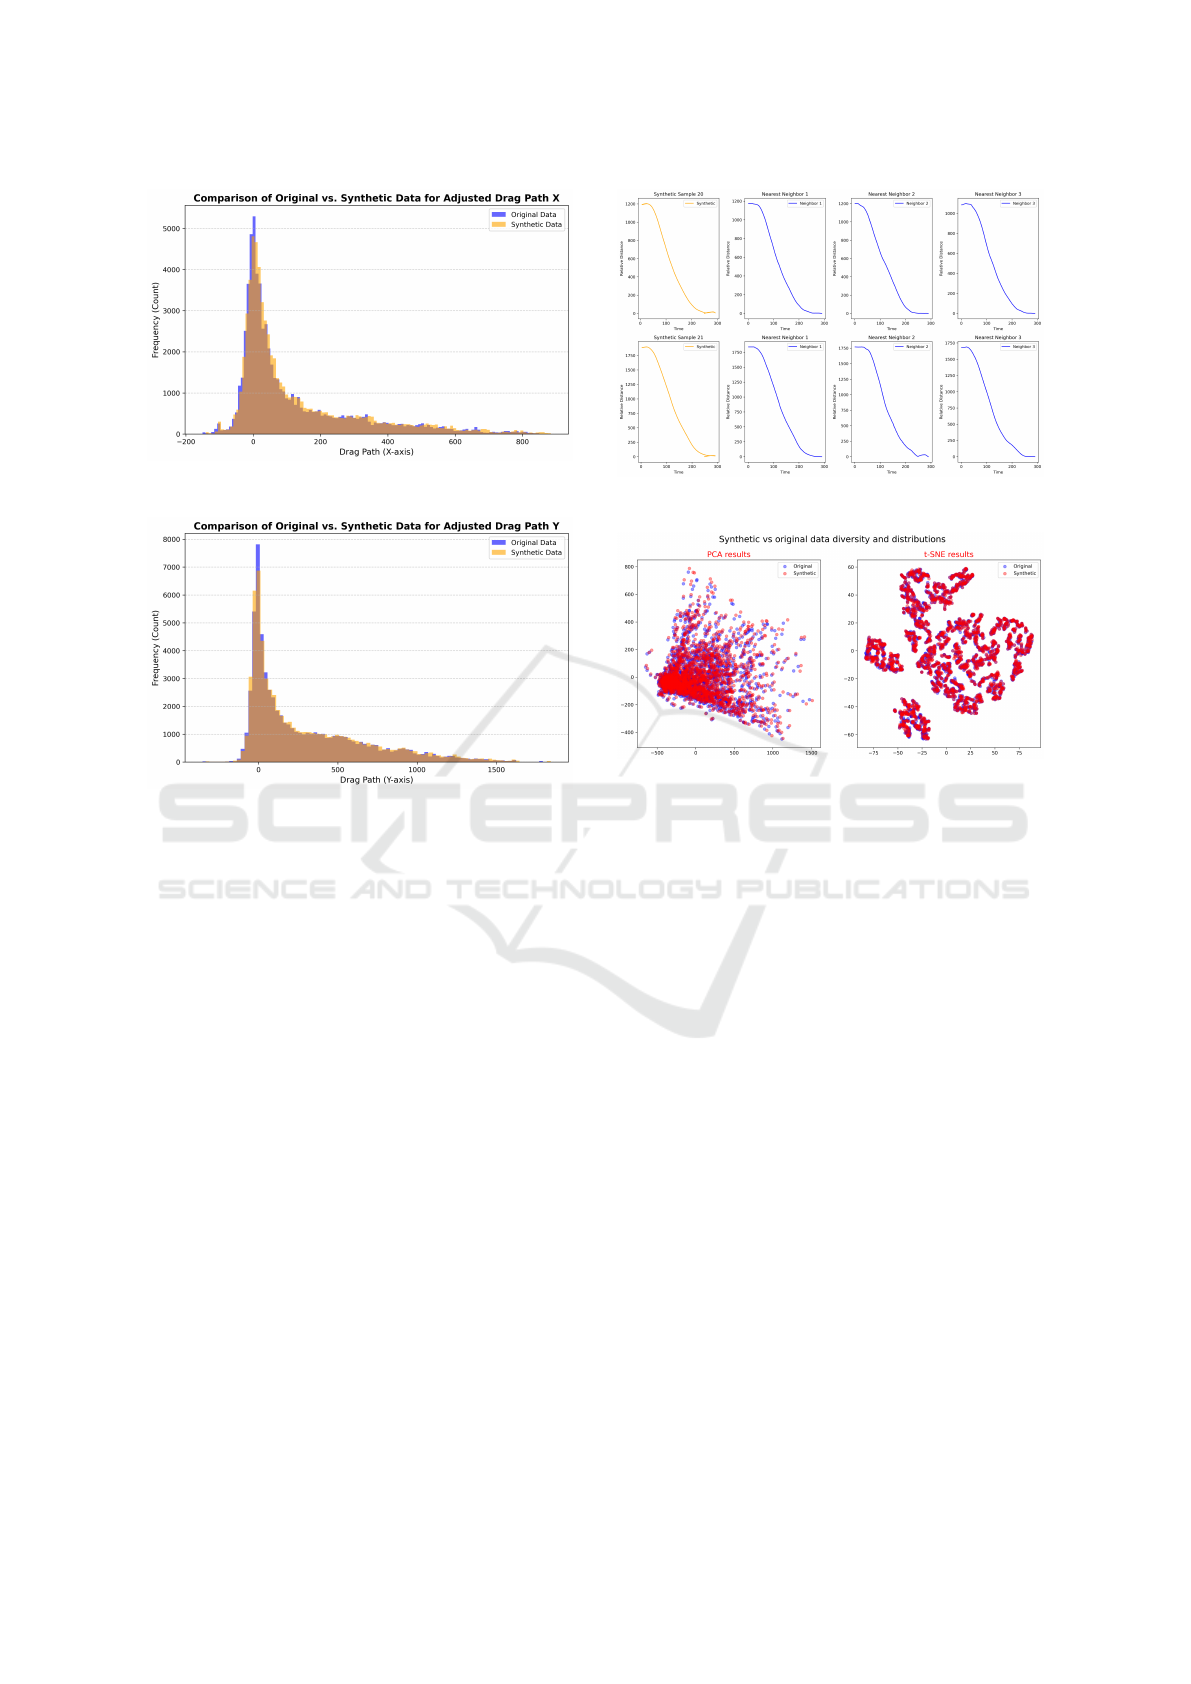
Figure 8: Task 2 - Drag x-axis Distribution.
Figure 9: Task 2 - Drag y-axis Distribution.
gradual convergence after Epoch 12. Minor loss os-
cillations after Epoch 16 likely reflected the model’s
fine-tuning of predictions, driven by the interplay be-
tween numerical and categorical features.
The synthetic data closely replicated the original
dataset’s distribution for both X and Y axes, with
slightly higher means (X: 125 px vs. 116 px, Y:
299 px vs. 289 px), standard deviations (X: 183 vs.
178, Y: 373 vs. 367), and medians (X: 46 px vs.
39 px, Y: 146 px vs. 135 px), while ranges remained
consistent. The synthetic data slightly overestimates
average starting drag positions (points), with the x-
axis averaging 366 px compared to 339 px (ranges:
20–878 px vs. 3–850 px) and the y-axis averaging
821 px compared to 793 px (ranges: 52–1,838 px vs.
30–1,794 px).
These results indicate that overall, the synthetic
data effectively captures the distributional character-
istics of the original dataset for both axes, with minor
variations and variability. The histogram in Fig .8 and
Fig .9 also shows an overlap between the original and
synthetic data distributions. Both distributions peak
near zero, reflecting as user approach to the target lo-
cation.
For timestamp intervals, the synthetic data closely
matched the original in mean (146 ms), me-
Figure 10: Task 2 - Synthetic time series Nearest Neighbors.
Figure 11: Task 2 - PCA and T-SNE Analysis.
dian (144 ms), and standard deviation (84 ms), repli-
cating the overall distribution effectively. However,
it introduced negative values (min: -9 ms) that were
not in the original dataset and slightly overestimated
the maximum time intervals (306 ms vs. 290 ms), ex-
tending the range slightly.
Nearest neighbor (NN) analysis was conducted to
compare the synthetic time series data to the original
dataset’s three closest neighbors based on similarity in
time series patterns. Both synthetic and original time
series demonstrated consistent monotonic decreases
in relative distance over time, indicating that the syn-
thetic data effectively captures the temporal and struc-
tural patterns of the original dataset (see Fig .10).
The PCA plot also showed an overlap between
synthetic and original data (Fig .11), indicating the
synthetic data captures the global variance and diver-
sity of the original. The t-SNE plot further demon-
strates that the synthetic data maintains local struc-
tures and clustering, replicating intricate patterns of
the original dataset.
Furthermore, we calculated Wasserstein Dis-
tance (WD) for each synthetic time series by compar-
ing it to every time series in the original dataset. The
results demonstrated strong alignment, with a mean
WD of 0.00099, a median of 0.00063, and a standard
deviation of 0.00166 across 225 samples, indicating
Digital Touchpoints: Generating Synthetic Data for Elderly Smartphone Interactions
135

consistent similarity and minimal distance from their
closest original time series. The maximum WD was
0.02223, which remains acceptable given the data’s
small-scale normalization (-1,1). These findings con-
firm high fidelity in the synthetic data generation pro-
cess, with only minor variations in a few cases.
With JS bounded being between 0 and 1, the JS
distance results indicate a small distance between syn-
thetic and original time series distributions. Across
225 samples, the mean JS distance was 0.15088, with
a standard deviation of 0.04881, suggesting consis-
tent yet slightly varied similarity levels. The mini-
mum JS distance was 0.05950 and the maximum was
0.35904, highlighting a few cases with comparatively
higher distance. Overall, the small WD values reflect
good spatial similarity, whereas the JS values high-
light minor discrepancies in the relative probability
distributions of the synthetic and original data.
4.3.3 Task 3
We used 38 time series for training and generating
synthetic data for Task 3. A single Bidirectional
LSTM layer with 512 units was configured to pro-
cess the combined numerical (x and y trace paths) and
categorical features (time stamps/intervals). The syn-
thetic data generation showed good results in repli-
cating the statistical properties of the original dataset.
For trace points, the means were similar (X: 371 px
vs. 375 px, Y: 379 px vs. 384 px), with slight reduc-
tions in variability (X std: 316 vs. 321, Y std: 321
vs. 325). The ranges were slightly narrower in the
synthetic data X: [-120, 868] vs. [-127, 888] and Y: [-
77, 860] vs. [-81, 870], reflecting a minor smoothing
effect. Temporal features were also consistent, with
time incremental means 162 (synthetic) vs. 163 (orig-
inal) and identical time interval means (1.53 vs. 1.54).
These results highlight the synthetic dataset’s ability
to preserve spatial and temporal patterns, while rep-
resenting extreme values. The histogram in Fig .12
and Fig .13 also shows an overlap between the origi-
nal and synthetic data distributions. Fig .14 shows a
plot of a generated sample of time series compared to
its closed sample in the original data.
Nearest neighbor (NN) analysis showed that syn-
thetic time series data effectively replicates the peak
structure, timing, and variability of their closest orig-
inal dataset neighbors (see Fig .15). The PCA and
t-SNE visualizations compare the diversity and dis-
tribution of synthetic and original data for the box-
tracing task (Fig .16). The PCA and t-SNE visualiza-
tions also show that synthetic data closely aligns with
the original data in capturing the geometric structure
(PCA) and clustering patterns (t-SNE) of the box-
tracing task.
Figure 12: Task 3 - Trace x-axis Distribution.
Figure 13: Task 3 - Trace y-axis Distribution.
Figure 14: Task 3 - Sample 1 Trace Plot.
Figure 15: Task 3 - Synthetic time series Nearest Neighbors.
ICT4AWE 2025 - 11th International Conference on Information and Communication Technologies for Ageing Well and e-Health
136

Figure 16: Task 3 - PCA and T-SNE Analysis.
We calculated the WD for each generated time
series. The results show that the generated time se-
ries needed less work/distance to move to their clos-
est time series in the original data, with a mean WD
of 0.00158 and a median of 0.000657. The low stan-
dard deviation (0.00217) reflects consistent fidelity,
the synthetic data closely replicates the original time
series patterns with minimal variation. The JS Dis-
tance results also demonstrate high fidelity in the syn-
thetic data generation process with low mean dis-
tance (0.0796), median (0.0556), and standard devi-
ation (0.0575).
5 DISCUSSION
5.1 RQ.1: GUI Interaction Patterns
Among Elderly Users
Our findings align with previous studies highlight-
ing the challenges of tapping for elderly users, par-
ticularly those with shaky hands. For instance, a
study highlighted that smaller target sizes raise error
rates (Hwangbo et al., 2013), which our results con-
firm as participants with shaky hands showed a 40%
error rate for 48 dp buttons compared to 13% for non-
shaky participants. Although Google accessibility
guidelines for mobile user interfaces suggest a min-
imum touch target size of 48 dp (Google, 2023), our
study found that this size may still be insufficient for
elderly users with shaky hands. Therefore, increasing
button sizes beyond the standard recommendations
could further improve accessibility for this demo-
graphic. Similarly, studies advocated for larger tar-
gets to improve accessibility (Hwangbo et al., 2013;
Nicolau et al., 2014; Kobayashi et al., 2011; Salman
et al., 2023), a recommendation supported by our
findings that error rates for shaky participants de-
creased significantly with larger button sizes (16% for
56 dp and 10% for 64 dp).
Our study also provided insights into the speed-
accuracy trade-offs in tapping tasks. We observed that
shaky participants managed to tap with a similar du-
ration to non-shaky participants, although with higher
error rates. This finding suggests a behavioral adapta-
tion or a compensatory mechanism where users prior-
itize speed over precision. Notably, participants gen-
erally approached tapping tasks as a game, respond-
ing quickly, which indicates positive engagement,
aligning with findings that elderly users often enjoy
simplified, gamified interactions (An et al., 2024).
The observed diversity in interaction strategies em-
phasizes the need for customizable interfaces (Brun-
zini et al., 2022). While some users prefer quick
taps, others may prefer slower, more deliberate inter-
actions, indicating that a one-size-fits-all approach is
insufficient to accommodate diverse user preferences.
Previous research has identified dragging as par-
ticularly challenging for elderly users (Salman et al.,
2019; Brunzini et al., 2022; Shao et al., 2023). Our
findings revealed minimal differences between shaky
and non-shaky participants in duration and attempts
during drag-and-drop tasks. However, shaky par-
ticipants showed higher variability in velocities and
higher accelerations, along with a 24% higher offset
distance from the target center, indicating a tendency
to overshoot targets more frequently.
While (Shao et al., 2023) described a two-phase
dragging approach, initial movement followed by pre-
cision fine-tuning, our findings did not identify a dis-
tinct calibration phase. Instead, the higher veloc-
ity and acceleration metrics (indicating abrupt, jerky
movements) among shaky participants suggest re-
liance on corrective actions during drags or traces
rather than a deliberate two-step strategy.
5.2 RQ.2: Synthetic Data Generation
A key challenge is generating synthetic data that ac-
curately reflects the complexities of real user behav-
ior. Synthetic data should preserve the underlying
patterns and behaviors of the original dataset. Find-
ings presented and discussed in Sec. 4.3 show that our
generative models, GPR for tapping and Bidirectional
LSTM for dragging and tracing, effectively captured
older adults’ UI interaction patterns with high fidelity
in spatial, temporal, and distributional patterns. Be-
yond visual or descriptive comparisons, quantitative
assessments like Nearest Neighbor analyses, Wasser-
stein Distances (WD), and Jensen–Shannon (JS) Dis-
tances, also showed minimal divergence between real
and synthetic data. Overall, GPR and LSTM mod-
els are capable of identifying the distinctive gestures
of the elderly, particularly when training data in-
cludes variations in button sizes, grid locations, and
drag/trace paths.
Digital Touchpoints: Generating Synthetic Data for Elderly Smartphone Interactions
137

The findings also highlight the potential of syn-
thetic data to replicate human interaction patterns,
aligning with earlier research (Breuer et al., 2024)
on its effectiveness in data-scarce scenarios. Simi-
larly, (Brandt and Dasgupta, 2023) highlighted syn-
thetic data utility in modeling complex behaviors, re-
inforcing its value as a complement to real user inter-
actions in usability and accessibility evaluations. The
synthetic datasets’ ability to generate user “error” be-
haviors (e.g., off-target taps) is critical for modeling
real-world usability: systems designed for the elderly
must account for occasional mis-taps or mis-drags
due to reduced dexterity or low precision. By repro-
ducing these errors, synthetic datasets can help eval-
uators anticipate where and how elderly with shaky
hands might struggle.
Beyond the purely technical metrics, an important
consequence of these high-fidelity results is the op-
portunity to scale up usability and accessibility evalu-
ations of early-stage design/prototypes. Since recruit-
ing the elderly can be challenging, large and diverse
synthetic datasets can be generated to test multiple
interface layouts or interaction elements. Thus, syn-
thetic data can further support the development of AI-
driven usability evaluation tools, discussed in our pre-
vious study (Maqbool et al., 2024), promoting inno-
vative and cost-effective design evaluation processes.
5.3 Implications
The study’s findings present the following key re-
search and practical implications:
• Existing accessibility guidelines may be insuffi-
cient for users with motor impairments. The study
showed that the minimum recommended UI ele-
ment size still significantly increased error rates,
suggesting that accessibility standards and guide-
lines require further empirical validation for such
user groups.
• Increasing button sizes reduced errors and im-
proved accuracy for elderly users, particularly
those with shaky hands. UX designers, in general,
should prioritize larger, well-spaced UI elements
to improve accessibility.
• The study revealed variability in elderly users’ in-
teraction styles—some preferred quick taps de-
spite lower accuracy, while others took a more de-
liberate approach. A one-size-fits-all approach is
inadequate; applications should provide adaptable
GUIs or user-adjustable settings (e.g., touch sen-
sitivity, input delay buffers) to accommodate dif-
ferent motor abilities. Furthermore, future work
can explore how built-in device sensors (e.g.,
accelerometer) could automatically detect hand
shakiness and trigger adaptive GUIs.
• Some elderly users held their taps longer than nec-
essary, possibly due to uncertainty about whether
the input was registered. More explicit haptic, vi-
sual, or audio feedback mechanisms should be in-
tegrated to confirm user actions and reduce uncer-
tainty.
• The study demonstrated that synthetic data can
closely replicate real user interactions, including
errors like mis-taps and inaccurate drag comple-
tions. Future research should explore synthetic
data’s applicability to additional interaction types,
such as scrolling through lists and on-screen key-
board usage.
• The high fidelity of generated synthetic data sug-
gests that early-stage usability and accessibility
evaluations can be conducted using ML-generated
GUI interaction datasets before involving actual
users. This may reduce the time and costs of itera-
tive UI prototyping, particularly for accessibility-
focused design. Additionally, AI-generated syn-
thetic users could complement real-world user
testing, enabling hybrid human-AI usability eval-
uation methods.
5.4 Threats to Validity
External Validity: Our study included elderly par-
ticipants from different countries, like Sweden, Pak-
istan, Italy, and Germany. However, we acknowl-
edge that global representation and generalizability
require even wider demographic diversity. Nonethe-
less, securing 51 participants and conducting a com-
prehensive analysis was a significant achievement, es-
pecially given the ethical, privacy, and resource con-
straints inherent in such research. Conducting tasks
in natural environments also helped ensure realistic
assessments of smartphone interactions.
Construct Validity: A threat was that our
threshold-based clustering could lead to under- or
over-estimation of “shaky” or “non-shaky” partici-
pants. To mitigate this, we used cross-validations with
PSD analysis, band-pass filtering, and clustering al-
gorithms like K-means to refine and validate the clus-
tering process. The inclusion of specific frequency
bands also ensured alignment with the literature on
motor control and shakiness.
Internal Validity: For RQ.1, the study refrains
from making causal claims and instead focuses on
presenting data and argumentation to explore elderly
interaction patterns and associated challenges. How-
ever, uncontrollable factors, such as environmental
ICT4AWE 2025 - 11th International Conference on Information and Communication Technologies for Ageing Well and e-Health
138

variations, may have influenced the results.
6 CONCLUSIONS AND FUTURE
WORK
This study explored the smartphone interaction pat-
terns of elderly users, focusing on those with shaky
hands, through designing specific touchscreen tasks.
Participants with shaky hands encountered distinct
difficulties in touchscreen interactions, especially
with smaller buttons, abrupt velocities during drag-
ging tasks, and path deviations during tracing tasks
where precision and stability were critical. In con-
trast, larger GUI elements were more effective in ac-
commodating their variability in motor control.
GPR and LSTM models successfully generated
synthetic datasets, replicating interaction patterns
with high spatial, temporal, and distributional fidelity,
demonstrating their utility for future AI-driven usabil-
ity and accessibility evaluation research.
Future studies could explore complex interactions
like scrolling, multi-gesture, and text input, include
participants with motor impairments (e.g., Parkin-
son’s), and investigate adaptive UI designs that adjust
to motor limitations. Synthetic datasets can also be
used to develop predictive tools for accessibility and
usability evaluations.
ACKNOWLEDGEMENTS
This work was partly funded by Region V
¨
armland
through the DHINO project (ref: RUN/220266) and
DHINO 2 project (ref: 2023/828).
REFERENCES
An, S., Cheung, C. F., and Willoughby, K. W. (2024).
A gamification approach for enhancing older adults’
technology adoption and knowledge transfer: A case
study in mobile payments technology. Technological
Forecasting and Social Change, 205:123456.
Beck, J. and Chakraborty, S. (2024). Fully embedded time
series generative adversarial networks. Neural Com-
puting and Applications, pages 1–10.
Brandt, B. and Dasgupta, P. (2023). Synthetically gener-
ating human-like data for sequential decision-making
tasks via reward-shaped imitation learning. In Syn-
thetic Data for Artificial Intelligence and Machine
Learning: Tools, Techniques, and Applications, vol-
ume 12529, pages 151–163. SPIE.
Breuer, T., Fuhr, N., and Schaer, P. (2024). Validating syn-
thetic usage data in living lab environments. ACM
Journal of Data and Information Quality, 16(1):1–33.
Brunzini, A., Papetti, A., Grassetti, F., Moroncini, G., and
Germani, M. (2022). The effect of systemic sclero-
sis on use of mobile touchscreen interfaces: Design
guidelines and physio-rehabilitation. International
Journal of Industrial Ergonomics, 87:103256.
Butcher, C. J. and Hussain, W. (2022). Digital healthcare:
the future. Future healthcare journal, 9(2):113–117.
Dannels, S. (2023). Creating disasters: Recession fore-
casting with gan-generated synthetic time series data.
arXiv preprint arXiv:2302.10490.
Davies, K. (2024). Share of smartphone
users in germany 2021, by age group.
https://www.statista.com/statistics/469969/share-
of-smartphone-users-in-germany-by-age-group/.
Elboim-Gabyzon, M., Weiss, P. L., and Danial-Saad, A.
(2021). Effect of age on the touchscreen manipula-
tion ability of community-dwelling adults. Interna-
tional Journal of Environmental Research and Public
Health, 18(4):2094.
Elguera Paez, L. and Zapata Del R
´
ıo, C. (2019). Elderly
users and their main challenges usability with mobile
applications: a systematic review. In Design, User Ex-
perience, and Usability. Design Philosophy and The-
ory: 8th International Conference, DUXU 2019, Held
as Part of the 21st HCI International Conference,
HCII 2019, Orlando, FL, USA, July 26–31, 2019, Pro-
ceedings, Part I 21, pages 423–438. Springer.
Google (2023). Material design guidelines - touch tar-
get size. https://support.google.com/accessibility/
android/answer/7101858?hl=en. Accessed: 2024-03-
01.
Heida, T., Wentink, E. C., and Marani, E. (2013). Power
spectral density analysis of physiological, rest and ac-
tion tremor in parkinson’s disease patients treated with
deep brain stimulation. Journal of neuroengineering
and rehabilitation, 10:1–11.
Hess, C. W. and Pullman, S. L. (2012). Tremor: clinical
phenomenology and assessment techniques. Tremor
and other hyperkinetic movements, 2.
Hochreiter, S. (1997). Long short-term memory. Neural
Computation MIT-Press.
Hwangbo, H., Yoon, S. H., Jin, B. S., Han, Y. S., and Ji,
Y. G. (2013). A study of pointing performance of el-
derly users on smartphones. International Journal of
Human-Computer Interaction, 29(9):604–618.
Islam, M. M., Nooruddin, S., Karray, F., and Muhammad,
G. (2022). Human activity recognition using tools of
convolutional neural networks: A state of the art re-
view, data sets, challenges, and future prospects. Com-
puters in biology and medicine, 149:106060.
Jamshidi, A., Arif, M., Kalhoro, S. A., and Gelbukh, A.
(2024). Synthetic time series data generation for
healthcare applications: A pcg case study. arXiv
preprint arXiv:2412.16207.
Jiang, T., Li, W., and Liu, J. (2024). The landscape of data
reuse in interactive information retrieval: Motivations,
sources, and evaluation of reusability. arXiv preprint
arXiv:2411.15430.
Digital Touchpoints: Generating Synthetic Data for Elderly Smartphone Interactions
139

Joshi, S. G. (2018). Confronting common assumptions
about the psychomotor abilities of older adults in-
teracting with touchscreens. In Human Aspects of
IT for the Aged Population. Acceptance, Communica-
tion and Participation: 4th International Conference,
ITAP 2018, Held as Part of HCI International 2018,
Las Vegas, NV, USA, July 15–20, 2018, Proceedings,
Part I 4, pages 261–278. Springer.
Kobayashi, M., Hiyama, A., Miura, T., Asakawa, C., Hi-
rose, M., and Ifukube, T. (2011). Elderly user evalua-
tion of mobile touchscreen interactions. In Human-
Computer Interaction–INTERACT 2011: 13th IFIP
TC 13 International Conference, Lisbon, Portugal,
September 5-9, 2011, Proceedings, Part I 13, pages
83–99. Springer.
Lin, Z., Jain, A., Wang, C., Fanti, G., and Sekar, V. (2020).
Using gans for sharing networked time series data:
Challenges, initial promise, and open questions. In
Proceedings of the ACM Internet Measurement Con-
ference, pages 464–483.
Maqbool, B. and Herold, S. (2024). Potential effectiveness
and efficiency issues in usability evaluation within
digital health: A systematic literature review. Jour-
nal of Systems and Software, 208:111881.
Maqbool, B., Jalal, L., and Herold, S. (2024). Towards us-
ing synthetic user interaction data in digital healthcare
usability evaluation. In BIOSTEC (2), pages 595–603.
Nicolau, H., Guerreiro, T., Jorge, J., and Gonc¸alves, D.
(2014). Mobile touchscreen user interfaces: bridg-
ing the gap between motor-impaired and able-bodied
users. Universal access in the information society,
13:303–313.
Nurgalieva, L., Laconich, J. J. J., Baez, M., Casati, F., and
Marchese, M. (2019). A systematic literature review
of research-derived touchscreen design guidelines for
older adults. IEEE Access, 7:22035–22058.
O’Dea, S. (2021). Uk: smartphone owner-
ship by age from 2012–2021. Online.
https://www.statista.com/statistics/271851/
smartphone-owners-in-the-united-kingdom-uk-by-age.
Pew Trusts (2019). Poor usability of electronic health
records can lead to drug errors, jeopardizing pediatric
patients. Accessed: 2024-12-25.
Polvorinos-Fern
´
andez, C., Sigcha, L., de Pablo, L. P., Borz
`
ı,
L., Cardoso, P., Costa, N., Costa, S., L
´
opez, J. M.,
de Arcas, G., and Pav
´
on, I. (2024). Evaluation of the
performance of wearables’ inertial sensors for the di-
agnosis of resting tremor in parkinson’s disease. In
Proceedings of the 17th International Joint Confer-
ence on Biomedical Engineering Systems and Tech-
nologies (BIOSTEC 2024), volume 2, pages 820–827.
SCITEPRESS.
Ranja, F., Nababan, E. B., and Candra, A. (2023). Synthetic
data generation using time-generative adversarial net-
work (time-gan) to predict cash atm. In 2023 Interna-
tional Conference on Computer, Control, Informatics
and its Applications (IC3INA), pages 418–423. IEEE.
Ratwani, R. M., Savage, E., Will, A., Fong, A., Karavite,
D., Muthu, N., Rivera, A. J., Gibson, C., Asmonga,
D., Moscovitch, B., et al. (2018). Identifying elec-
tronic health record usability and safety challenges in
pediatric settings. Health affairs, 37(11):1752–1759.
Salman, H. M., Wan Ahmad, W. F., and Sulaiman, S.
(2019). Usability evaluation of smartphone gestures in
supporting elderly users. In Advances in Visual Infor-
matics: 6th International Visual Informatics Confer-
ence, IVIC 2019, Bangi, Malaysia, November 19–21,
2019, Proceedings 6, pages 672–683. Springer.
Salman, H. M., Wan Ahmad, W. F., and Sulaiman, S.
(2023). A design framework of a smartphone user
interface for elderly users. Universal Access in the
Information Society, 22(2):489–509.
Schulz, E., Speekenbrink, M., and Krause, A. (2018). A tu-
torial on gaussian process regression: Modelling, ex-
ploring, and exploiting functions. Journal of mathe-
matical psychology, 85:1–16.
Schwarz, C. (2024). Interpretable genai: Synthetic financial
time series generation with probabilistic lstm. Avail-
able at SSRN 4877007.
Shamsujjoha, M., Grundy, J., Li, L., Khalajzadeh, H., and
Lu, Q. (2021). Human-centric issues in ehealth app
development and usage: A preliminary assessment.
In 2021 IEEE International Conference on Software
Analysis, Evolution and Reengineering (SANER),
pages 506–510. IEEE.
Shao, Y., Zhou, J., and Wang, W. (2023). Smartphone touch
gesture for right-handed older adults: touch perfor-
mance and offset models. Journal of Ambient Intelli-
gence and Humanized Computing, 14(3):2549–2566.
Sheppard, B., Kouyoumjian, G., Sarrazin, H., and Dore, F.
(2018). The business value of design. mckinsey &
company.
Sinabell, I. and Ammenwerth, E. (2024). Challenges and
recommendations for ehealth usability evaluation with
elderly users: systematic review and case study. Uni-
versal Access in the Information Society, 23(1):455–
474.
Stenger, M., Leppich, R., Foster, I., Kounev, S., and Bauer,
A. (2024). Evaluation is key: a survey on evalua-
tion measures for synthetic time series. Journal of Big
Data, 11(1):66.
Stephenson, A., Allison, R., and Pyzer-Knapp, E. (2022).
Provably reliable large-scale sampling from gaussian
processes. arXiv preprint arXiv:2211.08036.
Susiluoto, J., Spantini, A., Haario, H., H
¨
ark
¨
onen, T., and
Marzouk, Y. (2020). Efficient multi-scale gaussian
process regression for massive remote sensing data
with satgp v0. 1.2. Geoscientific Model Development,
13(7):3439–3463.
Wegge, K. P. and Zimmermann, D. (2007). Accessibility,
usability, safety, ergonomics: concepts, models, and
differences. In Universal Acess in Human Computer
Interaction. Coping with Diversity: 4th International
Conference on Universal Access in Human-Computer
Interaction, UAHCI 2007, Held as Part of HCI Inter-
national 2007, Beijing, China, July 22-27, 2007, Pro-
ceedings, Part I 4, pages 294–301. Springer.
Yoon, J., Jarrett, D., and Van der Schaar, M. (2019). Time-
series generative adversarial networks. Advances in
neural information processing systems, 32.
ICT4AWE 2025 - 11th International Conference on Information and Communication Technologies for Ageing Well and e-Health
140
