
Social Media as a Tool for Promoting Inclusion: An Analysis of the
Facebook and Instagram Pages of Inclusive Spaces
Francisca Rocha Lourenço
a
, Rita Oliveira
b
and Oksana Tymoshchuk
c
DigiMedia, Department of Communication and Art, University of Aveiro, Aveiro, Portugal
Keywords: Social Media, Content Analysis, Inclusive Spaces, Inclusion, Facebook, Instagram, Engagement.
Abstract: This study explores the use of social media platforms, specifically Facebook and Instagram, by Inclusive
Spaces (IS) to promote social and digital inclusion. Through a mixed-methods approach, combining
quantitative analysis of engagement metrics and qualitative content analysis, the research examines how IS
use different types and formats of content to engage audiences and disseminate inclusive practices. The results
reveal that visual content, especially images, dominates posts on both platforms, with solidarity and record-
orientated content generating the highest engagement averages per post. Instagram stands out as the platform
with higher overall interaction rates compared to Facebook, despite a lower presence among ISs. The study
identifies a strong emotional and relational appeal in solidarity content, highlighting its effectiveness in
fostering public engagement. In addition, differences in platform functionality influence content strategies,
with Instagram favouring collaborative and visually dynamic posts. The results emphasise the potential of
social media as a tool for increasing the visibility of SI initiatives and strengthening community involvement
in inclusive causes.
1 INTRODUCTION
This paper aims to analyse the use of Facebook and
Instagram pages by Inclusive Spaces (IS) to promote
inclusion. Through a content analysis, the aim is to
understand how these platforms are used to engage
communities, disseminate knowledge and promote
inclusive practices. In essence, this research seeks to
answer the following question: how do IS Facebook
and Instagram pages use different types and formats
of content to promote their goals and engage their
target audience?
The goals of this study are to identify the main
topics covered in the posts, analyse the content
formats used, determine which formats and types of
content generate the most engagement from the target
audience, and compare the communication strategies
used on Facebook and Instagram.
This study thus aims to deepen understanding of
the role of social media as a tool to promote inclusion,
providing valuable insights that can guide other
organisations to adopt more effective and engaging
a
https://orcid.org/0000-0003-0214-3008
b
https://orcid.org/0000-0001-6041-9469
c
https://orcid.org/0000-0001-8054-8014
communication practices to promote IS, and ensure,
through their access, inclusion. Applying these
practices will allow IS to disseminate their services
more effectively, increase their visibility and,
consequently, attract more people. By attracting a
wider audience, access to the resources on offer is
increased and the promotion of social and digital
inclusion is strengthened (Rocha Lourenço et al.,
2023).
This paper is divided into six sections. After this
introduction, Section 2 presents the theoretical
framework, reviewing relevant studies on the use of
social media and inclusive spaces. Section 3 discusses
the methodology used, describing the sample
selection process, the data collection strategies and
the analytical approach. In section 4, the main results
are presented, revealing the presence of the analysed
spaces on different digital platforms, and presenting
standards in the types and goals of content and
engagement on the Facebook and Instagram pages of
IS. Section 5 offers a discussion of these results in the
context of the literature, highlighting the main ideas
Lourenço, F. R., Oliveira, R. and Tymoshchuk, O.
Social Media as a Tool for Promoting Inclusion: An Analysis of the Facebook and Instagram Pages of Inclusive Spaces.
DOI: 10.5220/0013440000003938
In Proceedings of the 11th International Conference on Information and Communication Technologies for Ageing Well and e-Health (ICT4AWE 2025), pages 141-152
ISBN: 978-989-758-743-6; ISSN: 2184-4984
Copyright © 2025 by Paper published under CC license (CC BY-NC-ND 4.0)
141

and implications. Finally, Section 6 presents the
conclusions, summarising the contributions of the
study, its limitations and future research directions.
2 THEORETICAL FRAMEWORK
The use of social media has increased significantly in
recent years. This growth is evidenced by the increase
in the number of users and the frequency of
interactions on various platforms (Titisuk,
Vajarapongse & Thongwon, 2023). This involvement
with social media is not limited to social interactions;
it extends to various sectors, including education and
health, where they are used to disseminate
information and involve the community (Gatewood et
al., 2020; Rijal et al., 2024).
In this scenario, social media offer a dynamic and
participatory space that can be used to promote
inclusion. In fact, Katunga et al. argue that the
strategic use of social media can significantly
increase the reach and effectiveness of inclusion
initiatives (Katunga et al., 2019).
Social inclusion is a fundamental goal in modern
societies, aimed at ensuring that all individuals,
regardless of their personal or social characteristics,
have equal access to opportunities and resources
(World Bank, 2013). Social media, due to their
interactive and comprehensive nature, can be
effective tools for promoting this goal (Terry et al.,
2023; Katunga et al., 2019).
Platforms such as Facebook and Instagram, which
are already an integral part of many people's lives and
influence their modes of interaction, access to
information and social participation, have been used
by organisations, social movements and community
groups to disseminate messages of inclusion and
diversity, enabling them to reach a wide audience
(Ellison & Boyd, 2013, Katunga et al., 2019). In
addition, studies indicate that targeted campaigns and
content on social media can raise awareness of social
issues and foster a more inclusive environment.
(Katunga et al., 2019). Particularly in the context of
Inclusive Spaces (IS), the use of social media allows
more people to find out about the services available
and the benefits of assistive technologies, facilitating
their social and digital inclusion and improving their
quality of life (Katunga et al., 2019; Rocha Lourenço
et al., 2023).
IS are environments designed to promote the
inclusion of all people, eliminating barriers and
considering the diversity of needs (Palatna, 2019).
These spaces are accessible and usable by everyone,
regardless of their physical, sensory or cognitive
abilities, fostering active social participation,
integration, equal opportunities and a sense of
belonging, which are essential for the well-being and
quality of life of People with Disabilities (PwD)
(Rocha Lourenço, Oliveira & Tymoshchuk, 2024;
Hung et al., 2021; BDU, 2024). IS can take many
forms and functions, including disability support
associations, digital inclusion centres, education and
rehabilitation cooperatives, medical and technology
centres, which provide essential approaches, services
and resources to support the autonomy, accessibility
and well-being of PwD.
However, the potential of social media to promote
inclusion depends on how they are used. Creating
relevant and engaging content is crucial to capturing
the public's attention and encouraging participation
(Kaplan & Haenlein, 2010; Katunga et al., 2019).
Content that meets the needs and interests of the
community is more likely to generate response and
engagement, facilitating communication and active
participation (Katunga et al., 2019). It is also
important to tailor content to the target audience and
adapt it to their needs, using accessible formats and
languages that are representative of the target
audience's experiences. Finally, it is important to post
consistently and regularly, to use visual and
interactive media to increase the attractiveness and
clarity of messages, and to integrate user feedback
(Katunga et al., 2019).
However, there is a gap in research into how IS
specifically uses Facebook and Instagram to achieve
its goals. There is a lack of systematic understanding
of which types and formats of content are most
effective for engaging communities, raising
awareness and promoting social and digital inclusion.
3 METHODOLOGY
3.1 Research Design
To explore IS's use of social media, this study adopts
a mixed-methods approach, combining quantitative
techniques to record reach and interaction metrics,
and qualitative techniques, focusing on content
analysis to explore how the content shared on IS's
Facebook and Instagram pages can promote
inclusion.
3.2 Sample
The sample consisted of 16 IS, recognised for their
work in promoting the social and digital inclusion
PwD, including Disability Support Associations (5),
ICT4AWE 2025 - 11th International Conference on Information and Communication Technologies for Ageing Well and e-Health
142
Digital Inclusion Resource Centers (2), ICT Resource
Center (2), Social Inclusion Support Center (1),
Cooperative for the Education and Rehabilitation of
People with Disabilities (1), Medical and
Rehabilitation Centre (1), Technology and Innovation
Centre (1), Telecommunications Company (1) and
Assistive Technology, Occupational Performance
Laboratory (1) and Assistive Technology Developer
(1).
15 of these spaces are present on Facebook and 9
on Instagram. The criteria for selecting the pages
included: i) being official IS pages that promote
inclusion; ii) relevance to the topic; iii) being pages
from IS located in Portuguese-speaking countries; iv)
availability of publicly accessible data for analysis.
To ensure the anonymisation and confidentiality
of the data collected, the IS participating in this study
were identified and coded using the letters A to P.
3.3 Data Collection and Analysis
Data collection for this study was carried out
exclusively from the posts available on IS's public
Facebook and Instagram pages. The approach was
structured to capture shared content, identify
publication patterns and assess the impact of these
practices.
To this end, data collection was divided into five
stages. The first stage was to select the IS that were to
be analyzed.
This was followed by an analysis of the presence
of these spaces on the social media Facebook and
Instagram, to understand which of these platforms
these IS are active on.
The third step was to collect and record the
dynamics and metrics of each space on the two
platforms, according to the data publicly available on
each of them. The role of social media marketing
dynamics and metrics is crucial for evaluating the
effectiveness of campaigns, as well as optimising
strategies (Kočišová & Štarchoň, 2023). Thus, with
the goal of understanding the social media
performance of the IS pages participating in the study,
the following reach metrics were analysed: number of
followers on Facebook, and number of followers and
total posts on Instagram; and the following interaction
metrics: total number of posts, total likes, total
comments, total shares (Facebook only), total
interactions (likes + comments + shares (Facebook
only)), average likes per post, average comments per
post, average shares per post, and Engagement Rate
(ER). To facilitate this analysis, a time window was
set for the analysis period (April 2024) - the month
before the month in which the analysis began - which
allowed for focused, up-to-date and detailed
observation of communication activities and
provided a sample significant enough to identify
patterns and trends in platform dynamics.
ER is a social media metric that measures how
much of a given page's audience actively engages
with the page's content in relation to the reach or size
of the audience. It includes likes, comments, shares,
saves and other actions - but excludes views. High ER
reflects audience interest and builds trust with first-
time visitors to a social profile (Newberry, 2024). The
ER was calculated according to the interactions that
the researcher can access, without using any social
media analysis tools, as follows:
To optimise communication and engagement on
digital platforms, it's important to understand not only
the dynamics and metrics of interaction, but also the
nature and type of content shared (Peruta & Shields,
2017), to understand which types of content generate
the most and least engagement. To do this, in a fourth
stage, all the posts made on the selected pages during
the period of analysis were collected, and in the last
stage, through direct observation of the posts made on
the two platforms during the period of analysis, the
type of content (image, video, text, infographic, etc.),
goal of the content (informative, educational,
promotional, etc.), and engagement indicators (likes,
comments and shares) were recorded for each post. It
is important to clarify that the accessibility of these
platforms has not been assessed.
The data collected was subjected to a manually
conducted qualitative content analysis. To do this,
each post was classified according to its content type
(content format, which can be image, video, link or
event) and goal (purpose of the content), according to
the categories defined in the table below (Castillero-
Ostio et al., 2024; Rossi et al., 2024) (Table 1).
The definition of these categories was inspired by
previous studies on content analysis in social media
(Castillero-Ostio et al., 2024; Rossi et al., 2024),
which identify different publication purposes in
digital communication and content analysis contexts.
These studies identified different publication
purposes used by organisations and communities to
inform, engage and mobilise the public, serving as a
reference for the initial development of the
categories. It was noted that the purposes found in
these studies broadly reflected the main publication
intentions identified. Based on this, the description of
each category was adjusted and adapted to the context
Social Media as a Tool for Promoting Inclusion: An Analysis of the Facebook and Instagram Pages of Inclusive Spaces
143
of the present study, resulting in the list of categories
presented (Table 1).
Table 1: Content goals and description.
Content goal Description
Informative
Content that educates or provides
useful information.
Promotional
Advertisements for products, services
or events
p
romoted b
y
the centre.
Educative
Materials that teach or guide the
p
ublic on a topic.
Inspirational
Motivational or thought-provoking
messa
g
es.
Testimonial Customer/user testimonials or stories.
Cultural
Content that promotes local or global
culture.
Record
Content whose goal is to show or
record an event or activity that has
taken place, highlighting what has
happened, without a promotional
focus.
Solidary
Content with the goal of mobilising
the
p
ublic for social solidarit
y
actions
After this classification, interaction metrics were
recorded for each type of content and goal, including
the number of likes, number of comments and, in the
case of Facebook, the number of shares, a metric that
cannot be ascertained on Instagram, as well as the
total number of interactions. These interactions were
compared, providing an insight into which
combinations and types of content generated the most
or least interactions on the platforms analyzed, and
making it possible to identify patterns and trends in
the content published.
The study followed ethical principles, ensuring
that only publicly available data was used, and that no
personal or sensitive user information was used. The
pages analyzed were treated anonymously.
4 RESULTS
4.1 Presence of Inclusive Spaces on
Facebook and Instagram
A criterion was established that each space must have
recorded activity on the platforms in the last 12
months to be considered present on social media.
Therefore, all Facebook and Instagram pages that
have not recorded any activity in the last year were
considered inactive.
The results of analysing the presence of the 16 IS
on Facebook and Instagram indicate a significant
digital presence on both platforms, where 94% of the
spaces (15 out of 16) are active on Facebook and 56%
(9 out of 19) on Instagram and have registered activity
in the last year (between April 2023 and April 2024).
44% (7 out of 16) of IS do not use Instagram and 56%
(7 out of 16) of spaces are active on both platforms.
Table 2 shows the results of each IS social media
presence.
Table 2: Presence of the IS analysed on the social media
Facebook and Instagram.
IE Faceboo
k
Instagram
A Active Active
B Active Inactive
C Active Active
D Active Active
E Active Active
F Active Active
G Active Active
H Active Inactive
I Active Inactive
J Active Active
K
Active Active
L Active Inactive
M Inactive Inactive
N Active Active
O Active Inactive
P Active Inactive
4.2 Metrics for the Reach and
Interaction of Inclusive Spaces
4.2.1 Reach Metrics
On Facebook, the number of followers varies widely,
with figures ranging from 38 followers to 159,000
followers. Of note is Space D with the largest
follower base (159,000 followers), followed by J
(60,000 followers) and Space C (13,000 followers).
In contrast, some of the pages analysed have a smaller
number of followers. Examples are Space N (38
followers), Space O (454 followers), and Space L
(835 followers). On this platform, there is a
concentration of spaces with between 1,000 and 7,000
followers, suggesting that most have a moderate
reach.
On Instagram, the number of followers ranges
from 271 to 12,100, while the total number of posts
ranges from 56 to 2,419. Space D also leads on this
platform, with 12,100 followers and 1,042 posts,
followed by Space J, with 9,119 followers and the
highest number of posts (2,419 posts), and Space E
with 2799 followers and 621 posts. With the fewest
followers and activity are Space G (271 followers and
168 posts) and Space A (760 followers and 56 posts).
The spaces with 0 followers are those that are not
present on the platforms.
ICT4AWE 2025 - 11th International Conference on Information and Communication Technologies for Ageing Well and e-Health
144
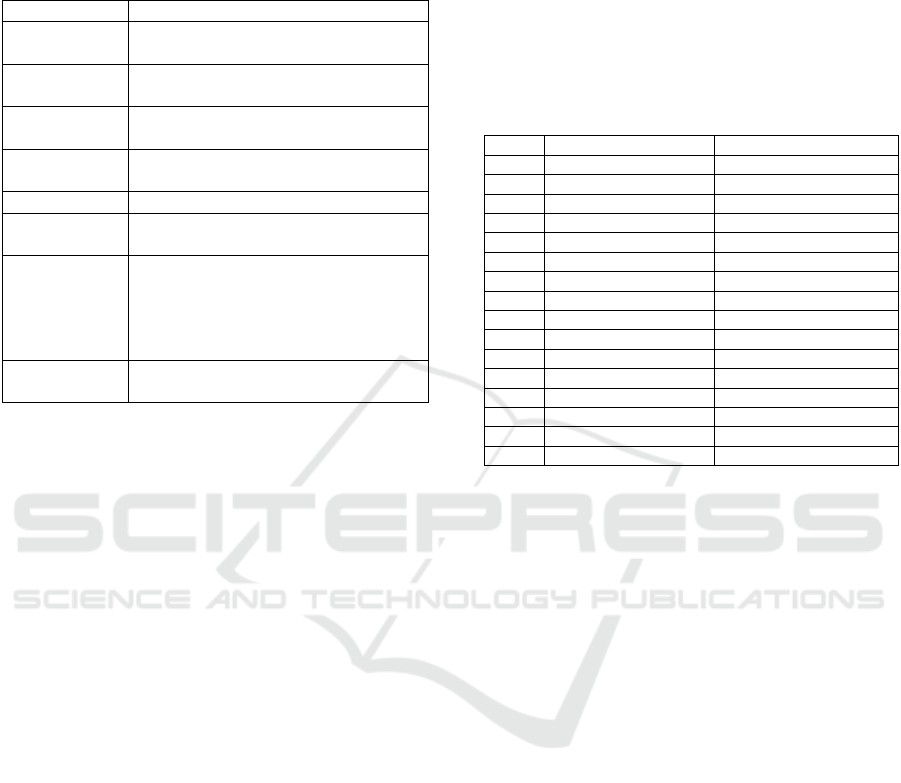
The graphs below show the distribution of
inclusive spaces on Facebook (Figure 1) and
Instagram (Figure 2), based on the number of
followers.
Image 1: Distribution of Inclusive Spaces on Facebook.
Image 2: Distribution of Inclusive Spaces on Instagram.
It is possible to observe that, on Instagram, spaces
with a higher number of posts tend to have a higher
number of posts.
4.2.2 Interaction Metrics
Regarding Facebook interaction metrics, it can be
seen in Tables 3 and 4 that 4 of the spaces present on
this platform did not publish or obtain any
interactions on Facebook during the period analysed.
The remaining pages (A, B, C, D, E, F, G, I, J, K, N)
received likes, comments and shares, with Space J
standing out as having a significantly higher number
of likes on its posts than any other page (1634 likes
on 14 publications). It also has the highest number of
total interactions (sum of likes + comments + shares)
and the highest number of likes per post. Space C has
the highest number of comments (73 comments on 21
publications - 3.5 comments per post), and D the
highest number of shares per post (239 shares on 26
publications - an average of 9 shares per post). Apart
from the pages that didn't register any activity during
the period analysed, Space B's page received the
fewest likes and comments (along with Space I) (23
likes and 0 comments on 2 posts), and Space N
received the fewest shares (4 shares on 7 posts).
Also on Facebook, the number of posts in the
period analysed varies between 2 and 33 posts, with
Space G and F standing out as having a significant
number of posts (33 and 32 posts) and higher
publication frequencies. Space B has the lowest
number of posts (2) and, consequently, the lowest
frequency of publication.
It is also possible to observe that the pages with
the highest number of posts are not the ones with the
highest number of interactions, which suggests that
the number of posts does not necessarily guarantee
greater engagement. In fact, the highest number of
interactions was achieved by a space with a
publication frequency of 0.47 posts per day (Space J).
In relation to the ERs, the highest engagement rate
is that of Space N, which is completely
disproportionate to the ERs of the pages of the other
spaces, none of which is higher than 1%. This figure
may be influenced by the small size of the community
and shows that the small follower base of this page is
highly engaged. After this page, the pages in spaces
B and K have the highest ER. On the other hand, the
lowest ER corresponds to space D, one of the pages
with the highest number of posts and interactions,
which indicates that although there are a significant
number of likes, comments and shares, these
interactions are low in relation to the number of
followers.
The tables below summarise the results relating to
the number of posts, total number of likes, comments
and shares, and total interactions (Table 3), and the
average number of likes, comments and shares per
post, and the engagement rate on Facebook (Table 4).
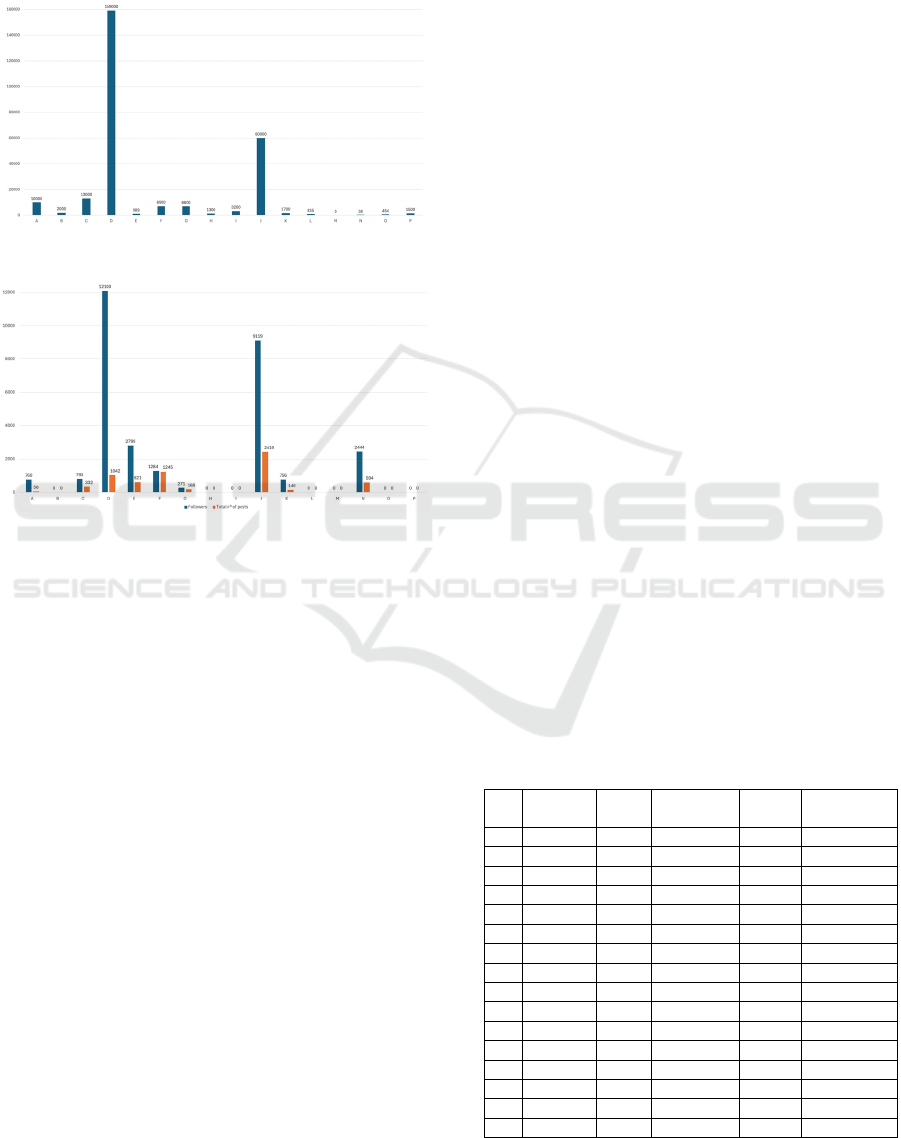
Table 3: Facebook interaction metrics during the analysis
period (number of posts, total likes, comments, shares and
total interactions).
IE
Number
of posts
Total
likes
Total
comments
Total
shares
Total
interactions
A 6 184 1 10 195
B 2 23 0 5 28
C 21 775 73 80 928
D 26 848 26 239 1113
E0 0 0 0 0
F 32 771 42 163 976
G 33 404 35 50 489
H0 0 0 0 0
I 25 73 0 34 107
J 14 1634 12 102 1748
K
968 1 8 77
L0 0 0 0 0
M- - - - -
N 7 145 4 4 153
O0 0 0 0 0
P0 0 0 0 0
Social Media as a Tool for Promoting Inclusion: An Analysis of the Facebook and Instagram Pages of Inclusive Spaces
145

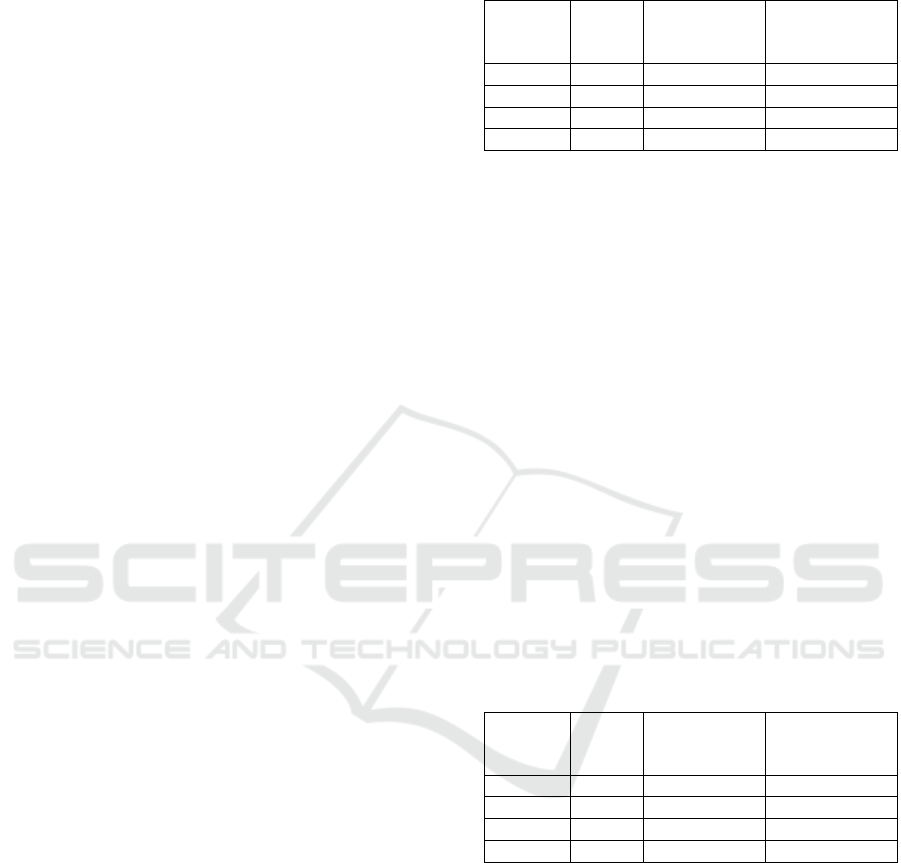
Table 4: Facebook interaction metrics during the analysis
period (average likes, comments and shares per post, and
engagement rate).
IE
Average
likes per
pos
t
Average
comments
per pos
t
Average
shares
per pos
t
Engagement
rate
A 30,6 0,16 1,6 0,30%
B 11 0 2,5 0,70%
C 36,9 3,5 3,8 0,30%
D 32,6 1 9,2 0,02%
E 0 0 0 0%
F 24,1 1,3 5,1 0,40%
G 12,2 1,1 1,5 0,20%
H 0 0 0 0%
I 2,9 0 1,4 0,10%
J 116,7 0,9 7,3 0,20%
K
7,6 0,1 0,8 0,50%
L 0 0 0 0%
M - - - -
N 20,7 0,6 0,6 57,50%
O 0 0 0 0%
P 0 0 0 0%
Regarding Instagram, it can be observed in Tables
4 and 5 that one of the spaces on this platform did not
receive any interactions during the period analysed,
as no content was published during that time. The
remaining pages (C, D, E, F, G, J and K) received
several likes and comments (Table 4). The Space D
page is the one with the most public interaction and
the highest number of likes and comments (2677 likes
and 98 comments on 33 posts), followed by the Space
J page, with a large number of likes (2470 likes on 14
posts).Except for the pages that didn't register any
activity during the analysis period, the page that
received the fewest likes and comments was Space K
(210 likes and 2 comments on 7 posts).
The number of posts in the period analysed varies
between 7 and 33 posts, with Space D standing out,
as on Facebook, with 33 posts (more than 1 per day),
and Space F with 30 posts (1 per day).
On the other hand, Space O has no posts at all, and
Space K has the fewest posts (7) and, consequently,
the lowest frequency of publication.
Unlike Facebook, on Instagram the page with the
highest number of posts is also the page with the
highest number of interactions (Space D). However,
the other pages with a high posting frequency don't
have the highest interaction numbers. In fact, the
second highest number of interactions was obtained
by a space with a publication frequency of 0.47 posts
per day (Space J).
Regarding ER on Instagram, the Space K page has
the highest ER of 4% with an average of 30 likes per
post. This shows that the content is engaging, despite
the smaller number of posts (7). In addition, Space C's
page also has a high ER of 3.60 per cent, with an
average of 28.4 likes per post, showing a good
amount of interaction for the size of its audience.
The tables below summarise the results relating to
the number of posts, total number of likes and
comments, and total interactions (Table 5), and the
average number of likes and comments per post, and
the engagement rate on Facebook (Table 6).
Table 5: Instagram interaction metrics during the analysis
period (number of posts, total likes and comments, and total
interactions)
IE
Number of
posts
Total
likes
Total
comments
Total
interactions
A- - - -
B- - - -
C 14 398 7 405
D 33 2677 98 2775
E 9 302 18 320
F 30 653 18 671
G 26 443 13 482
H- - - -
I- - - -
J 14 2470 6 2476
K
7 210 2 212
L- - - -
M- - - -
N0 0 0 0
O- - - -
P- - - -
Table 6: Instagram interaction metrics during the analysis
period (average likes and comments per post, and
engagement rate).
IE
Average
likes per pos
t
Average comments
per pos
t
Engagement
rate
A- - -
B- - -
C 28,4 0,5 3,60%
D 81,1 2,97 0,70%
E 33,5 2 1,30%
F 21,8 0,6 1,70%
G 17,04 0,5 1,78%
H- - -
I- - -
J 177 0,43 1,90%
K
30 029 4%
L- - -
M- - -
N 0 0 0%
O- - -
P- - -
All IS that use Instagram also use Facebook, and
there is only one space that only uses Instagram (E).
Overall, although Instagram is the platform with
the least presence, it generates more interaction from
the public (a total of 7210 interactions in the period
analysed) than Facebook (a total of 5814 interactions
ICT4AWE 2025 - 11th International Conference on Information and Communication Technologies for Ageing Well and e-Health
146
in the period analysed), and the ERs are also higher,
highlighting the effectiveness of this platform.
In terms of publications, most spaces have more
content on Facebook (A, B, C, F, G, I, K, and N).
Only for two Spaces (D and E) is Instagram the
platform with more publications, and in Space J, the
number of publications on Facebook is equal to that
on Instagram.
4.3 Content Shared on the Pages of
Inclusive Spaces
This section presents the results of the content
analysis and is divided into 3 sub-sections: type of
content, goals of the content, and finally the overall
results of the content analysis.
It is important to note that the content of one of
the IS (J) was not included in the analysis due to its
lack of compliance with the established social and
digital inclusion criteria. Although this institution
operates as a Social Subsidiary and was created by a
Main Structure (Parent Company), both share the
same social media page. However, the content
published by the Main Structure does not promote
social and digital inclusion and therefore does not
meet the selection criteria defined for this
investigation. Therefore, the entire analysis of the
content published on this institution's Instagram and
Facebook pages was disregarded.
4.3.1 Type of Content
Throughout this study, four main types of content
were identified on the social media of the IS studied,
namely: image, video, links and events. Regarding
the latter two types of content: links are only accepted
on Instagram stories, which were not analysed in this
study; and events are a feature that does not exist on
Instagram.
On Facebook, images have the highest volume of
posts (139) and interactions (3699), representing
higher total and average engagement. Videos,
despite fewer posts (13), have a good level of average
engagement (12.85 interactions per post). Links and
events are not as common and consequently have
fewer interactions (Table 7).
6 of the 10 spaces that posted on Facebook in the
period analysed published videos; 10 published
images; 2 published links; and 1 published an event.
Table 7: Metrics related to the type of content published by
EI on Facebook.
Type of
content
Total
posts
Total
interactions
Average
interactions
p
er post
Image 139 3699 20,9
Video 13 331 12,85
Lin
k
8 64 10,4
Event 1 14 14
On Instagram, images also dominate in terms of
number of posts (103) and total interactions (4044).
Unlike Facebook, videos have a higher average
engagement on Instagram (43 interactions per
post), confirming Instagram's receptiveness to videos
(Table 8).
This platform has less content published
compared to Facebook, but it has more total
engagement (4044 interactions on images and 857 on
videos) and average engagement (29.3 interactions
per image and 43.15 interactions per video).
However, in terms of audiovisual content, it was on
Instagram that IS published the most videos (16)
during the period analysed, and with the most
interactions (Table 8).
The predominant type of content on both
Facebook and Instagram is images.
4 of the 7 spaces that published on Instagram in
the period analysed published videos and 7 published
images.
Table 8: Metrics related to the type of content published by
EI on Instagram.
Type of
content
Total
posts
Total
interactions
Average
interactions
p
er post
Image 103 4044 29,3
Video 16 857 43,15
Lin
k
00 0
Event 0 0 0
4.3.2 Content Goal
To present the main results of the content analysis of
the IS Facebook and Instagram pages, eight
categories of goals were defined that reflect the core
objectives of the content published on the IS
Facebook and Instagram pages (Table 1). These
categories range from promoting cultural events to
engaging in solidarity and disseminating relevant
information. Based on them, it was possible to
classify the predominant communicative intent of the
posts published during the period analysed, allowing
patterns and trends in IS use of social media to be
identified.
Social Media as a Tool for Promoting Inclusion: An Analysis of the Facebook and Instagram Pages of Inclusive Spaces
147
Regarding the content goals, the results show that:
Cultural posts had the goal of promoting or
celebrating historical or social events, such as, in
most posts of this type, the celebration of the
50th anniversary of the 25 April Revolution - an
event in Portugal's history resulting from a
political and social movement (Barreto &
Serrão, 2000).
Educational posts had the goal of sharing
knowledge and providing guidance to the public
on specific topics, namely, as was done by one
of the IS, explaining the importance of
occupational therapy in improving the quality of
life of PwD.
Informative posts provided useful data or
information, such as opening hours, instructions
on registering for courses or activities, global
data on access to health and information and
statistics on certain diseases.
The inspirational post was published on World
Autism Awareness Day, with the goal of
emphasising inclusion and the rights of people
with autism, with a motivational and reflective
message.
The goal of the promotional posts was to
disseminate events, services or initiatives,
namely: fundraising activities for IS; workshops
on useful information for the population; themed
meetings to aggregate and share information
relevant to PwD; talks; congresses; sports
activities; information sessions on entering the
labour market; courses on quality of life, literacy
for PwD; universal design workshops;
employment support programmes, etc.
The purpose of registration posts is to document
activities carried out, namely participation in
conferences, workshops, events, and other
activities in various areas of IS activity.
Solidarity posts were intended to mobilise the
public for support actions or highlight solidarity
initiatives carried out, such as the delivery of
hampers to needy families by one of the IS;
solidarity actions to collect equipment or
monetary funds for the IS; encouraging
donations, etc.
Testimonial posts presented real stories or
testimonies from people impacted by projects or
actions. An example of this category is an
account by a beneficiary of an employment
support programme, who shared how the
initiative helped him enter the job market. In
addition to this, other testimonial content has
also been published that also has a charitable
nature, and which are testimonies from people
with disabilities about the lack of freedom they
still have in the country where they live,
particularly in terms of access to the labour
market, culture or public services. These have a
charitable nature because they also call for
donations, with the aim of raising funds to fill
these gaps.
In terms of content, the most shared type of
content on IS social media was content with the goal
of registration (59 posts on Facebook and 46 on
Instagram) (Tables 9 and 10). In addition to this,
promotional content is also widely published on the
two platforms analysed, with Facebook standing out
(41 posts), while registration activity is lower on
Instagram (25 posts). Another content that stands out
in terms of publications is informative content (30
posts on Facebook and Instagram).
In terms of interactions, on Facebook, the content
that generated the most total interactions was
registration content (1,423 total interactions and an
average of 202.5 interactions per post) - with the
highest total engagement, followed by solidarity
content (961 interactions), which also has the highest
average number of interactions per post (244
interactions per post), promotional content (813
interactions and an average of 108 interactions per
post), and informative content (669 total
interactions), which also has a high average number
of interactions per post (134.5).
Promotional content has more interactions (and
also has more posts) - which facilitates this
engagement - so it has higher total engagement on
Facebook. However, considering that the highest
average number of interactions per post is for
solidarity posts, these are the ones with the highest
average engagement on Facebook, because in fewer
posts they have more interactions. The content with
the lowest engagement is inspirational (7
interactions) (Table 9).
Table 9: Metrics related to the goals of the content
published by IS on Facebook.
Content goal
Total
posts
Total
interactions
Average
interaction
s
p
er
p
ost
Cultural 1 20 20
Educational 6 81 35,3
Informative 30 669 134,5
Inspirational 1 7 7
Promotional 41 813 108
Recor
d
59 1423 202,5
Solidar
y
18 961 244
Testimonial 1 20 20
Testimonial
and solidar
y
4 84 21
ICT4AWE 2025 - 11th International Conference on Information and Communication Technologies for Ageing Well and e-Health
148

In terms of interactions on Instagram, the content
that generated the most total interactions and the
highest average number of interactions per post was
solidarity content (1,747 total interactions and an
average of 347.6 interactions per post), followed by
registration content (1,360 total interactions and an
average of 277 interactions per post), informative
content (635 interactions and an average of 249.4
interactions per post), and promotional content (603
total interactions and 102.1 interactions per post). It
can be concluded, then, that registration posts have a
higher total engagement on Instagram and
solidarity posts have a higher average engagement
on Instagram (they have more interactions for fewer
posts), because in fewer posts they have more
interactions. The content with the lowest engagement
is inspirational (23 interactions) (Table 10).
The predominant content goal on both Facebook
and Instagram is to record.
Table 10: Metrics related to the goals of the content
published by IS on Instagram.
Content goal
Total
posts
Total
interactions
Average
interaction
s
p
er
p
ost
Cultural 2 84 84
Educational 6 175 92,7
Informative 30 635 249,4
Inspirational 1 23 23
Promotional 25 603 102,1
Recor
d
46 1360 277
Solidar
y
14 1747 347,6
Testimonial 1 50 50
Testimonial
and solidar
y
4 224 56
4.3.3 Global Analysis
Table 11 shows the results for the metrics for each
type and goal of content on Facebook.
On Facebook, images with the goal of
registering are the ones with the highest number
of posts and the highest number of interactions,
achieving a higher total engagement. However, the
highest average engagement belongs to solidarity
images, as they have the highest number of
interactions for the fewest posts (Table 11).
The type of content most published on Facebook
is images with the goal of registration, published by 7
IS, followed by promotional images (published by 6
IS) and informative images (published by 6 IS).
Table 11: Metrics related to the type and goals of the
content published by IS on Facebook.
Type of
content
Content goal
Total
posts
Total
interact
ions
Average
interactions
per pos
t
Even
t
Solidary 1 14 14
Image Cultural 1 20 20
Image Educational 6 81 35,3
Image Informative 24 630 117,9
Image Inspirational 1 7 7
Image Promotional 37 653 68
Image Record 56 1384 163,5
Image Solidary 13 874 176,5
Image Testimonial 1 20 20
Lin
k
Informative 6 39 16,6
Lin
k
Record 2 25 25
Video Cultural 0 0 0
Video Informative 0 0 0
Video Promotional 4 160 40
Video Record 1 14 14
Video Solidary 4 73 53,5
Video
Testimonial
and solidary
4 84 21
Table 12 shows the results of the metrics for each
type and goal of content on Instagram.
On Instagram, images with the goal of recording
are the ones with the highest number of posts.
However, the highest average and total
engagement belongs to charity images, which have
the highest number of interactions and the highest
average number of interactions per post (Table 12).
The type of content most published on Instagram,
as on Facebook, are images with the goal of
recording, published by 5 IS, followed by
promotional images (published by 5 IS) and
informative images (published by 5 IS).
Table 12: Metrics related to the type and goals of the
content published by IS on Instagram.
Type of
content
Content goal
Total
posts
Total
interact
ions
Average
interactions
per pos
t
Even
t
Solidary 0 0 0
Image Cultural 1 10 10
Image Educational 6 175 92
Image Informative 16 400 131
Image Inspirational 1 23 23
Image Promotional 25 603 102
Image Record 42 1174 184
Image Solidary 11 1609 256
Image Testimonial 1 50 50
Lin
k
Informative 0 0 0
Lin
k
Record 0 0 0
Video Cultural 1 74 74
Video Informative 4 235 117
Video Promotional 0 0 0
Video Record 4 186 93
Video Solidary 3 138 91
Video
Testimonial
and solidary
4 224 56
Social Media as a Tool for Promoting Inclusion: An Analysis of the Facebook and Instagram Pages of Inclusive Spaces
149

Analysing the data reveals that most spaces adopt
a uniform publishing strategy, replicating the same
posts on both Facebook and Instagram. However,
there are functional differences that influence this
approach. For example, Instagram doesn't allow
direct sharing of links (in posts) or other users' posts
– features that are available on Facebook. On the
other hand, Instagram can feature more posts than
Facebook in some cases, due to the possibility of
publishing in partnership with other entities -
collaborative actions that Facebook does not directly
support. These limitations explain specific variations
in the content published on each platform.
5 DISCUSSION
The goal of this study was to understand how IS
Facebook and Instagram pages use different content
formats to promote their spaces and engage their
target audience.
The results show that most IS predominantly use
visual formats, especially images, to disseminate their
initiatives, record events and activities and promote
services and activities to support PwD, carers or other
stakeholders. Although videos are also published,
their frequency is considerably lower than that of
images. This trend partially contradicts more recent
literature, which emphasises the growing interest and
effectiveness of videos as a way of capturing the
public's attention and promoting deeper engagement,
arguing that in today's social media context, videos
are increasingly appealing and used to attract and
retain people's attention because of their potential to
convey complex messages in a dynamic way (Karol
& Norman, 2019; Zhou & Wang, 2014). In particular,
platforms like Instagram have been betting on short
video features, achieving even better engagement
than traditional pictures (Liang & Wolfe, 2022).
Nevertheless, this predominance of imagery
corroborates the literature that points to the
importance of visual appeal in capturing the public's
attention (Lazard & Mackert, 2015). In addition, the
preference for static images may be related to
practical factors such as the speed of creation, editing
and publication, as well as the possibility of
producing content with reduced resources, something
that is particularly important in many IS due to
limited budgets or teams.
Although there is potential for engagement with
videos, images remain the preferred resource for
communicating and illustrating IS services.
In general, it was found that the publications focus
on recording/documenting activities, events, etc.;
disseminating useful resources and services for the
disabled and non-disabled population; mobilising the
public for support actions or highlighting solidarity
initiatives carried out; and providing information for
the public. These strategies are in line with Kaplan
and Haenlein's (2010) argument that social media
function as participatory platforms that allow
organisations to strengthen ties with their audiences
through sharing focused on values and experiences
(Kaplan & Haenlein, 2010).
It was also found that charitable content tends to
generate a higher average number of interactions
(comments, likes and shares) per post, both on
Facebook and Instagram, and record posts also
achieve significant volumes of interactions on both
platforms, with more expression on Facebook. These
findings confirm previous studies which argue that
the emotional and relational dimension is decisive in
stimulating participation and interaction among
followers (Tuccini & Guidi, 2021), suggesting that
publications that mobilise empathy, solidarity and
personal identification tend to receive more feedback.
The results identified two main differences in
communication strategies between Facebook and
Instagram pages: i) the functionalities available on the
different platforms (for example, Instagram does not
allow direct sharing of links in posts, nor of posts by
other users. On the other hand, Instagram has the
possibility of creating publications in partnership
with other entities - an action that Facebook does not
directly support), which explain occasional variations
in the content published on each platform; and ii) the
difference between reach and engagement (although
the Facebook of some IS has a higher number of
followers, Instagram showed a higher average of
interactions.
These findings validate the notion that
communication strategies should be adapted to each
platform in order to optimise engagement and the
disseminating of IS goals (Nicolae, Rus & Tasente,
2023; Rüfenacht et al., 2021).
The engagement indicators varied depending on
the content, but also on the platform. While Facebook
had a higher total number of followers on some IS,
Instagram generally generated more proportional
interactions. On the other hand, there are IS with
smaller but highly engaged communities, which
suggests that the absolute number of followers is not
the only determining factor for the success of posts
(Peruta & Shields, 2017; Newberry, 2024).
In comparison with the research question, it can
be verified that the Facebook and Instagram pages of
the IS prioritise visual content above all else,
highlighting the use of images to record and
ICT4AWE 2025 - 11th International Conference on Information and Communication Technologies for Ageing Well and e-Health
150

disseminate activities, promote services and raise
public awareness of social and digital inclusion
issues, adapting the format (image, video, text) to the
functionalities of the platforms. However, on both
platforms, solidarity content tends to produce higher
levels of engagement, due to its strong emotional and
relational appeal. These formats and content
contribute to disseminating inclusive practices,
raising awareness and engaging the public, especially
when associated with clear language and accessibility
features.
In this way, Facebook and Instagram pages act as
communication tools, when aligned with inclusive
goals, which can increase the visibility of IS
initiatives and strengthen community involvement in
the cause of digital and social inclusion (Rocha
Lourenço, Oliveira & Tymoshchuk, 2023).
6 CONCLUSIONS
This study concludes that social media can effectively
contribute to promoting social and digital inclusion
by disseminating relevant resources, services and
information to PwD, carers and other interested
parties. However, the lower frequency of videos
reveals an opportunity for improvement, especially
given current trends in audiovisual content
consumption; and the potential of testimonial content,
capable of generating strong emotional identification,
could be exploited more systematically.
This work offers valuable contributions to
understanding the potential of social media in
promoting inclusion, highlighting the importance of
cohesive communication strategies adapted to the
characteristics of the platforms. To deepen the
effectiveness of these strategies, future studies should
include longer periods of analysis, the collection of
internal data (real reach, clicks on links) and
triangulation with other methodologies (interviews or
questionnaires) to capture the perspectives of the
management teams and audiences involved. It is
hoped that the recommendations presented here will
serve as practical guidance for other IS and similar
organisations to better explore the potential of social
media in building more inclusive and participatory
communities.
ACKNOWLEDGEMENTS
This work is financially supported by national funds
through FCT – Foundation for Science and
Technology, I.P., under the project
UIDB/05460/2020.
REFERENCES
Barreto, A., & Serrão, J. (Eds.). (2000). Dicionário de
história de Portugal. Vol. 9: Suplemento P/Z / António
Barreto ... (coordenadores) (Vol. 9). Figueirinhas.
BDU (2024). Espaços Inclusivos. BDU.
https://bdu.pt/solucoes/espacos-inclusivos/
Castillero-Ostio, E., Moreno-Cabanillas, A., & Castillo-
Esparcia, A. (2024). Comunicación y think tanks:
Valoración de la interactividad web de los laboratorios
de ideas latinoamericanos. Palabra Clave, 27(3), 1–35.
https://doi.org/10.5294/pacla.2024.27.3.2
Ellison, N. B., & Boyd, D. M. (2013). Sociality Through
Social Network Sites (W. H. Dutton, Ed.; Vol. 1).
Oxford University Press. https://doi.org/10.1093/
oxfordhb/9780199589074.013.0008
Gatewood, J., Monks, S. L., Singletary, C. R., Vidrascu, E.,
& Moore, J. B. (2020). Social Media in Public Health:
Strategies to Distill, Package, and Disseminate Public
Health Research. Journal of Public Health
Management and Practice, 26(5), 489–492.
https://doi.org/10.1097/PHH.0000000000001096
Hung, L., Hudson, A., Gregorio, M., Jackson, L., Mann, J.,
Horne, N., Berndt, A., Wallsworth, C., Wong, L., &
Phinney, A. (2021). Creating dementia-friendly
communities for social inclusion: A scoping review.
Gerontology and Geriatric Medicine, 7.
https://doi.org/10.1177/23337214211013596
Kaplan, A. M., & Haenlein, M. (2010). Users of the world,
unite! The challenges and opportunities of Social
Media. Business Horizons, 53(1), 59–68.
https://doi.org/10.1016/j.bushor.2009.09.003
Karol, K., & Norman, C. (2019). The rise of, and need for,
video in social media marketing. Journal of Education
Advancement & Marketing, 3(4), 316. https://doi.org/
10.69554/PCKH5100
Katunga, N., Njenga, J., Craffert, L., Audenhove, L. V., &
Marien, I. (2019). Using Social Media To Support
Community Development: A Case Study Of E-
Inclusion Intermediaries In Underprivileged
Communities Of South Africa. 2019 IST-Africa Week
Conference (IST-Africa), 1–10. https://doi.org/
10.23919/ISTAFRICA.2019.8764854
Kočišová, L., & Štarchoň, P. (2023). The role of marketing
metrics in social media: A comprehensive analysis.
Marketing Science & Inspirations, 18(2), 40–49.
https://doi.org/10.46286/msi.2023.18.2.4
Lazard, A. J., & Mackert, M. S. (2015). e-health first
impressions and visual evaluations: Key design
principles for attention and appeal. Communication
Design Quarterly, 3(4), 25–34.
https://doi.org/10.1145/2826972.2826975
Liang, S., & Wolfe, J. (2022). Getting a Feel of Instagram
Reels: The Effects of Posting Format on Online
Social Media as a Tool for Promoting Inclusion: An Analysis of the Facebook and Instagram Pages of Inclusive Spaces
151

Engagement. Journal of Student Research, 11(4).
https://doi.org/10.47611/jsrhs.v11i4.3600
Nicolae (Halep), C.-G., Rus, M., & Tasențe, T. (2023).
Institutional communication models and strategies
adapted to New Media. Ars Aequi, 12, 190–208.
https://doi.org/10.47577/10.1234/arsaequi.12.1.223
Palatna, D. (2019). Inclusive environment: Developing
integrated definition. Bulletin of Taras Shevchenko
National University of Kyiv. Social Work, (5), 20–23.
https://doi.org/10.17721/2616-7786.2019/5-1/4
Peruta, A., & Shields, A. B. (2017). Social media in higher
education: Understanding how colleges and universities
use Facebook. Journal of Marketing for Higher
Education, 27(1), 131–143. https://doi.org/
10.1080/08841241.2016.1212451
Rijal, S., Almaududi Ausat, A. M., & Siminto. (2024). The
Role of Social Media in Enhancing Social Awareness
and Community Participation in Education. Indo-
MathEdu Intellectuals Journal, 5(2), 2385–2398.
https://doi.org/10.54373/imeij.v5i2.1067
Rocha Lourenço, F., Oliveira, R., & Tymoshchuk, O.
(2023). Best-practices for developing effective
communication campaigns to promote assistive
technology resource centres. 3999–4008.
https://doi.org/10.21125/iceri.2023.1003
Rocha Lourenço, F., Oliveira, R., & Tymoshchuk, O.
(2024). Challenges and gaps in promoting inclusive
spaces: A study based on interviews. In A. Marcus, E.
Rosenzweig, & M. M. Soares (Eds.), Design, User
Experience, and Usability (pp. 116–129). Cham:
Springer Nature Switzerland.
https://doi.org/10.1007/978-3-031-61356-2_8
Rossi, N. A., Benavidez, M., Nuti, S. A., Hajiyev, Y.,
Hughes, C. A., & Pine, H. S. (2024). Viral voices: A
multi-platform analysis of tonsillectomy on social
media. International Journal of Pediatric
Otorhinolaryngology, 176, 111816. https://doi.org/
10.1016/j.ijporl.2023.111816
Rüfenacht, S., Woods, T., Agnello, G., Gold, M., Hummer,
P., Land-Zandstra, A., & Sieber, A. (2021).
Communication and Dissemination in Citizen Science.
Em K. Vohland, A. Land-Zandstra, L. Ceccaroni, R.
Lemmens, J. Perelló, M. Ponti, R. Samson, & K.
Wagenknecht (Eds.), The Science of Citizen Science
(pp. 475–494). Springer International Publishing.
https://doi.org/10.1007/978-3-030-58278-4_24
Terry, K., Yang, F., Yao, Q., & Liu, C. (2023). The role of
social media in public health crises caused by infectious
disease: A scoping review. BMJ Global Health, 8(12),
e013515. https://doi.org/10.1136/bmjgh-2023-013515
Titisuk, P., Vajarapongse, Y., & Thongwon, L. (2023). The
Impact of Using Social Media on the Mental Health of
Adolescents. International Journal of Current Science
Research and Review, 06(06). https://doi.org/
10.47191/ijcsrr/V6-i6-23
Tuccini, G., & Guidi, G. (2021). Il peso delle emozioni
nell’argomentazione sui social media. Em A. Cattani &
B. Mastroianni (Eds.), Competing, cooperating,
deciding: Towards a model of deliberative debate (1.
a
ed., pp. 119–127). Firenze University Press.
https://doi.org/10.36253/978-88-5518-329-1.11
World Bank. (2013). Inclusion Matters: The Foundation
for Shared Prosperity. The World Bank.
https://doi.org/10.1596/978-1-4648-0010-8
Zhou, L., & Wang, T. (2014). Social media: A new vehicle
for city marketing in China. Cities, 37, 27–32.
https://doi.org/10.1016/j.cities.2013.11.006
ICT4AWE 2025 - 11th International Conference on Information and Communication Technologies for Ageing Well and e-Health
152
