
Mathematical Modeling and Simulation for Optimizing Truck Dispatch
in Bulk Unloading Operations: A Case Study at the Port of Itaqui
Victor Jos
´
e Beltr
˜
ao Almajano Martinez
a
, Carlos Eduardo V. Gomes
b
,
Jo
˜
ao Augusto F. N. de Carvalho
c
, Francisco Glaubos Nunes Cl
´
ımaco
d
,
Jo
˜
ao Dallyson Sousa de Almeida
e
, Geraldo Braz J
´
unior
f
and Tiago Bonini Borchatt
g
N
´
ucleo de Computac
˜
ao Aplicada, Universidade Federal do Maranh
˜
ao (UFMA), S
˜
ao Lu
´
ıs, MA, Brazil
{victor.martinez, carlos.evg, augusto.joao}@discente.ufma.br,
{fra a.br
Keywords:
Logistics Optimization, Truck Pulling, Bulk Cargo Operations, Emission Reduction, Port Efficiency.
Abstract:
This paper addresses the optimization of truck pulling for bulk unloading operations at the Port of Itaqui, a
critical logistics hub in Brazil. The current manual process often leads to inefficiencies such as congestion,
delays, and increased emissions. To tackle these challenges, we propose a mathematical model for responsive
truck pulling to minimize queue imbalances considering emissions while maintaining operational efficiency.
A port activity simulator was developed to evaluate the model under various demand and supply scenarios,
comparing its performance against a benchmark algorithm replicating operator behavior. Results demonstrate
that the proposed model reduces truck congestion in the primary area by up to 50% without increasing unload-
ing times, offering a more balanced and sustainable approach. The findings enhance port logistics and provide
a framework for automating truck dispatch processes in bulk cargo operations. Future work involves integrat-
ing the model into real-world applications and extending its capabilities to multi-terminal environments.
1 INTRODUCTION
Maritime transport is the main means of transporta-
tion for global trade. It is the basis of international
trade due to its cost-effectiveness for moving large
amounts of goods over long distances. In fact, ac-
cording to the Review of Maritime Transport, 2024
(United Nations Conference on Trade and Develop-
ment, 2024), more than 80% of global trade by vol-
ume and approximately 70% by value is carried by
sea. According to projections by the International
Transport Forum 2023 (ITF, 2023), maritime freight
demand will double by 2050. Thus, the growth in de-
mand, together with larger vessel sizes, intensifies the
complexity of the operation, driving the need to im-
prove port infrastructure, logistics performance, and
efficient cargo handling.
a
https://orcid.org/0009-0001-8759-8927
b
https://orcid.org/0009-0007-0273-4373
c
https://orcid.org/0009-0004-1165-1228
d
https://orcid.org/0000-0002-1357-1318
e
https://orcid.org/0000-0001-7013-9700
f
https://orcid.org/0000-0003-3731-6431
g
https://orcid.org/0000-0002-3709-8385
The intensification in the complexity of port op-
erations, without proper planning, can lead to port
congestion, especially when unloading and reloading
cargo. This results in longer dwell times and creates
bottlenecks that disrupt the flow of goods, leading to
increased costs, delays, and inefficiencies throughout
the supply chain. Furthermore, congestion in ports
can drive up shipping freight rates, as observed in
the case of maritime trade in liquefied petroleum gas,
where supply and demand dynamics were strongly in-
fluenced by port efficiency (Xiwen Bai and Xu, 2022).
Real-time analysis of port congestion using vessel
tracking information reveals that congestion can ex-
tend port response times, affecting economic impli-
cations for stakeholders and necessitating better net-
work design (Xiwen Bai and Xu, 2024). The spatial
computable general equilibrium (CGE) model (Had-
dad et al., 2010) highlights that port costs act as trade
barriers, spreading the impact of congestion across
space and time and impacting regional growth and in-
equality.
The congestion of multiple services in container
ports, where different services interfere, can propa-
gate delays through port nodes and links, exacerbat-
ing the problem (Talley and Ng, 2016). The growth
Martinez, V. J. B. A., Gomes, C. E. V., N. de Carvalho, J. A. F., Clímaco, F. G. N., Sousa de Almeida, J. D., Braz Júnior, G. and Borchatt, T. B.
Mathematical Modeling and Simulation for Optimizing Truck Dispatch in Bulk Unloading Operations: A Case Study at the Port of Itaqui.
DOI: 10.5220/0013440500003929
Paper published under CC license (CC BY-NC-ND 4.0)
In Proceedings of the 27th International Conference on Enterprise Information Systems (ICEIS 2025) - Volume 1, pages 605-616
ISBN: 978-989-758-749-8; ISSN: 2184-4992
Proceedings Copyright © 2025 by SCITEPRESS – Science and Technology Publications, Lda.
605

in container traffic and the COVID-19 pandemic have
intensified congestion, making cargo transit times un-
certain and increasing freight rates, which requires
predictive models to help shipping companies adjust
their schedules (Talley and Ng, 2016).
Efficient cargo handling and coordination with the
interior are crucial, as congestion at port gates due
to high variability in truck arrivals can lead to un-
even resource utilization, which truck appointment
systems (TAS) aim to mitigate (Ram
´
ırez-Nafarrate
et al., 2017).
The Port of Itaqui serves as a central logistics hub
for the export of bulk solids and liquids. As one
of Brazil’s largest and most strategic ports, it faces
substantial operational challenges (see Figure 1). In
2022, the port achieved a historic milestone by han-
dling a record cargo volume of 33.61 million tons.
Of this total, 23 million tons were solid bulk, which
marked a significant increase of 19% compared to
the previous year. This substantial growth in cargo
throughput has added to the operational complexity
of the port, especially in managing the efficient flow
of trucks involved in the unloading process.
Figure 1: Port of Itaqui, on the west coast of the island (S
˜
ao
Marcos Bay), 11 km from S
˜
ao Lu
´
ıs (EMAP, 2024).
In the port of Itaqui, the current operation is man-
aged manually by a human operator who controls the
number of trucks to pull based on real-time observa-
tions of port conditions. Although this method has
been in place for years, the rapid growth in cargo vol-
ume has exposed its limitations. The manual nature of
the process can lead to inefficiencies such as delayed
responses, improper queue balancing, and periods of
under-utilization and overcrowding. These inefficien-
cies often result in bottlenecks, increased congestion,
and disruption of the smooth flow of trucks through
the port, ultimately affecting the overall productivity
of unloading operations.
To address these challenges, this work proposes
solutions that include:
1. A Novel Mathematical Model Developed to au-
tomate the truck-pulling process for bulk unload-
ing operations at the Port of Itaqui, optimizing
truck allocation to minimize queues while consid-
ering dock capacities and operational constraints
and incorporating the reduction of greenhouse gas
emissions into the optimization process.
2. A Real-Time Simulation Environment. De-
signed to test the model under various operational
scenarios dynamically, ensuring robustness and
adaptability.
3. First Evaluation of the Manual Truck-Pulling
Process in a Simulated Environment. The man-
ual truck-pulling strategy, provided by EMAP
(Maranh
˜
ao Port Administration Company), was
analyzed in a controlled simulation for the first
time.
The remainder of this paper is organized as fol-
lows. Section 2 reviews the relevant literature on port
congestion and the mathematical models used in lo-
gistics optimization, providing the foundation to un-
derstand this work. Section 3 provides a detailed
description of the problem, defining its key aspects.
Section 4 describes the methodology employed in the
study, including the definition of the object of study
and the data analysis conducted to develop the pro-
posed mathematical model (Section 5) and its vali-
dation environment (Section 6). Finally, Section 7
presents the results and discussion, while Section 8
concludes the paper by summarizing key findings and
highlighting potential directions for future research.
2 RELATED WORK
Mathematical modeling is essential to optimize the
distribution of trucks for unloading ships, address op-
erational challenges to increase efficiency, and mini-
mize polluting emissions. For example, Integer Lin-
ear Programming models can ensure that trucks are
loaded within their dimensional and weight capaci-
ties, considering factors such as the center of gravity
and minimizing the number of pallets. This is cru-
cial for practical applications in distribution compa-
nies (Alonso et al., 2017).
Other approaches focus on reducing greenhouse
gas emissions by optimizing berth allocation yard
block assignment, internal truck operations, and berth
allocation in container terminals (Karakas et al.,
2021). Furthermore, models such as cyclic queuing
and Markov decision processes can be used to op-
timize the size of transport fleets, including cranes
and trucks, to maintain stable port productivity and
ICEIS 2025 - 27th International Conference on Enterprise Information Systems
606

dynamic operational policies, as demonstrated with
empirical data from the Port of Balboa (Kang et al.,
2008).
The routing and scheduling of yard trucks be-
tween quay cranes and yard cranes have been op-
timized using binary integer programming models,
minimizing total operational costs and determining
the optimal number of yard trucks, thus improv-
ing the efficiency of container terminals (Tsai et al.,
2016). Furthermore, the spatial behavior of carri-
ers, particularly in repositioning empty trucks due to
trade imbalances, is modeled probabilistically to in-
crease transparency and operational planning, which
is vital for sustaining business in low-demand zones
(Boumahdaf et al., 2023). The truck sector optimiza-
tion (TSO) model evaluates the impact of investments
in fuel-saving technologies on life cycle greenhouse
gas emissions, highlighting the importance of com-
prehensive modeling in reducing environmental im-
pacts (Guerrero et al., 2013).
Ensuring load balance throughout the distribution
route is another critical aspect addressed by the Multi-
Drop Load Balancing Recovery Algorithm, which ad-
justs load arrangements to maintain compliance with
safety regulations and operational efficiency (Silva
et al., 2018). Integrated optimization problems in-
volving quay cranes and yard truck scheduling are
solved using mixed-integer programming models and
particle swarm optimization methods, which signifi-
cantly reduce computational complexity and improve
solution efficiency (Zhen et al., 2019).
Queuing models for unloading operations, consid-
ering different probability distributions, help deter-
mine the optimal number of trailers, ensuring robust-
ness and cost-effectiveness in unloading processes.
The interaction between strategic location and tactical
inventory/transport decisions is modeled using non-
linear mixed-integer models, which explicitly detail
load costs and demonstrate significant savings when
inventory decisions are integrated into facility loca-
tion planning (Sıla C¸ etinkaya and
¨
Uster, 2014).
Although various mathematical models have been
developed to optimize truck distribution in port op-
erations, most existing approaches focus on general
aspects such as routing, scheduling, or load balanc-
ing, often designed for container terminals or spe-
cific transportation scenarios. Thus, there is a no-
table gap in the literature regarding the automation
of truck-pulling processes for unloading bulk solids
in ports. Specifically, no studies have been identi-
fied that address truck-pulling optimization consid-
ering the unique operational characteristics of bulk
unloading, such as responsive queue management,
dock-specific constraints, and environmental impacts.
This work addresses this gap by proposing a
novel mathematical model tailored to automate truck-
pulling for bulk unloading operations. Unlike exist-
ing approaches, our model integrates real-time queue
balancing with reducing carbon emissions. By focus-
ing on the specific context of the Port of Itaqui, the
proposed model offers a practical solution to improve
efficiency and sustainability in bulk port operations.
3 PROBLEM DESCRIPTION
At the Port of Itaqui, trucks unload cargo from ships
with the assistance of mobile cranes and hoppers.
When new empty trucks arrive for unloading, they
first proceed to an External Yard located outside the
port, where they wait to be called in for unloading.
Once the operator registers a dispatch signal (or pull
signal), the selected trucks move from the External
Yard to the Truck Retention Yard within the port area.
In this yard, they undergo preparations for the next
stage, which includes activities such as weighing and
verifying their readiness for unloading.
Figure 2: Illustration of Port Unloading Operation.
Once ready, the trucks pass through the Access
Gate, entering the Primary Area of the port, where
they line up to unload the cargo from the ships. Af-
ter receiving the cargo, the trucks leave the Primary
Area and head toward the Customer, where the cargo
is delivered. This process repeats as new trucks are
scheduled from the External Yard, ensuring continu-
ous unloading and cargo delivery operations. Figure
2 shows the main stages of this process, from the Ex-
ternal Yard to Customer Delivery.
Since the External Yard cannot be relocated inside
the port due to the high value of the land for other
uses, there needs to be a more consistent approach to
the decision to “pull” trucks. This is important, given
the current operational circumstances. A longer re-
sponse time for trucks arriving at the port after being
dispatched means that underestimating the number of
trucks to call could disrupt the flow of trucks in the
main area, affecting the unloading operations. On the
other hand, overestimating could lead to congestion.
Mathematical Modeling and Simulation for Optimizing Truck Dispatch in Bulk Unloading Operations: A Case Study at the Port of Itaqui
607

The current truck-pulling system is operated man-
ually, with an operator determining the number of
trucks to dispatch for each Modal Window — a com-
bination of customer, product, and shipment—based
on real-time observations of port conditions. While
this method has been in place for years, the rapid
growth in cargo volume has revealed its limitations.
The manual nature of this process can lead to delayed
responses, improper queue balancing, and periods of
under-utilization and overcrowding. These inefficien-
cies often result in bottlenecks, increased congestion,
and disruptions to the smooth flow of trucks through
the port, ultimately impacting the overall productivity
of unloading operations.
4 METHODOLOGY
The methodology applied in this study begins with the
definition of the object of study, followed by the anal-
ysis of port data, the development of a mathematical
truck-dispatching model, and finally, the implementa-
tion of a simulator for validation and comparison of
the model, as seen in Figure 3. Each step is detailed
in the following sections.
Analysis of
Port Data
Problem
Formulation
Object of
Study
Mathematical
Modeling
Model
Validation
METHO DOLO GY
Figure 3: Methodology Diagram.
4.1 Object of Study and Formulation
To gain a comprehensive understanding of the bulk
unloading operations at the Port of Itaqui, extensive
interactions were undertaken with key stakeholders.
Meetings with managers and operators provided valu-
able insights into the behavior of vehicle flows under
various scenarios. Additionally, field visits were con-
ducted to observe real unloading operations, ensuring
that the analysis reflects practical realities. Based on
these observations, key concepts were identified and
defined:
• Truck Flow. The movement of trucks throughout
the stages of the process, starting with their arrival
at the External Yard and ending with the delivery
of the cargo to the client’s location. The smooth-
ness of this flow ensures the continuity of unload-
ing operations without creating bottlenecks.
• Modal Window. Refers to a record in the port’s
system associated with a client contract. Each
window is linked to a ship, a product type, a client,
and a set of trucks authorized to unload within that
window. Typically, the client hires a company to
deliver their product. In that case, the trucks be-
longing to that company/client only unload within
the designated window for which they were con-
tracted.
• Dispatch (or Pull). Denotes authorization for a
truck in the External Yard to begin the unload-
ing process at its designated modal window. The
unloading process follows a First In, First Out
(FIFO) strategy, meaning that the truck that has
been waiting the longest is prioritized, provided it
is aligned with the designated modal window.
Thus, the dispatching problem can be defined as
determining the optimal number of trucks to be pulled
at this moment to ensure the smoothness of truck flow
across all windows until the next pull. The port oper-
ates with a set of active ships (S), where each ship is
linked to a set of modal windows (W
s
). Each modal
window, in turn, stores the real-time quantity of trucks
at each process step.
4.2 Analysis of Port Data
A detailed analysis was conducted using data pro-
vided by EMAP (Maranh
˜
ao Port Administration
Company). These data included comprehensive
records of truck flow within the port and the pulling
strategy currently employed to address varying de-
mand scenarios. Key documents reviewed contained
historical data on truck movements, as well as sug-
gested strategies for different operational contexts.
The dispatching suggestions are summarized in Table
1.
In addition to the dispatch strategies, the historical
data provided by EMAP included detailed records of
truck movements at each stage of the unloading pro-
cess. This data highlighted the number of trucks at
various points in the flow, the average time spent in
each phase, and an overview of the pulling operations
performed by human operators.
These data sets were critical for developing the
proposed model and for constructing benchmark al-
gorithms (Section 5). Furthermore, they served as the
foundation for refining the model validation environ-
ment (Section 6), ensuring that the proposed solutions
were well-aligned with real-world operational scenar-
ios at the Port of Itaqui.
ICEIS 2025 - 27th International Conference on Enterprise Information Systems
608

Table 1: Pulling suggestions across various scenarios.
Ships Open windows Suggested Maximum
1
1 15 60
2 9 30
3 6 20
4 5 15
5 5 12
2
1 15 30
2 6 15
3 5 10
4 5 8
5 3 6
3
1 8 20
2 6 10
3 5 7
4 5 5
5 3 4
5 MATHEMATICAL MODELING
The problem of dispatching trucks for unloading solid
bulk materials can be modeled as an integer pro-
gramming problem, as it is well-suited for handling
discrete search spaces and complex constraints. In
this context, a mathematical decision model for truck
dispatch was developed to balance queue sizes re-
sponsively in the primary area while minimizing total
truck emissions.
This model aims to coordinate the pulling of
trucks from the External Yard to the primary area,
considering the status of each modal window. The ob-
jective is to ensure that all active windows are served
balanced, considering their respective truck flows,
preventing equipment idleness and bottlenecks while
minimizing congestion in the primary area and reduc-
ing the volume of pollutants released into the environ-
ment.
5.1 Responsive Truck Dispatching
Model
Consider the decision variable x
sw
∈ Z
+
0
representing
the number of trucks to be dispatched to a window
w ∈ W of ship n ∈ N. The objective function is de-
fined as shown in Equation 1.
min
|S|
∑
s=1
|W
n
|
∑
w=1
P x
sw
+Q
|S|
∑
s=1
|W
n
|
∑
w=1
L
sw
|x
sw
+ T
sw
− F
sw
Min
Queue
|
W
active
(1)
The first term of the objective function aims to
minimize the total carbon emissions of trucks. The
second term seeks to minimize the imbalance in
queue sizes for each window by reducing the differ-
ence between the actual and ideal queue sizes based
on the current truck flow.
The parameter P represents the average expected
emissions for a vehicle to complete the cycle, while Q
is the penalty factor associated with the imbalance of
the queues. Thus, P and Q are, respectively, propor-
tional to the penalty related to carbon emissions and
the lack of responsiveness in queue balancing.
Furthermore, L
sw
, calculated as the number of
trucks available for pulling in the External Yard for
that window divided by Min
Queue
, represents the re-
duction of the penalty associated with a window hav-
ing reduced truck availability for pulling in the Ex-
ternal Yard. Thus, the queue size is dynamically
adjusted by considering truck availability in the Ex-
ternal Yard and the vehicle flow F
sw
in the primary
area for that specific window. These factors ensure
the model’s responsiveness. Other parameters of the
model are summarized in Table 2.
To ensure the integrity of the model regarding
truck pulling, the model must respect the following
constraints:
x
sw
≤ SUPPLY
sw
∀s ∈ S, ∀w ∈ W
s
(2)
Constraint (2) ensures that the number of trucks dis-
patched does not exceed the available trucks in the
External Yard (SUPPLY
sw
) for a given window w of
ship s.
x
sw
≤ Max
queue
− T
sw
∀s ∈ S, ∀w ∈ W
s
(3)
Constraint (3) ensures that the number of trucks dis-
patched to a window w remains below the maximum
queue size to prevent congestion. The dispatch value
is restricted to the difference between the maximum
queue size (Max
queue
) and the number of trucks (T
sw
)
that have already been called but have not yet com-
pleted the cargo collection.
|W
s
|
∑
w=1
x
sw
≤ Max
berth
−
|W
s
|
∑
w=1
T
sw
∀s ∈ S (4)
Constraint (4) ensures that the total number of trucks
assigned for the unloading of a ship s does not exceed
the maximum vehicle capacity of the ship (Max
berth
),
considering the number of vehicles already in opera-
tion (T
sw
). This prevents the over-allocation of trucks
to a single ship, avoiding congestion at the berths.
|S|
∑
s=1
|W
s
|
∑
w=1
x
sw
≤ Max
port
−
|S|
∑
s=1
|W
s
|
∑
w=1
T
sw
(5)
Constraint (5) ensures that the total number of trucks
dispatched for all operations does not exceed the
port’s capacity limit (Max
port
).
Mathematical Modeling and Simulation for Optimizing Truck Dispatch in Bulk Unloading Operations: A Case Study at the Port of Itaqui
609

Table 2: Summary of Objective Function Model Parameters.
Parameter Description
P Constant associated to the Expected Emissions for a truck to complete a cycle
Q Constant associated with the General Penalty attributed to queue imbalance
R Sufficiently Large Constant associated with slack variables
L
sw
Penalty reduction factor associated with a window having vehicle unavailability for pull
F
sw
Balancing factor proportional to the truck flow.
T
sw
Number of Trucks in transit to the port or waiting for collection in the Primary Area
W
active
Number of Active Windows across all ships
SUPPLY
sw
Number of Trucks available at External Yard to window w of ship s
Min
queue
Minimum number of trucks that must be queued to ensure uninterrupted unloading
Max
queue
Maximum number of trucks that can be allocated to attend to the unloading of a window
Max
berth
Maximum number of trucks that can be allocated to a berth
Max
port
Maximum number of trucks that can be in operation within the Port Area.
x
sw
+ T
sw
+ g
sw
≥ Min
queue
∀s ∈ S, ∀w ∈ W
s
(6)
Constraint (6) ensures that each window maintains a
minimum number of trucks in the queue in the pri-
mary area (Min
queue
), aiming to ensure that trucks are
constantly being loaded, preventing unloading inter-
ruptions and equipment idleness. A slack variable
g
sw
is also introduced for cases where there are not
enough trucks in the External Yard to be dispatched,
allowing the model to adjust without violating the
minimum queue size constraint. This avoids conflicts
with the vehicle availability constraint while enabling
the continuity of operations.
x
sw
+T
sw
−F
sw
Min
queue
+θ
sw
≥ 0 ∀s ∈ S, ∀w ∈ W
s
(7)
Constraint (7) ensures the maintenance of the model
within the linear programming domain, justifying the
inclusion of the variable θ, representing the deviation
from the average queue size. However, an adjust-
ment is needed in the equilibrium term of the objec-
tive function (Eq. 1) to guarantee the attainment of
absolute equilibrium values. The objective function
becomes as follows:
min
|S|
∑
s=1
|W
s
|
∑
w=1
P x
sw
+ R
|S|
∑
s=1
|W
s
|
∑
w=1
g
sw
+ Q
|S|
∑
s=1
|W
s
|
∑
w=1
L
sw
(x
sw
+ T
sw
− F
sw
Min
queue
+ 2θ
sw
)
W
atv
(8)
Additionally, in linear programming, slack vari-
ables must be included in the objective function to en-
sure consistency in cases where constraints cannot be
fully satisfied. Thus, a term was added to the objec-
tive function that introduces the slack variables (g
sw
)
multiplied by a sufficiently large constant R.
These slack variables ensure that the model re-
mains feasible even when some constraints — such
as the minimum queue size — cannot be strictly sat-
isfied. The constant R is a sufficiently large positive
value that penalizes the use of slack variables, ensur-
ing they are only used when necessary.
5.2 Benchmark Algorithm
To perform a comparative evaluation of the Respon-
sive model, a solution algorithm was also developed
for the dispatch problem to represent the port opera-
tor directly executing the pull based on the dispatch
suggestions presented in Table 1. Since the dispatch
suggestions are limited to the described scenarios, we
assume that new scenarios will be treated as the most
similar described scenarios. The pseudocode is pre-
sented below.
Algorithm 1: Benchmark Algorithm based on data pro-
vided by EMAP.
Data: Vetor of Ships, Windows and Trucks;
Matrix of Scenario Sugestion
Result: Pull Matrix
for s in Ships do
for w in s.Windows do
Pull[s][w] = Sugest[s][w] - T
sw
;
Pull[s][w] = max(0, Pull[s][w]);
Pull[s][w] = min(Supply, Pull[s][w]);
if w is inactive then
Pull[s][w] = 0;
end
end
end
The algorithm’s operation replicates the dispatch
from the tabulated scenario. It performs consistency
tests to verify the integrity of the dispatch value and
the availability of vehicles in the External Yard. If
the window is inactive, no dispatch is assigned. This
algorithm will be used in the results section to bench-
mark the proposed model, to compare it with solu-
tions manually implemented at the Port of Itaqui.
ICEIS 2025 - 27th International Conference on Enterprise Information Systems
610
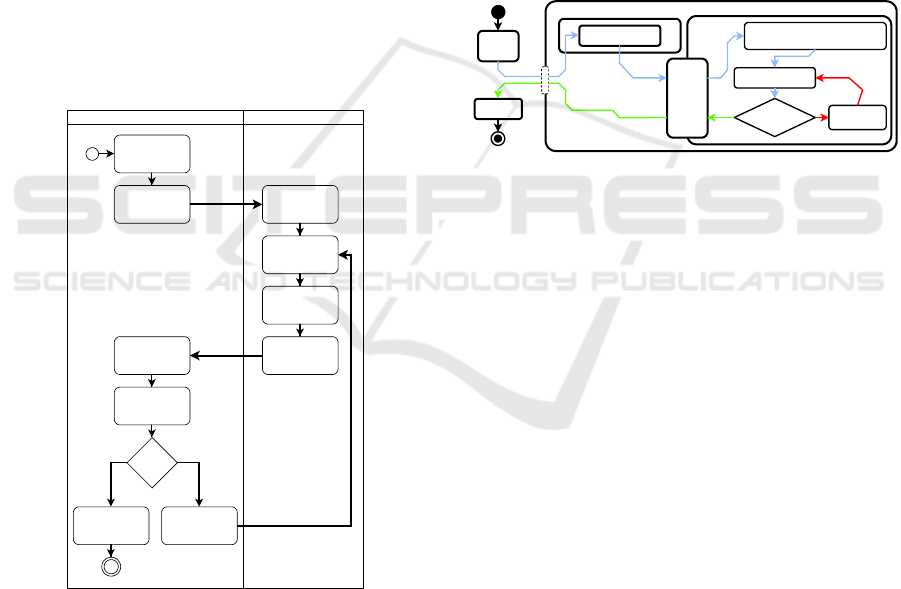
6 MODEL VALIDATION
ENVIRONMENT
To evaluate the proposed model, a simulator of
port activities focused on bulk unloading was imple-
mented, covering the main stages of the process. The
simulator generates an initial scenario based on infor-
mation about ships, unloading windows, trucks, load
capacities, and average time intervals for each stage.
Then, the simulator initializes the model by reading
the current scenario, which includes the distribution
of trucks across the stages of the operation.
The model performs a linear optimization process
to evaluate potential dispatching decisions and returns
the numerical decision for the number of trucks that
should be dispatched at that moment to fulfill the un-
loading demands of each modal window. The sce-
nario is then updated to incorporate these results, and
the process is repeated at small regular intervals of
one minute (timeslices), continuously simulating the
port’s unloading operations. The described process is
illustrated in Figure 4.
Simulator
Generates Initial
Scenario
End Sim ulation and
Save Results
Pass Updated
Scenario to Model
All Ships
Unloaded?
Simulate for a
timeslice
Incorporate
Solution to Scenario
Return Solution
Optimize Model
Read Scenario
Initialize the m odel
Read Simulation
Param eters
Model
Figure 4: Model implementation within the Simulation.
All parameters are based on data provided by
EMAP (Section 4.2), ensuring that the simulation re-
flects real-world operations. The simulator periodi-
cally assigns new trucks to active modal windows,
which then pass through the following stages (see Fig-
ure 5):
1. External Yard. Trucks wait in the External Yard
until the operator issues a pull signal for the re-
spective modal window, dispatching the informed
quantity of trucks using the FIFO strategy.
2. In Transit to Port. This phase covers the journey
to the port, starting from the confirmation of the
pull, followed by the weighing of the empty truck
at the weighbridge, and ending with the truck’s
arrival at the Access Gate.
3. Primary Area. Internal port area designated for
the loading/unloading operations. Here, trucks
proceed to their ship’s berth and wait in line for
their turn to collect the cargo at the modal win-
dow’s hopper.
4. In Transit to Costumer. The last phase, extend-
ing from the collection of the cargo to the delivery
at the customer’s location. After delivery, trucks
are removed from the flow of vehicles.
Primary Area
Port
Wharf
External
Yard
Customer
Acess
Gate
Weighbridge
Truck Retention Yard
Weighbridge
(Full)
Overload?
No
Load
Lightening
Ye s
Figure 5: Stages from port gate to customer delivery.
6.1 Supply Scenarios
To control the periodic assignment of new trucks
across the modal windows, renewing the supply of
trucks in the External Yard, a variable ρ is introduced
to determine the frequency of new truck arrivals. For
example, if ρ = 0.5, the simulation assumes that the
probability that a truck arrives at the External Yard is
50% in each time slice. Thus, three supply scenarios
were defined:
1. Affluent (ρ ≥ 0.5): Truck supply exceeds demand,
allowing flexible pulls.
2. Standard (0.1 < ρ < 0.5): Truck availability fluc-
tuates, representing typical port conditions.
3. Scarcity (0 ≤ ρ ≤ 0.1): Truck supply cannot meet
demand, restricting pulls and limiting operational
capacity.
In addition, a Gaussian variation was applied to
the variable ρ, to avoid uniform and repetitive simu-
lations. This variation adds small fluctuations around
the value of ρ in each operating window. This sim-
ulates natural variability in operations, such as truck
arrival times. Furthermore, a random walk-inspired
variation was introduced through a variable ω. This
technique randomly alters the frequency of truck ar-
rivals over time, creating unpredictable variations that
Mathematical Modeling and Simulation for Optimizing Truck Dispatch in Bulk Unloading Operations: A Case Study at the Port of Itaqui
611

mimic real fluctuations in port operations, such as
possible delays or busy periods. The simulation con-
tinues until all vessels and their respective operating
windows have completed the unloading process.
6.2 Vehicle Emissions Control
Vehicle emissions control was also implemented
throughout the simulation to evaluate the model con-
cerning pollutant emissions. Therefore, for each
truck, the exhaust emissions of greenhouse gases
were considered: carbon dioxide (CO
2
), methane
(CH
4
), and nitrous oxide (N
2
O), as well as car-
bon monoxide gases(CO), nitrogen oxides (NO
x
),
non-methane hydrocarbons (NMHC), and particulate
matter (PM). Evaporative, refueling, specific sulfate,
and aldehyde emissions were not considered because
of the lack of available data.
Thus, it is necessary to estimate emissions at
each phase of the flow (External Yard, In Transit to
Port, Primary Area, and In Transit to Customer). To
calculate the emissions related to the transit to the
port/customer, the emission factors provided in the
latest national vehicle inventory were used (Brasil,
2013), summarized in Table 3.
Table 3: Emission Factors for Greenhouse gases (GHGs)
and Non-Greenhouse gases on Heavy Duty Vehicles (Diesel
Engines) in g
pollutant
/km and their Global Warming Poten-
tial (GWP). Adapted from (Brasil, 2013).
Type Pollutant Em. Factor GWP (CO
2
eq)
GHG
CO
2
765.58 1
CH
4
0.06 21
N
2
O 0.03 310
Non
GHG
CO 0.111 -
NO
x
1.544 -
NMHC 0.011 -
Other PM 0.014 -
On the other hand, calculating the emissions in
the primary area is slightly different, as the trucks are
lined up waiting for collection, with the engine pri-
marily idle. Although studies are mapping the perfor-
mance of diesel engines, such as (Barth et al., 2005),
the lack of data on truck conditions prevents their use.
Thus, to calculate idle emissions, data on diesel
engine consumption in idle mode and pollutant emis-
sions per liter of diesel consumed were used, as avail-
able in (Brasil, 2013). Finally, the trucks’ emissions
can be calculated using Equation 9, adapted from
(de Ara
´
ujo, 2016):
E
p
=
|Truck|
∑
f
p
d
ph
+ e
idle
c
idle
t
idle
(9)
Where:
• E
p
represents the total emissions for pollutant p.
• f
p
is the emission factor for the pollutant during
each phase, in g
pollutant
/km.
• d
ph
denotes the distance, in kilometers, traveled in
each phase.
• e
idle
is the pollutant’s emission rate per liter of fuel
during idle periods.
• c
idle
represents the fuel consumption factor during
idle time.
• t
idle
is the time the vehicle idles, predominantly in
the primary area.
This formulation accounts for both the distance
traveled during active phases and the emissions from
idling time, ensuring a comprehensive emission es-
timate. However, it does not consider the emissions
generated during the truck’s travel to reach the Exter-
nal Yard. Additionally, it is valid to consider that ve-
hicles in the Heavy-duty and Medium-duty truck cat-
egories predominantly operate on highways, and their
contribution to air quality degradation in urban areas
should be relativized.
7 RESULTS AND DISCUSSION
This section presents the results of the computa-
tional experiments to validate the proposed truck-
dispatching model. The experiments were designed
to evaluate the models’ performance across distinct
operational scenarios. All parameters were based on
real data provided by EMAP (section 4.2), reflecting
actual operations at the Port of Itaqui.
The models were implemented in Python 3.12 and
executed in a Windows 10 (64-bit) environment, uti-
lizing the PuLP Mixed-Integer Programming solver
(Dunning et al., 2011), running on an Intel® Core™
i7-11700 processor with 16 GB of RAM.
7.1 Simulation Visualization
As the first experiment, a simulation was conducted
using parameters reflecting the most frequent opera-
tions at the Port of Itaqui, representing a typical sce-
nario, referred to as the standard scenario (ρ = 0.2).
The simulation, initialized from an “empty” stage in
which no unloading operations have yet been per-
formed, considers bulk cargo unloading for two ships,
each with two windows, with an average load of 10kt
per window and a standard deviation of 2.5kt.
Figure 6 displays the simulation results for the Re-
sponsive Model and the Benchmark Algorithm. It
shows the total number of trucks at the different stages
ICEIS 2025 - 27th International Conference on Enterprise Information Systems
612
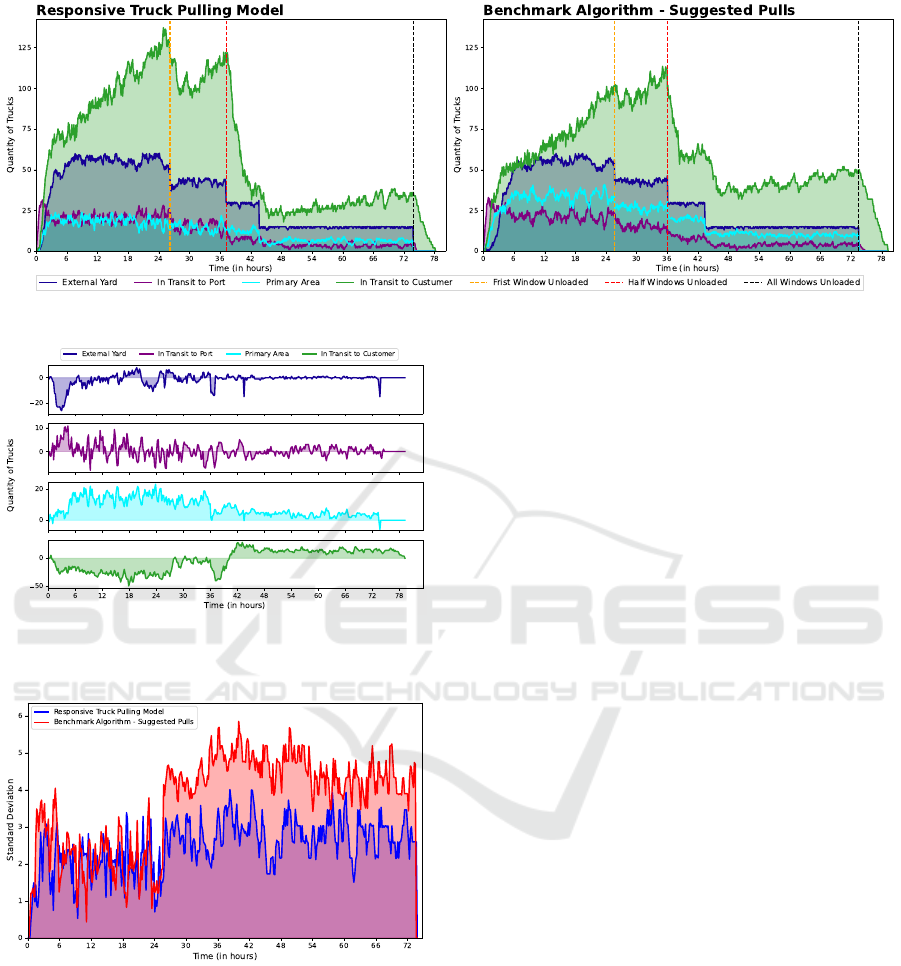
Figure 6: Simulation in standard port unloading processes.
Figure 7: Difference in the number of trucks across flow
phases between the benchmark algorithm and the respon-
sive truck dispatching model in a standard scenario.
Figure 8: Comparison of the queue size balance in the pri-
mary area between the benchmark algorithm and the re-
sponsive truck dispatching model in a standard scenario.
of the unloading process: External Yard, In Transit
to Port, Primary Area, and In Transit to Customer.
Once the simulation starts, both implementations im-
mediately increase the number of trucks In Transit
to Port. As the simulation progresses, trucks move
through the different stages of the process and even-
tually reach a balanced state between the number of
trucks in the Primary Area and those In Transit to
Port after approximately four hours. This indicates
that many trucks are waiting for dispatch, which sig-
nals that the system has reached a steady state. At this
point, the unloading process can continue smoothly,
even in a temporary shortage of new trucks.
Once the simulation reaches a state of balance,
with no decrease in the supply frequency to the Ex-
ternal Yard, this balance is maintained until the first
window is fully unloaded. At this point, adjustments
in the number of trucks can be observed, reflecting
variations in the dispatch decisions made by both the
model and the benchmark algorithm transitioning to a
new situation, leading to a new equilibrium. This shift
becomes more noticeable toward the end of the simu-
lation when fewer windows remain active. As each
window completes unloading and the model stops
pulling trucks for it, a new equilibrium is established,
creating visible “steps” in the graph. The unloading
process concludes around the 73-hour mark, with an
additional 5 hours to complete the simulation fully.
The main difference between the model and
benchmark algorithm lies in the number of vehicles
reaching equilibrium in truck flow. The number of ve-
hicles at each stage varies depending on the dispatch
strategy. This is shown in Figure 7, which displays
the absolute difference in the number of trucks be-
tween the Algorithm and the Model across the four
key stages. Each subplot illustrates how truck num-
bers differ throughout the simulation.
Significant differences in truck allocation are ob-
served when comparing the strategies, particularly in
the Primary Area. The Benchmark Algorithm quickly
exhausts trucks from the External Yard at the begin-
ning of the simulation. In contrast, the Responsive
Model adopts a more balanced approach, maintain-
ing a steadier truck supply. The model consistently
operates in the Primary Area with fewer trucks, av-
eraging 3.03 trucks per window compared to the al-
gorithm’s 5.19. This results in shorter waiting times
Mathematical Modeling and Simulation for Optimizing Truck Dispatch in Bulk Unloading Operations: A Case Study at the Port of Itaqui
613
for the model (45.26 minutes) compared to the pull
suggestion (76.58 minutes), reducing congestion and
ensuring smoother operations.
Despite the Responsive Model’s more moderate
strategy, both approaches achieve similar overall un-
loading efficiency. However, using the model also
results in a greater queue balance than the Bench-
mark Algorithm during the simulation’s progression,
as seen in Figure 8. A greater balance in the queue
size in the Primary Area is a positive factor, as the port
management company also aims to serve all clients
equitably.
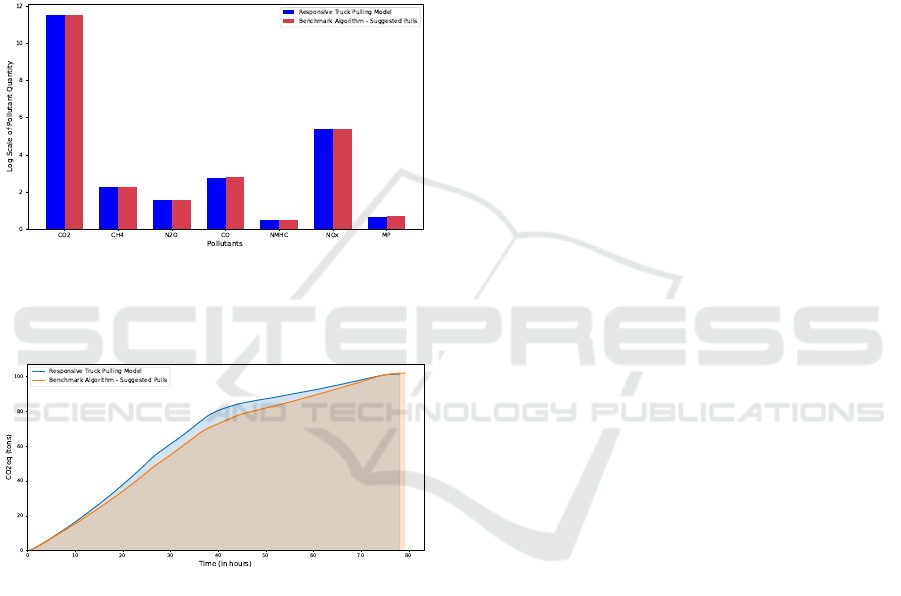
Figure 9: Pollutant Emissions between the Benchmark Al-
gorithm and the Responsive Truck Pulling Model in a Stan-
dard Scenario, using a Logarithmic Scale to Highlight Dif-
ferences Across Pollutants with Varying Magnitudes.
Figure 10: Comparison of CO2-equivalent Emissions be-
tween the Benchmark Algorithm and the Responsive Truck
Pulling Model throughout the Simulation.
Additionally, regarding vehicle emissions, it is ob-
served that there was no significant variation in the to-
tal amount of pollutants released into the atmosphere.
Both implementations yielded similar results for both
individual emissions and total CO
2
Equivalent emis-
sions, as shown in Figures 9 and 10. This occurs be-
cause, although there is a reduction in congestion in
the primary area, a higher accumulation of vehicles
is observed in the first half of the simulation during
the transit phases to the port and the customer, gen-
erating higher transit emissions that balance out the
total emissions of both approaches. This outcome is
also influenced by the choice of weight parameters in
the model, as prioritizing queue balance may reduce
congestion but lead to increased transit emissions.
7.2 Exhaustive Comparison Across
Demand Scenarios
To conduct a more thorough analysis, we conducted
simulations for three scenarios of external yard sup-
ply — Standard, Scarce, and Affluent — with varying
truck demand levels — low, medium, and high. In the
low-demand scenario, we considered one ship with
two windows, while medium demand involved two
ships with two windows each, and high demand con-
sisted of three ships with four windows each. Each
window had an average load of 10,000 tons, with a
standard deviation of 2,500 tons. For each combi-
nation of supply and demand, 100 simulation runs
were performed for both approaches. The key results
for the Standard, Scarcity, and Affluent scenarios are
shown in Tables 4, 5, and 6.
Table 4 summarizes key simulation metrics. It
shows the average queue size at each stage of the un-
loading process (External Yard, Transit to Port, Pri-
mary Area, Transit to Customer) and the average time
trucks spent in each stage. Additionally, it presents
the average standard deviation of queue sizes in the
primary area and the average equivalent CO2 emis-
sions at the end of the simulation. Furthermore, it
provides the total time required to complete unloading
for all time windows and finalize customer deliveries,
thus concluding the simulation. Similar information
is provided in Tables 5 and 6 for the Standard and Af-
fluent scenarios.
The results reveal key trends, such as the increase
in unloading and simulation time proportional to the
port’s demand and inversely proportional to the fre-
quency of truck arrivals at the External Yard. As port
demand rises, there is a gradual reduction in queue
sizes at all stages of the process, suggesting that both
model and benchmark algorithm are effectively ad-
justing their dispatch values to suit the situation.
The responsive truck dispatching model signif-
icantly reduced truck queue sizes, waiting times,
and balance discrepancies in all three scenarios —
Scarcity, Standard, and Affluent — achieving reduc-
tions ranging from 20% to 60%. However, in the
Scarcity scenario, the reductions were the smallest,
limited to the range of 20% to 30%, due to the deci-
sion limitations of the model caused by the restricted
supply in the external yard. In contrast, the Standard
and Affluent scenarios, where truck availability was
less restrictive, allowed the models greater flexibil-
ity. The primary difference between the models was
observed in the Primary Area, where the Responsive
ICEIS 2025 - 27th International Conference on Enterprise Information Systems
614

Table 4: Simulations Comparison For the Responsive Model and the Benchmark Algorithm in 100 scarce scenarios.
Scarcity External Yard Supply
Low Demand Medium Demand High Demand
Pull Suggestion Responsive Model Pull Suggestion Responsive Model Pull Suggestion Responsive Model
Queue Time Queue Time Queue Time Queue Time Queue Time Queue Time
Avg. External Yard 0.63 0:07:56 1.47 0:21:15 1.31 0:14:22 1.43 0:15:03 1.08 0:14:08 1.24 0:17:07
Avg. In Transit to Port 3.92 0:43:44 3.85 0:43:57 3.43 0:43:52 3.39 0:43:57 3.10 0:43:55 3.09 0:43:54
Avg. Primary Area 2.58 0:36:01 1.76 0:23:39 2.27 0:28:32 1.65 0:21:09 1.82 0:27:30 1.44 0:21:58
Avg. In Transit to Customer 16.10 3:10:23 14.47 3:06:47 13.60 2:56:14 13.34 2:56:14 12.76 3:09:01 12.55 3:05:33
Avg. Queue Size Standard Deviation 1.97 1.21 2.39 1.62 2.49 1.80
Avg. CO2 Equivalent Emissions (tons) 72.28 66.96 143.81 141.09 435.12 427.05
Avg. All Windows Unloaded 2 days, 13:04:30 2 days, 14:03:50 3 days, 0:33:55 3 days, 0:47:53 3 days, 7:10:36 3 days, 7:03:31
Avg. End of Simulation 2 days, 18:05:53 2 days, 18:51:50 3 days, 6:17:52 3 days, 6:33:25 3 days, 13:37:17 3 days, 13:20:14
Table 5: Simulations Comparison For the Responsive Model and the Benchmark Algorithm in 100 standard scenarios.
Standard External Yard Supply
Low Demand Medium Demand High Demand
Pull Suggestion Responsive Model Pull Suggestion Responsive Model Pull Suggestion Responsive Model
Queue Time Queue Time Queue Time Queue Time Queue Time Queue Time
Avg. External Yard 8.57 1:09:33 10.50 1:26:25 7.93 1:14:51 9.16 1:26:49 6.68 1:17:51 7.57 1:29:29
Avg. In Transit to Port 5.53 0:43:43 5.27 0:43:41 4.75 0:43:55 4.64 0:43:52 3.70 0:43:55 3.67 0:43:59
Avg. Primary Area 7.98 1:09:29 3.11 0:27:55 5.13 0:52:06 2.72 0:28:21 3.77 0:46:51 2.30 0:28:54
Avg. In Transit to Customer 17.93 2:31:12 17.92 2:29:40 15.75 2:37:18 15.51 2:36:35 12.14 2:33:09 12.21 2:33:12
Avg. Queue Size Standard Deviation 2.78 1.38 3.02 1.90 2.98 2.06
Avg. CO2 Equivalent Emissions (tons) 68.58 66.38 133.79 129.79 386.47 380.43
Avg. All Windows Unloaded 2 days, 5:31:40 2 days, 6:31:56 2 days, 7:32:09 2 days, 8:01:47 3 days, 2:16:04 3 days, 2:05:48
Avg. End of Simulation 2 days, 6:45:39 2 days, 7:36:56 2 days, 12:08:48 2 days, 12:36:34 3 days, 2:16:04 3 days, 2:05:48
Table 6: Simulations Comparison For the Responsive Model and the Benchmark Algorithm in 100 affluent scenarios.
Affluent External Yard Supply
Low Demand Medium Demand High Demand
Pull Suggestion Responsive Model Pull Suggestion Responsive Model Pull Suggestion Responsive Model
Queue Time Queue Time Queue Time Queue Time Queue Time Queue Time
Avg. External Yard 12.11 1:35:42 12.36 1:42:40 10.25 1:37:12 10.53 1:42:23 8.47 1:40:21 8.74 1:44:49
Avg. In Transit to Port 5.64 0:43:41 5.34 0:43:44 4.59 0:43:37 4.47 0:43:41 3.64 0:43:52 3.59 0:43:43
Avg. Primary Area 8.44 1:14:04 3.04 0:28:28 5.18 0:53:08 2.66 0:28:03 3.84 0:48:43 2.33 0:29:46
Avg. In Transit to Customer 17.18 2:31:38 17.20 2:29:38 14.05 2:28:04 14.61 2:35:24 11.78 2:31:15 12.15 2:35:05
Avg. Queue Size Standard Deviation 2.70 1.42 2.97 1.89 2.92 2.06
Avg. CO2 Equivalent Emissions (tons) 61.80 60.15 126.31 126.49 383.86 383.61
Avg. All Windows Unloaded 1 day, 21:17:36 1 day, 22:13:05 2 days, 10:49:37 2 days, 10:49:37 2 days, 22:24:20 2 days, 22:27:38
Avg. End of Simulation 2 days, 1:07:46 2 days, 2:21:55 2 days, 15:23:03 2 days, 15:23:03 3 days, 3:55:00 3 days, 4:02:04
Model reduced truck queue sizes and waiting times
between 40% and 60% compared to the Benchmark
Algorithm. There was a slight increase in queue sizes
in the External Yard, but this did not result in delays:
both approaches exhibited maximum differences in
average unloading times of less than 1 hour.
The significant reduction in truck congestion and
waiting time in the Primary Area has broader implica-
tions for port logistics, as it enhances operational ef-
ficiency and increases queue balancing. On the other
hand, the average reduction of total CO
2
Equivalent
emissions was approximately 2.5%, considering all
supply demands. This can be attributed to the selec-
tion of P and Q parameters of the Responsive Model.
When the parameter Q is significantly larger than P,
it results in a greater focus on responsive queue bal-
ancing, potentially at the expense of minimizing to-
tal truck emissions. These weights are selected at the
operator’s discretion using the model and the institu-
tion adopting it. This choice depends on factors such
as operational priorities, cost considerations, infras-
tructure constraints, regulatory requirements, internal
policies, safety regulations, and environmental laws.
8 CONCLUSIONS
This study proposed one mathematical model, the Re-
sponsive Truck Dispatching Model, to automate the
decision-making process for truck dispatch in the un-
loading operations at the Port of Itaqui, soughing to
optimize operations by minimizing queue formation
in the unloading area without compromising overall
operation time. Furthermore, a benchmark algorithm
based on data provided by the port administration was
implemented to replicate the current behavior of port
operators.
A detailed evaluation of the models was con-
ducted using a port activity simulator designed to
replicate bulk unloading processes, covering key
stages such as the External Yard, Transit to Port, Pri-
mary Area, and Transit to Customer. The simulation
Mathematical Modeling and Simulation for Optimizing Truck Dispatch in Bulk Unloading Operations: A Case Study at the Port of Itaqui
615

results, derived from comprehensive tests across vary-
ing levels of demand and truck arrival frequencies,
demonstrated that both approaches were responsive
to dynamic operational conditions. However, it was
observed that the model reduced queue sizes in the
primary area by 20% to 60% compared to pull sug-
gestions or operator recommendations. Notably, in
scenarios where truck supply was not a limiting fac-
tor, the model demonstrated a significant advantage
by reducing queue lengths and waiting times in the
primary area by up to 60%, without extending the to-
tal unloading time or increasing overall truck emis-
sions.
Future work will focus on integrating these mod-
els into real-world operations at the Port of Itaqui and
exploring additional optimization strategies prioritiz-
ing queue balancing, throughput maximization, and
ideal occupancy levels in different windows. This re-
search contributes to the literature on port logistics,
specifically in bulk cargo handling. It provides tools
that can support operators in optimizing the flow of
trucks, reducing congestion, and potentially automat-
ing the decision-making process for truck pull.
ACKNOWLEDGMENTS
The authors acknowledge the Maranh
˜
ao Port Admin-
istration Company (EMAP) and the Foundation for
the Support of Scientific and Technological Research
Development of Maranh
˜
ao (FAPEMA) for their fi-
nancial support.
REFERENCES
Alonso, M., Alvarez-Valdes, R., Iori, M., Parre
˜
no, F., and
Tamarit, J. (2017). Mathematical models for multi-
container loading problems. Omega, 66:106–117.
Barth, M., Younglove, T., and Scora, G. (2005). Develop-
ment of a heavy-duty diesel modal emissions and fuel
consumption model. Technical report, UC Berkeley.
Boumahdaf, A., Broniatowski, M.,
´
Emilie Miranda, and
Le Squeren, A. (2023). A behavioral probabilis-
tic model of carrier spatial repositioning decision-
making. Transportation Research Part C: Emerging
Technologies, 153:104194.
Brasil (2013). Invent
´
ario nacional de emiss
˜
oes atmosf
´
ericas
por ve
´
ıculos automotores rodovi
´
arios. Technical re-
port, Minist
´
erio do Meio Ambiente; Ag
ˆ
encia Nacional
de Transportes Terrestres (ANTT), Bras
´
ılia. Acesso
em: 9 dez. 2024.
de Ara
´
ujo, I. B. (2016). Quantificac¸
˜
ao, espacializac¸
˜
ao
e especiac¸
˜
ao das emiss
˜
oes atmosf
´
ericas de origem
veicular na regi
˜
ao metropolitana da grande vit
´
oria.
Dissertac¸
˜
ao de mestrado, Universidade Federal do
Esp
´
ırito Santo, Vit
´
oria.
Dunning, I., Mitchell, S., and O’Sullivan, M. (2011). PuLP:
A Linear Programming Toolkit for Python.
EMAP (2024). Location of porto do itaqui. Accessed:
September 22, 2024.
Guerrero, S. E., Madanat, S. M., and Leachman, R. C.
(2013). The trucking sector optimization model: A
tool for predicting carrier and shipper responses to
policies aiming to reduce ghg emissions. Transporta-
tion Research Part E: Logistics and Transportation
Review, 59:85–107.
Haddad, E. A., Hewings, G. J. D., Perobelli, F. S., and dos
Santos, R. A. C. (2010). Regional effects of port in-
frastructure: A spatial cge application to brazil. Inter-
national Regional Science Review, 33(3):239–263.
ITF (2023). ITF Transport Outlook 2023. International
Transport Forum.
Kang, S., Medina, J. C., and Ouyang, Y. (2008). Optimal
operations of transportation fleet for unloading activ-
ities at container ports. Transportation Research Part
B: Methodological, 42(10):970–984.
Karakas, S., Kirmizi, M., and Kocaoglu, B. (2021). Yard
block assignment, internal truck operations, and berth
allocation in container terminals: introducing carbon-
footprint minimisation objectives. Maritime Eco-
nomics and Logistics, 23(4):750–771.
Ram
´
ırez-Nafarrate, A., Gonz
´
alez-Ram
´
ırez, R. G., Smith,
N. R., Guerra-Olivares, R., and Voß, S. (2017). Im-
pact on yard efficiency of a truck appointment system
for a port terminal. Annals of Operations Research,
258:195–216.
Silva, E., Ramos, A. G., and Oliveira, J. F. (2018). Load bal-
ance recovery for multi-drop distribution problems: A
mixed integer linear programming approach. Trans-
portation Research Part B: Methodological, 116:62–
75.
Sıla C¸ etinkaya, B. B. K. and
¨
Uster, H. (2014). Charac-
terization of facility assignment costs for a location-
inventory model under truckload distribution. Jour-
nal of the Operational Research Society, 65(9):1371–
1379.
Talley, W. K. and Ng, M. (2016). Port multi-service conges-
tion. Transportation Research Part E: Logistics and
Transportation Review, 94:66–70.
Tsai, F.-M., Lu, C.-C., and Chang, Y.-M. (2016). A network
model for solving the yard truck routing and schedul-
ing problem. The International Journal of Logistics
Management, 27(2):353–370.
United Nations Conference on Trade and Development
(2024). Review of Maritime Transport 2024. United
Nations, Geneva, Switzerland.
Xiwen Bai, H. J. and Xu, M. (2022). Port congestion and the
economics of lpg seaborne transportation. Maritime
Policy & Management, 49(7):913–929.
Xiwen Bai, H. J. and Xu, M. (2024). Identifying port con-
gestion and evaluating its impact on maritime logis-
tics. Maritime Policy & Management, 51(3):345–362.
Zhen, L., Yu, S., Wang, S., and Sun, Z. (2019). Scheduling
quay cranes and yard trucks for unloading operations
in container ports. Annals of Operations Research,
273(1):455–478.
ICEIS 2025 - 27th International Conference on Enterprise Information Systems
616
