
StreamVis: An Analysis Platform for YouTube Live Chat Audience
Interaction, Trends and Controversial Topics
Gabriela B. Kurtz
1 a
, St
´
efano de P. Carraro
2
, Carlos R. G. Teixeira
2 b
, Leonardo D. Bandeira
3 c
,
Bernardo L. M
¨
uller
2
, Roberto Tietzmann
2 d
, Milene S. Silveira
2 e
and Isabel H. Manssour
2 f
1
University Canada West, Vancouver, Canada
2
Pontifical Catholic University of Rio Grande do Sul (PUCRS), Porto Alegre, Brazil
3
Federal University of Rio Grande do Sul (UFRGS), Porto Alegre, Brazil
Keywords:
YouTube, Social Media Analysis, Visualization, Streaming, Chat Interaction.
Abstract:
This paper presents StreamVis, an easy-to-use platform that provides stats and visual representations to ana-
lyze live chat data from YouTube. StreamVis uses Python and Google’s YouTube Data API for data gathering,
combined with libraries such as NLTK for natural language processing, Pandas for data analysis, and Mat-
plotlib for visualization. Its interactive dashboard facilitates real-time data visualization through frequency
charts, word clouds, and sentiment analysis, providing deep insights into audience engagement patterns. A
case study analyzing the NFL’s first game in Brazil broadcast on Caz
´
e TV demonstrates how StreamVis reveals
trends in audience interactions during critical moments, like game highlights and performances. StreamVis
is different from previous tools because it has a user-friendly interface, enabling non-technical users (such as
journalists and other media professionals) to perform complex data analysis with a large volume of content,
helping them to understand how live chat dynamics influence media consumption.
1 INTRODUCTION
Television producers have always used various meth-
ods to measure audience response and guide produc-
tion efforts (Barnouw, 1990), (Sterling and Kittross,
2001), (Bourdon and M
´
eadel, 2014). The most tradi-
tional, inherited from the radio, included letters and
phone calls to the broadcaster regarding aired pro-
grams. This was followed by audience measurement
techniques, which became more automated over the
years. In parallel, qualitative studies have also been
regularly used to assess audience appreciation beyond
mere quantitative measurements (Marc, 1996). More
recently, online data collection has played a crucial
role in shaping strategies and narratives, providing
immediate and detailed insights into audience behav-
ior. With the restrictions on data collection on X (for-
a
https://orcid.org/0000-0002-8730-3383
b
https://orcid.org/0000-0001-6829-1682
c
https://orcid.org/0009-0006-0043-912X
d
https://orcid.org/0000-0002-8270-0865
e
https://orcid.org/0000-0003-2159-551X
f
https://orcid.org/0000-0001-9446-6757
merly Twitter) after the acquisition by Elon Musk, the
attention flowed to other platforms.
Building on the growing popularity of live broad-
casts on YouTube (YT) and similar platforms, the
analysis of audience comments becomes increasingly
significant. These comments not only reflect the
viewers’ immediate reactions but also reveal broader
social dynamics (Burgess and Green, 2018), such as
public engagement, sentiment, and community build-
ing around the content being shared.
The massive engagement found on such platforms
has shaped sports institutions and promoters such as
the International Olympic Committee (IOC) and the
National Football League (NFL) to adopt an inno-
vative broadcasting strategy. During the Paris 2024
Olympic Games, Brazilian audiences had multiple
viewing options: they could watch the broadcasts on
TV Globo, the official broadcasting partner of the
event, on both free-to-air and pay TV, through the
IOC’s own channels on its applications, or via the
streaming partner and YT channel of Caz
´
e TV
1
, also
available for free. On September 6, 2024, the first
1
https://www.youtube.com/cazetv
630
Kurtz, G. B., Carraro, S. P., Teixeira, C. R. G., Bandeira, L. D., Müller, B. L., Tietzmann, R., Silveira, M. S. and Manssour, I. H.
StreamVis: An Analysis Platform for YouTube Live Chat Audience Interaction, Trends and Controversial Topics.
DOI: 10.5220/0013446200003929
In Proceedings of the 27th International Conference on Enterprise Information Systems (ICEIS 2025) - Volume 2, pages 630-640
ISBN: 978-989-758-749-8; ISSN: 2184-4992
Copyright © 2025 by Paper published under CC license (CC BY-NC-ND 4.0)

NFL game played in Brazil showcased the Green Bay
Packers facing the Philadelphia Eagles on a Friday
night, featuring a similar media arrangement. This
multi-channel approach underscored the growing sig-
nificance of digital platforms in sports broadcasting,
reflecting a shift towards more flexible and audience-
driven viewing experiences.
The main goal of this work is to provide a deeper
understanding of how interactive platforms influence
audience engagement and media consumption by ana-
lyzing user-generated comments. We explore how the
comment streams accompanying live broadcasts, par-
ticularly in informal and interactive YouTube chan-
nels like Caz
´
e TV, contribute to the viewer experi-
ence. By analyzing the content, frequency, and senti-
ment of these comments, we seek to uncover patterns
that highlight the role of live-streaming platforms in
shaping contemporary media consumption. An in-
terdisciplinary team featuring Computer Science and
Communication researchers defined the scope, tool
feature set, and prototype case study (NFL in Brazil).
To achieve this goal, the authors developed a plat-
form called StreamVis that collects comments accom-
panying live broadcasts on YouTube and processes the
collected data, generating a dashboard with frequency
charts, word clouds, sentiment analysis, and other vi-
sual analyses described further in this study. These
findings are presented as a report, allowing users to
capture and interpret the dynamics of audience inter-
actions in a short time, offering valuable insights into
how viewers engage with live content.
Our main contributions are outlined as follows:
• An innovative platform for collecting and analyz-
ing live broadcast comments on YouTube, which
enables interactive visualizations of audience en-
gagement through frequency charts, word clouds,
and sentiment analysis.
• A step-by-step approach that combines data col-
lection and visual analysis, providing new insights
into audience behavior during live events on inter-
active platforms.
• A case study demonstrating the application of the
proposed platform in analyzing comments from
Caz
´
e TV’s NFL in Brazil broadcast, illustrating
how informal and interactive broadcasting for-
mats impact viewer experiences.
The remainder of the paper is organized as fol-
lows. Sections 2 and 3 present the background and
related work. The proposed approach is described in
Section 4. Section 5 details the obtained results by
presenting one use case. A discussion on contribu-
tions, limitations, and future directions is presented in
Section 6. The last section outlines our conclusions.
2 BACKGROUND
This section presents an introduction related to
YouTube Lives and the Caz
´
e TV channel in the con-
text of sports broadcasts.
2.1 YouTube Lives
YouTube, owned by Alphabet, is one of the largest so-
cial media and streaming platforms in the world. Ac-
cording to the Digital 2024 Global Overview Report,
YouTube is the second-ranked social media channel
when it comes to time spent on platforms, with an av-
erage of slightly over 28 hours per month per user-
it only loses to TikTok, with 34 hours
2
. As of July
2024, India had the largest YouTube audience in the
world, with roughly 476 million users actively engag-
ing with the video-sharing platform, a little over one-
third of its population. Both the United States, ranked
second, and Brazil, ranked third, had over two-thirds
of their populations watching YouTube. The US had
approximately 238 million viewers, while Brazil had
about 147 million people using YouTube
3
.
Live streaming, once a niche technology used by
early internet pioneers, has evolved into one of the
most popular and influential forms of broadcasting.
Initially introduced in the 1990s, live streaming has
since become a cornerstone of digital communica-
tion, utilized by tech giants such as Google, Mi-
crosoft, and Apple. Its growth was further acceler-
ated by the global shift to remote work and study
during the COVID-19 pandemic. The platform that
truly revolutionized the accessibility and popularity
of live streaming, however, was YouTube. Beginning
with its first live event in 2008, YouTube’s foray into
live streaming signaled a pivotal moment in the tech-
nology’s mainstream adoption, paving the way for a
broader cultural and technological shift that redefined
media consumption
4
.
YouTube Live offers a variety of features that
make live streaming accessible and flexible for cre-
ators. It allows users to stream directly from a web-
cam, mobile device, or through more advanced setups
with encoders. Creators can use real-time interactions
like polling and visual overlays to engage their audi-
ence, while options like monetization and scheduling
enhance the overall live experience. The live chat fea-
ture is a key component of YouTube Live, enabling
real-time communication between creators and view-
ers. Creators can moderate the chat through tools like
slow mode, where messages are spaced out to control
2
https://tinyurl.com/ydvmec8t
3
https://tinyurl.com/39bshxj7
4
https://tinyurl.com/2kv9w2we
StreamVis: An Analysis Platform for YouTube Live Chat Audience Interaction, Trends and Controversial Topics
631
the flow, and can even filter or block inappropriate
comments. This interaction fosters stronger commu-
nity engagement, encouraging real-time feedback and
participation. YouTube Live also provides creators
with detailed insights about their streams. Metrics
such as concurrent viewers, chat activity, and over-
all audience demographics help creators evaluate their
content’s performance. These analytics allow stream-
ers to better understand their audience, refine their
content, and optimize future live broadcasts, making
YouTube Live not only a platform for real-time inter-
action but also a tool for long-term content strategy
development
5
.
2.2 Caz
´
e TV and Sports Streaming
The media strategy used by the league deserves atten-
tion: the event was broadcasted across three different
platforms (RedeTV on free-to-air TV, ESPN Brazil
on cable TV, and Caz
´
eTV via online streaming), and
scheduled for the NFL’s first Friday night primetime
slot. This approach contributed to the success of the
event, not just in the host state but throughout Brazil
6
.
Casimiro Miguel, popularly known as Caz
´
e, is a
reference in sports broadcasting on YouTube, with
over 16 million subscribers to his channel, more
than 7,000 videos published, and over 1.8 billion
views. The streamer has gained worldwide recog-
nition for his coverage of major events such as the
World Cup and the Olympics, ranking 300th glob-
ally in terms of subscribers
7
. During the 2022 World
Cup, Casimiro made history by becoming the first
Brazilian streamer to broadcast tournament matches
on YouTube. Thanks to an agreement with FIFA and
LiveMode, he streamed 22 matches, including those
of the Brazilian national team, the semifinals, and the
final. His channel, Caz
´
eTV, peaked at 6 million si-
multaneous viewers, setting a live viewership record
on YouTube, ranking among the top 4 of the 5 most-
watched live streams
8
.
This success marked a turning point for sports
streaming, demonstrating that digital platforms could
compete with traditional television broadcasters
9
.
Another important milestone was his role in
broadcasting the first NFL game in Brazil. The event
offered Casimiro an opportunity to expand his reach
beyond soccer. Although American football does
not have the same penetration as traditional soccer in
5
https://tinyurl.com/2nwj4eb8
6
https://tinyurl.com/mwznhf66
7
https://tinyurl.com/p6zm5wcy
8
https://tinyurl.com/yau4h6vs
9
https://tinyurl.com/djh43p7t
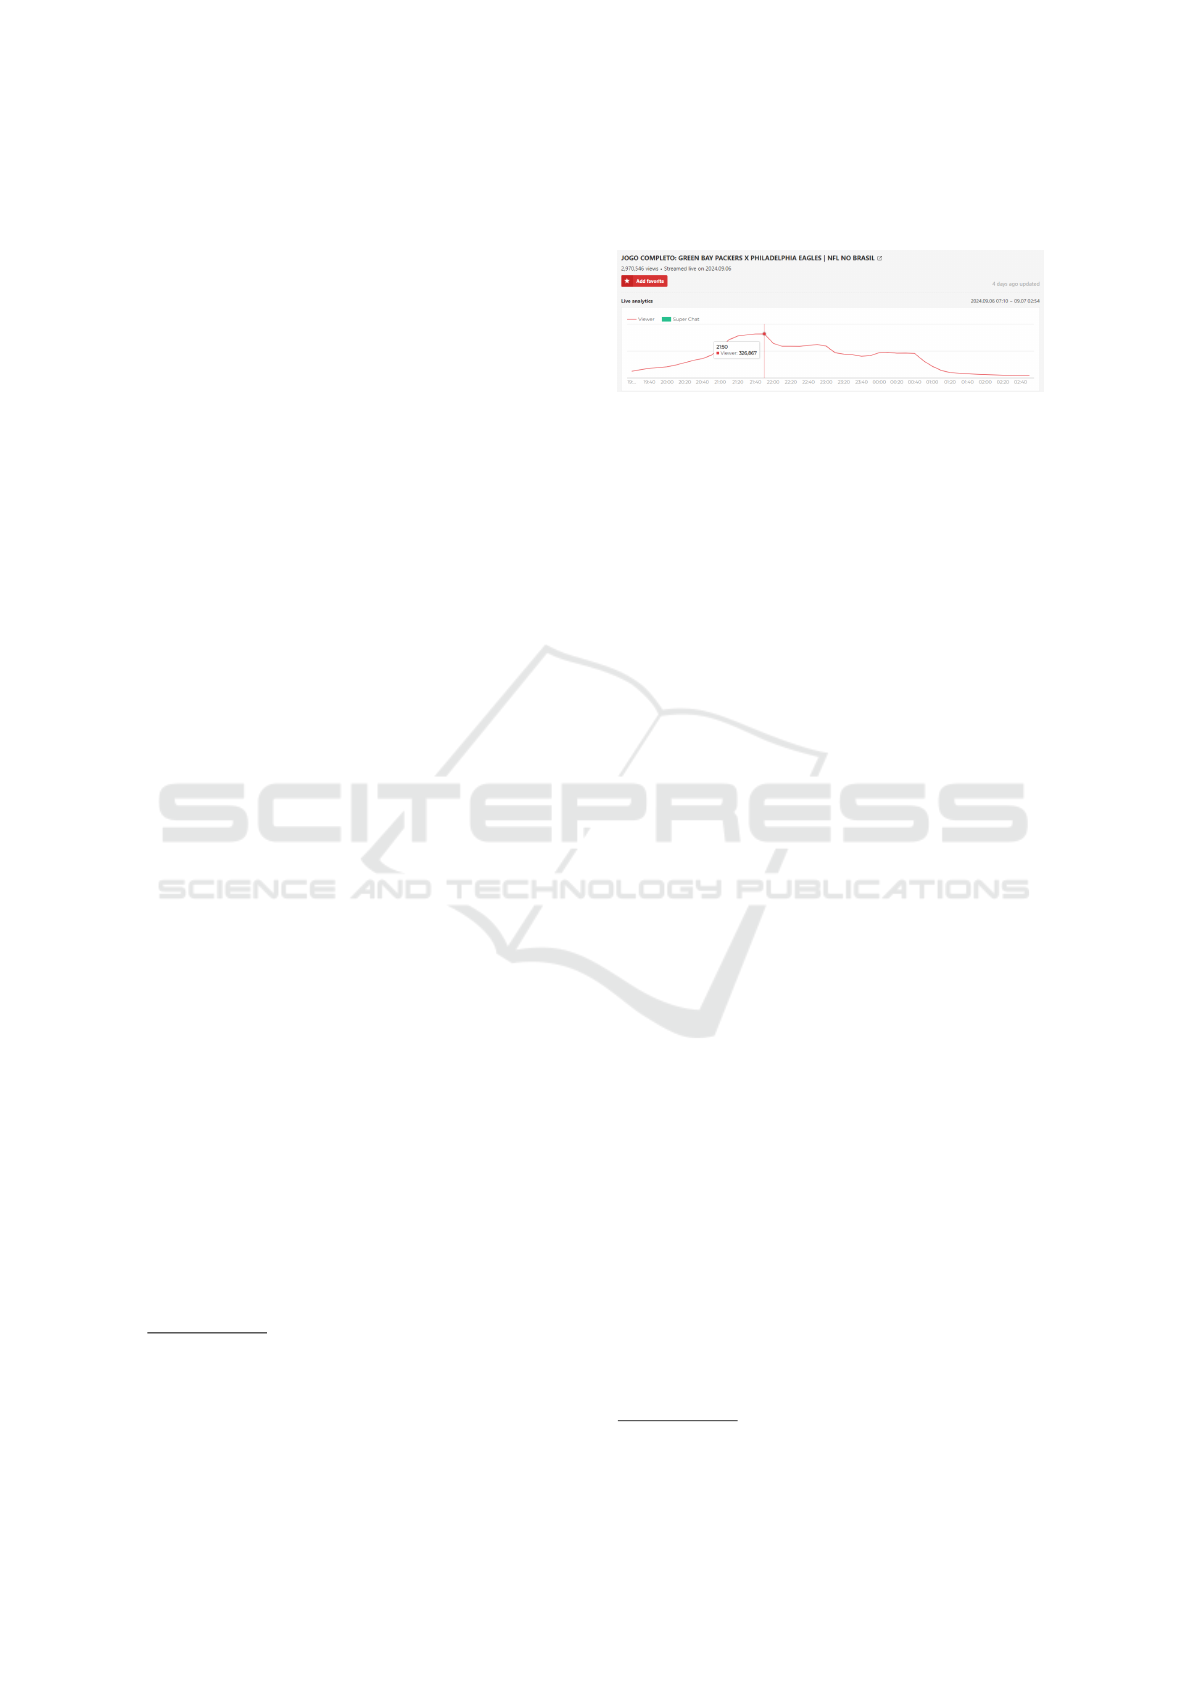
Brazil, the broadcast lasted over 7 hours and garnered
nearly 3 million views, as shown in Figure 1
10
.
Figure 1: Total views of the NFL broadcast. Source:
https://playboard.co/en/video/W049t2oII4Q.
3 RELATED WORK
Research about YouTube has been quite abundant,
since it is a well-established platform. In our work,
we aim to expand on those findings, acknowledg-
ing the previous works. When looking for those
works, we filtered investigations that were related to
YouTube comments, both in regular uploaded videos
and Lives. We noticed a lower volume of comment
analysis in YouTube livestreams, suggesting room for
further analysis.
When it comes to sentiment analysis on YouTube,
recent studies have made progress in using machine
learning and deep learning to understand user opin-
ions from the platform’s large amount of comments.
For instance, Chalkias et al.(Chalkias et al., 2023)
used tools like VADER and TextBlob to study com-
ments on educational YouTube videos, finding that
most comments were neutral, but many were posi-
tive when videos used engaging features like anima-
tions. Mehta and Deshmukh(Mehta and Deshmukh,
2022) focused on YouTube ads, using machine learn-
ing models like Decision Trees, which showed strong
results in predicting how viewers would react. These
studies highlight how automated systems are improv-
ing in handling large datasets and identifying patterns
in user sentiment across different types of YouTube
content.
Earlier research laid the groundwork for these ad-
vancements. Singh and Tiwari (Singh and Tiwari,
2021) used several machine learning models, find-
ing that Support Vector Machine (SVM) worked best
for analyzing comment sentiment. Sentiment analysis
is also a topic for multi-language adaptations other
than English. Yasin et al. (Yasin et al., 2020) tack-
led the challenge of bilingual sentiment analysis in
English and Roman Urdu, successfully using logistic
regression to rank videos based on comments. This
is just one example of this analysis being done in
multiple languages. Uryupina et al.(Uryupina et al.,
10
https://tinyurl.com/3hcejrm9
ICEIS 2025 - 27th International Conference on Enterprise Information Systems
632

2014) introduced the SenTube corpus, a dataset de-
signed for sentiment analysis in multiple languages.
Together, these studies show how sentiment analysis
on YouTube has grown from basic dataset creation to
more advanced models that can handle a wider range
of content and languages.
Sentiment analysis has been widely used by re-
searchers on YouTube, but there were also other ap-
proaches regarding user participation in the com-
ments. It is important to note that the following re-
searches were done in pre-recorded posted videos on
YouTube, not live streams. Recent studies have ex-
plored various aspects of YouTube comments, from
informal learning to public discourse and content
moderation. Dubovi and Tabak (Dubovi and Tabak,
2020) focused on how YouTube comments foster
knowledge co-construction, particularly in science
videos. Their research demonstrated that user com-
ments often go beyond simple information sharing,
engaging in discussions and debates that lead to
deeper learning.
Other researchers have examined the broader dy-
namics of YouTube comments, particularly their im-
pact on engagement and content quality. Siersdorfer
et al. (Siersdorfer et al., 2010) analyzed over six mil-
lion comments to understand the factors that influ-
ence comment ratings and usefulness. They found
a clear correlation between positive sentiment and
higher community ratings, while offensive language
led to negative ratings. Their work also introduced
machine learning classifiers to predict which com-
ments would be rated positively or negatively by the
community, providing insights into how sentiment
and language shape user interactions on the platform.
Comment analysis on YouTube has also been ap-
plied to specific issues such as hate speech and spam.
Latorre and Amores (Latorre and Amores, 2021)
used topic modeling to identify racist and xenopho-
bic comments targeting migrants and refugees, show-
ing that 19.35 percent of the analyzed comments con-
tained hate speech. This highlights the darker side of
YouTube comments, where far-right rhetoric and na-
tionalist views are prevalent in certain channels. Ab-
dullah et al.(Abdullah et al., 2018) took a different ap-
proach, focusing on spam detection in YouTube com-
ments. They compared various spam filtering tech-
niques, finding that low-complexity algorithms can
achieve high accuracy in identifying spam content,
suggesting that YouTube’s built-in tools could be en-
hanced to combat the spread of malicious content.
These studies show that while YouTube comments of-
fer valuable insights into user sentiment and interac-
tion, they also present challenges related to content
moderation and the spread of harmful speech.
More specifically about YouTube comments anal-
ysis in live streams, we have some relevant findings.
Recent research focuses on understanding user behav-
ior, emotional intensity, and content moderation dur-
ing live events. Sentiment analysis was one of the
tools used to analyze live stream comments. Tirpude
et al. (Tirpude et al., 2024) developed a system to
analyze sentiments in live chat through Natural Lan-
guage Processing (NLP) techniques. By using Fast-
Text for sentiment scoring and emoji analysis, they
provided real-time insights into audience reactions,
enabling content creators to adjust their approach dy-
namically during live streams. Similarly, Liebeskind
et al. (Liebeskind et al., 2021) investigated engage-
ment patterns in YouTube live chats, specifically dur-
ing political events such as Donald Trump’s 2020
campaign. Their study revealed that live comments
were highly emotional, with a significant portion be-
ing abusive, but frequent commenters tended to use
less offensive language, emphasizing how emotional
involvement plays a role in live chat dynamics.
Emotional intensity in live streams has been an-
other focus, as evidenced by the works of Luo et
al. (Luo et al., 2020) and Guo and Fussell (Guo and
Fussell, 2020). Luo et al. explored how emotions are
amplified in live chat compared to comments posted
after events, finding that shared real-time experiences
intensify both positive and negative sentiments. This
emotional amplification has implications for content
moderation, as heightened emotions can lead to an in-
crease in abusive or toxic comments. Guo and Fussell
took this further by examining emotional contagion in
live-streaming environments, showing that the senti-
ments in chat messages have a stronger influence on
subsequent messages than the content of the video it-
self. Their findings suggest that audience interactions
can significantly shape the overall sentiment of live
chat, often more than the live content itself.
In addition to understanding emotional dynam-
ics, other researchers have focused on combat-
ing challenges such as spam and toxicity in live
chats. Yousukkee and Wisitpongphan (Yousukkee
and Wisitpongphan, 2021) analyzed spammers’ be-
havior in live streams, using machine learning models
to differentiate between spam and legitimate user en-
gagement. Their decision tree classifier achieved high
accuracy in detecting repetitive, irrelevant content.
Complementing this, Tarafder (Tarafder et al., 2023)
developed an automated tool to identify and flag
toxic comments in real-time, addressing the increas-
ing need for content moderation during live streams,
especially as platforms like YouTube have seen a
surge in usage during the pandemic.
An interesting recent tool that is worth mentioning
StreamVis: An Analysis Platform for YouTube Live Chat Audience Interaction, Trends and Controversial Topics
633
is the “CatchLive”, developed by Yang et al. (Yang
et al., 2022). The system provides a real-time sum-
mary by segmenting the stream into high-level sec-
tions and highlighting key moments based on both
stream content and user interaction data, such as chat
messages and likes. The paper discusses the devel-
opment of two core algorithms—one for stream seg-
mentation and another for identifying highlight mo-
ments. Even though this tool was not developed for
analyzing comments on YouTube Livestreams, it was
an interesting inspiration for our team when develop-
ing our solution, since the main goal is to provide a
comprehensive summarization of user comments and
engagement in Live Streamings.
4 StreamVis PLATFORM
To facilitate the analysis of YT live chat, we devel-
oped an online platform for gathering and analyzing
data through an interactive dashboard. The dashboard
enables temporal analysis of chat interactions, allow-
ing users to identify influential viewers, trending top-
ics, and controversial discussions. Its easy-to-use in-
terface allows users to gain insights from live chat
data without the need for technical expertise or pro-
gramming skills.
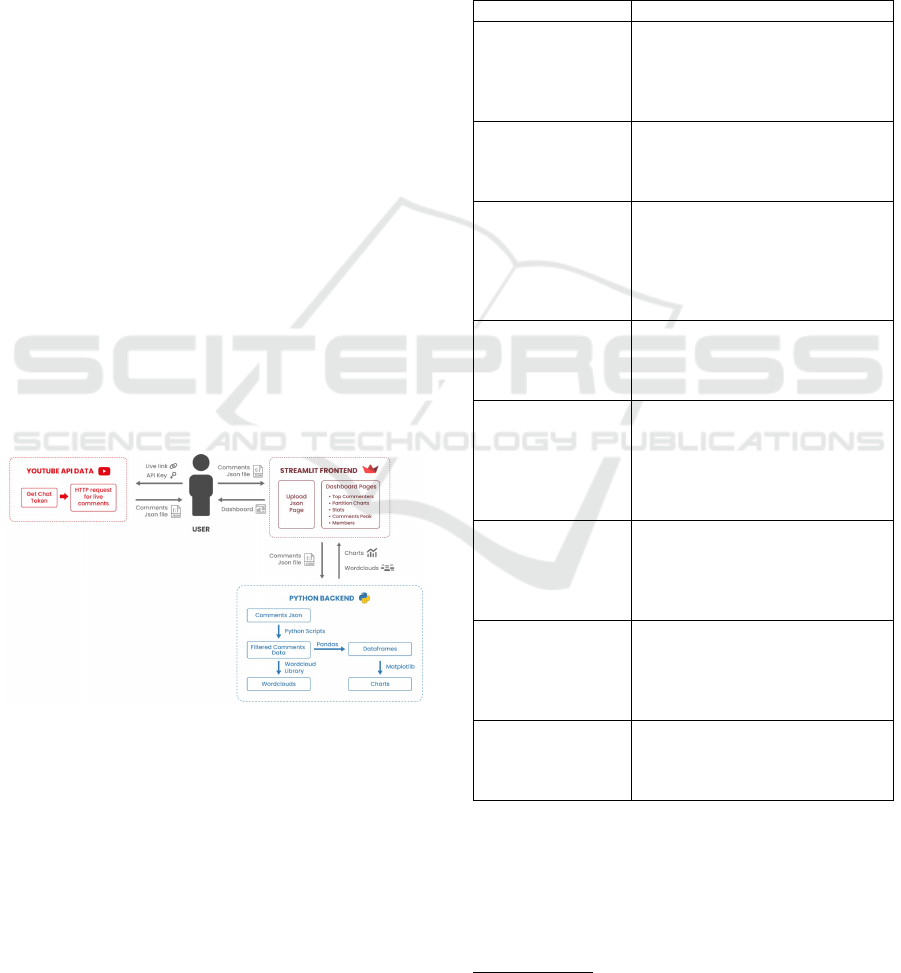
Figure 2 presents the main components of
StreamVis. The following sections describe these
components and the platform’s main functionalities.
Figure 2: StreamVis main components.
4.1 Implementation Environment
We used the Python programming language and
Google’s official YouTube Data API for data gather-
ing. This API returns a payload with relevant data,
such as comment message, author, and timestamp.
The decision to use Python as the primary program-
ming language for this project was based on its library
support and performance in data analysis and natural
language processing.
In addition to the Python language, we also used
Streamlit
11
to develop the dashboard interface.
In Table 1, we outline the technologies utilized
and their essential roles in the project. Integrating
these libraries with Python provided a robust frame-
work for conducting large-scale analysis of YouTube
comments, enabling seamless interaction with APIs,
efficient data processing, natural language analysis,
and the creation of insightful visualizations.
Table 1: Libraries used and their respective functions.
Library Description
requests Used to retrieve YouTube com-
ments in real-time by interacting
with the YouTube Data API, en-
abling dynamic data collection di-
rectly from the platform.
python-dateutil Used for parsing and manipulat-
ing dates, ensuring consistent pro-
cessing and visualization by nor-
malizing date and time data.
pytz Used for managing time zones
and converting timestamps to a
uniform time reference, facilitat-
ing accurate time-based analysis
across different geographic loca-
tions.
python-dotenv Used for securely managing envi-
ronment variables and safeguard-
ing sensitive information in a
.env file.
nltk Used for preprocessing com-
ments, particularly for remov-
ing common stopwords in Por-
tuguese, ensuring that only mean-
ingful words remained in text-
based analyses.
pandas Used for organizing comments
into DataFrames and conducting
detailed analysis, such as identi-
fying peaks in commenting activ-
ity.
WordCloud Used for generating visual repre-
sentations of the most frequently
occurring words in the comments,
providing intuitive insights into
prominent themes and topics.
matplotlib Used for generating charts and
plots, aiding in the interpretation
of resampled data and identifica-
tion of trends in user behavior.
4.2 Data Gathering
As a tool for data gathering, we developed a small
and reusable script in Python that uses the YouTube
Data API to make requests. This script inter-
acts with YouTube’s API to retrieve a payload con-
11
https://streamlit.io/
ICEIS 2025 - 27th International Conference on Enterprise Information Systems
634

taining relevant data, such as the comment mes-
sage, author details, and timestamp. Key func-
tions within the script, get live details() and
get chat messages(), respectively, are responsible
for retrieving live stream details and the live chat ID,
and gathering chat messages, calculating elapsed time
from the stream’s start, and processing each comment,
author, and time data into a structured format.
The script continuously runs in a loop, collecting
data at specified intervals and automatically saving
the gathered data into a JSON file. This data stor-
age ensures persistence and can be later used as in-
put to the developed dashboard, enabling further vi-
sualizations like frequency charts, word clouds, and
sentiment analysis. Additional functions manage the
reading and writing of data and filter out duplicate en-
tries, ensuring only new, relevant comments are added
to the dataset.
This script’s main benefit is its ease of use
12
:
users only need to provide their Google API Key
and the YouTube video ID, which can be easily ob-
tained from the video URL. This simplicity allows
even non-technical users to deploy the script effort-
lessly. Furthermore, the script’s automated real-
time data collection with subsequent visual analysis
through the dashboard described in the next section
enhances the understanding of audience behavior dur-
ing live YouTube events. The proposed platform is
particularly advantageous for informal and interactive
broadcasting formats, as it captures the dynamic flow
of viewer responses, which traditional data-gathering
methods might overlook.
4.3 Dashboard Description
StreamVis is designed to provide insights into user en-
gagement through YouTube comments and live chat
data. Its dashboard allows users to examine critical
metrics, such as chat volume, trending topics, and in-
fluential users.
The dashboard offers a simple interface, incorpo-
rating line and bar charts and word clouds. It en-
ables users to filter data, zoom, and access detailed
insights, allowing for an in-depth exploration of au-
dience behavior without requiring programming ex-
pertise. Additionally, customizable views enhance
the tool’s adaptability to diverse use cases, support-
ing various analytical needs.
A sidebar menu allows users to navigate between
various features of the dashboard. The available op-
tions included are shown in Figure 3 and explained in
detail below.
12
The script is available at
https://github.com/DAVINTLAB/StreamVis
Figure 3: StreamVis main page presenting menu options.
• Upload JSON - Allows you to load a JSON file
with the data collected by the script described in
Section 4.2.
• Comment Peaks - One of the primary features of
StreamVis is the ability to identify and analyze
peaks in comment activity. The Comment Peaks
page exemplified in Figure 4 generates an inter-
active time-series chart that visualizes moments of
high comment volume. These peaks often corre-
spond to key events in the video, such as signif-
icant announcements or moments of heightened
viewer interest. This chart allows users to zoom
in on specific time intervals and explore trends in-
side the collected data. In addition to visualizing
the peaks, StreamVis generates a corresponding
word cloud for each peak based on the comments
made during that time frame.
• Top Commenters - Highlights the most active par-
ticipants and offers a detailed breakdown of all
their comments, including timestamps and con-
tent, allowing analysts to explore the volume of
engagement and the nature of the contributions
made by key users. It is also possible to config-
ure the number to the top commenters you want
to analyze, as shown in Figure 5.
• Partitions - For further analysis, allow the user to
divide the dataset into custom time intervals for
further analysis. Sliders allow users to adjust the
granularity of the data displayed, such as resam-
pling comment data by minutes or hours for more
refined insights.
• Stats - Provides general statistics about the
dataset, such as the total number of comments,
unique commenters, and average comments per
user.
• New Members - As illustrated in Figure 6, dis-
plays new users who have recently joined a paid
membership plan, helping to sponsor the stream-
ing channel and its projects. This function shows
the timing and volume of memberships through-
out the live stream.
StreamVis: An Analysis Platform for YouTube Live Chat Audience Interaction, Trends and Controversial Topics
635
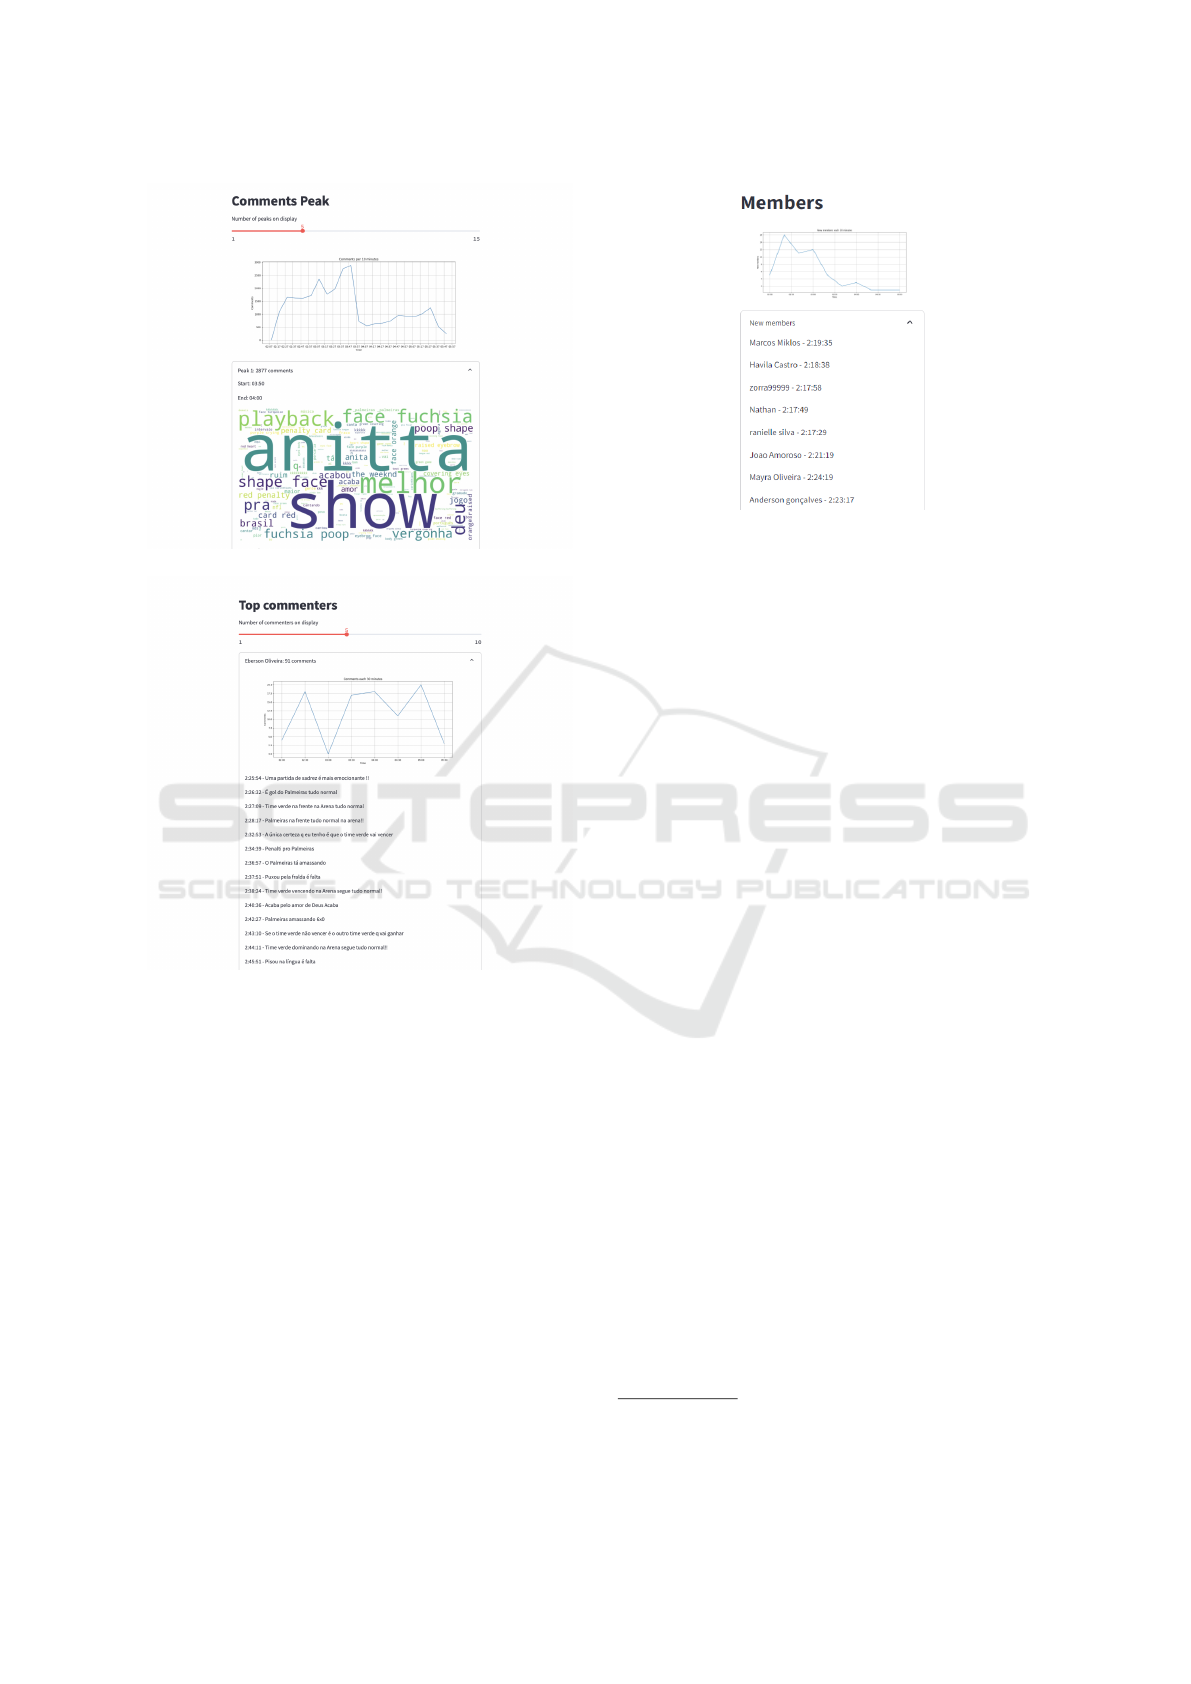
Figure 4: StreamVis comments peak page.
Figure 5: StreamVis top commenters page.
StreamVis provides an easy-to-use platform for
analyzing YouTube comments and live chat data.
Through its interactive components, including time-
series charts, word clouds, and user activity tracking,
the tool facilitates in-depth exploration of audience
engagement.
The flexibility afforded by customizable time in-
tervals, filtering capabilities, and visual representa-
tions allows the platform to adapt to diverse analytical
contexts. Whether analyzing overall chat dynamics to
understand general audience engagement, zooming in
on key moments of significance, or identifying stand-
out trends and commenters, StreamVis provides the
tools necessary to explore the data from various per-
spectives.
Figure 6: StreamVis new members page.
5 CASE STUDY
In this section, we present a case study to exemplify
the use and potential of the developed approach.
5.1 NFL and Its First Game in Brazil
The NFL has been heavily investing in its internation-
alization strategy since 2007, when it held its first
game outside the United States, between the New
York Giants and the Miami Dolphins at Wembley Sta-
dium in London. This event marked the beginning
of the NFL International Games, which have since
expanded, with London becoming the main hub for
the league’s international games. Between 2007 and
2023, more than 30 regular season games were played
in the English capital, at venues such as Wembley and
Tottenham Hotspur Stadium
13
.
The peak of this expansion reached Brazil in 2024,
with the first NFL game on Brazilian soil, held on
September 6th at Neo Qu
´
ımica Arena in S
˜
ao Paulo,
the stadium of the Corinthians football team. The
event attracted more than 47,000 people to the sta-
dium and was a milestone for the NFL’s presence in
South America, breaking audience records both in the
American and Brazilian broadcasts
14
.
5.2 Game Analysis Through the
Proposed Platform
The Eagles and Packers game started at 9:15 PM
Brasilia time (Brazil); however, the official live broad-
cast on Caz
´
e TV’s YouTube channel began two hours
13
https://tinyurl.com/hj6622mk
14
https://tinyurl.com/ny6y2rr4
ICEIS 2025 - 27th International Conference on Enterprise Information Systems
636
earlier. The analysis presented below refers exclu-
sively to the game period, from the kickoff (9:15
PM) until its conclusion (past midnight). In total, the
match lasted approximately 3 hours and 50 minutes,
during which data collection occurred, resulting in
28,524 comments during the live stream, representing
an average of 2 comments per second. This figure is
noteworthy, as a higher number of posts was initially
expected. The authors feared a bottleneck in data col-
lection due to limitations of the YouTube API, which
did not occur, making it possible to capture nearly all
the comments made.
A total of 9,500 users made comments during the
live stream, with an average of 3 comments per user.
This number can also be considered low, as the num-
ber of views approached 3 million, with comments
representing less than 0.5 of the views. The most
active user posted 91 comments, averaging approx-
imately 17 comments during the 30-minute periods
in which they were most active. The 10 most active
users averaged around 80 comments, showing varied
frequency patterns throughout the game, as illustrated
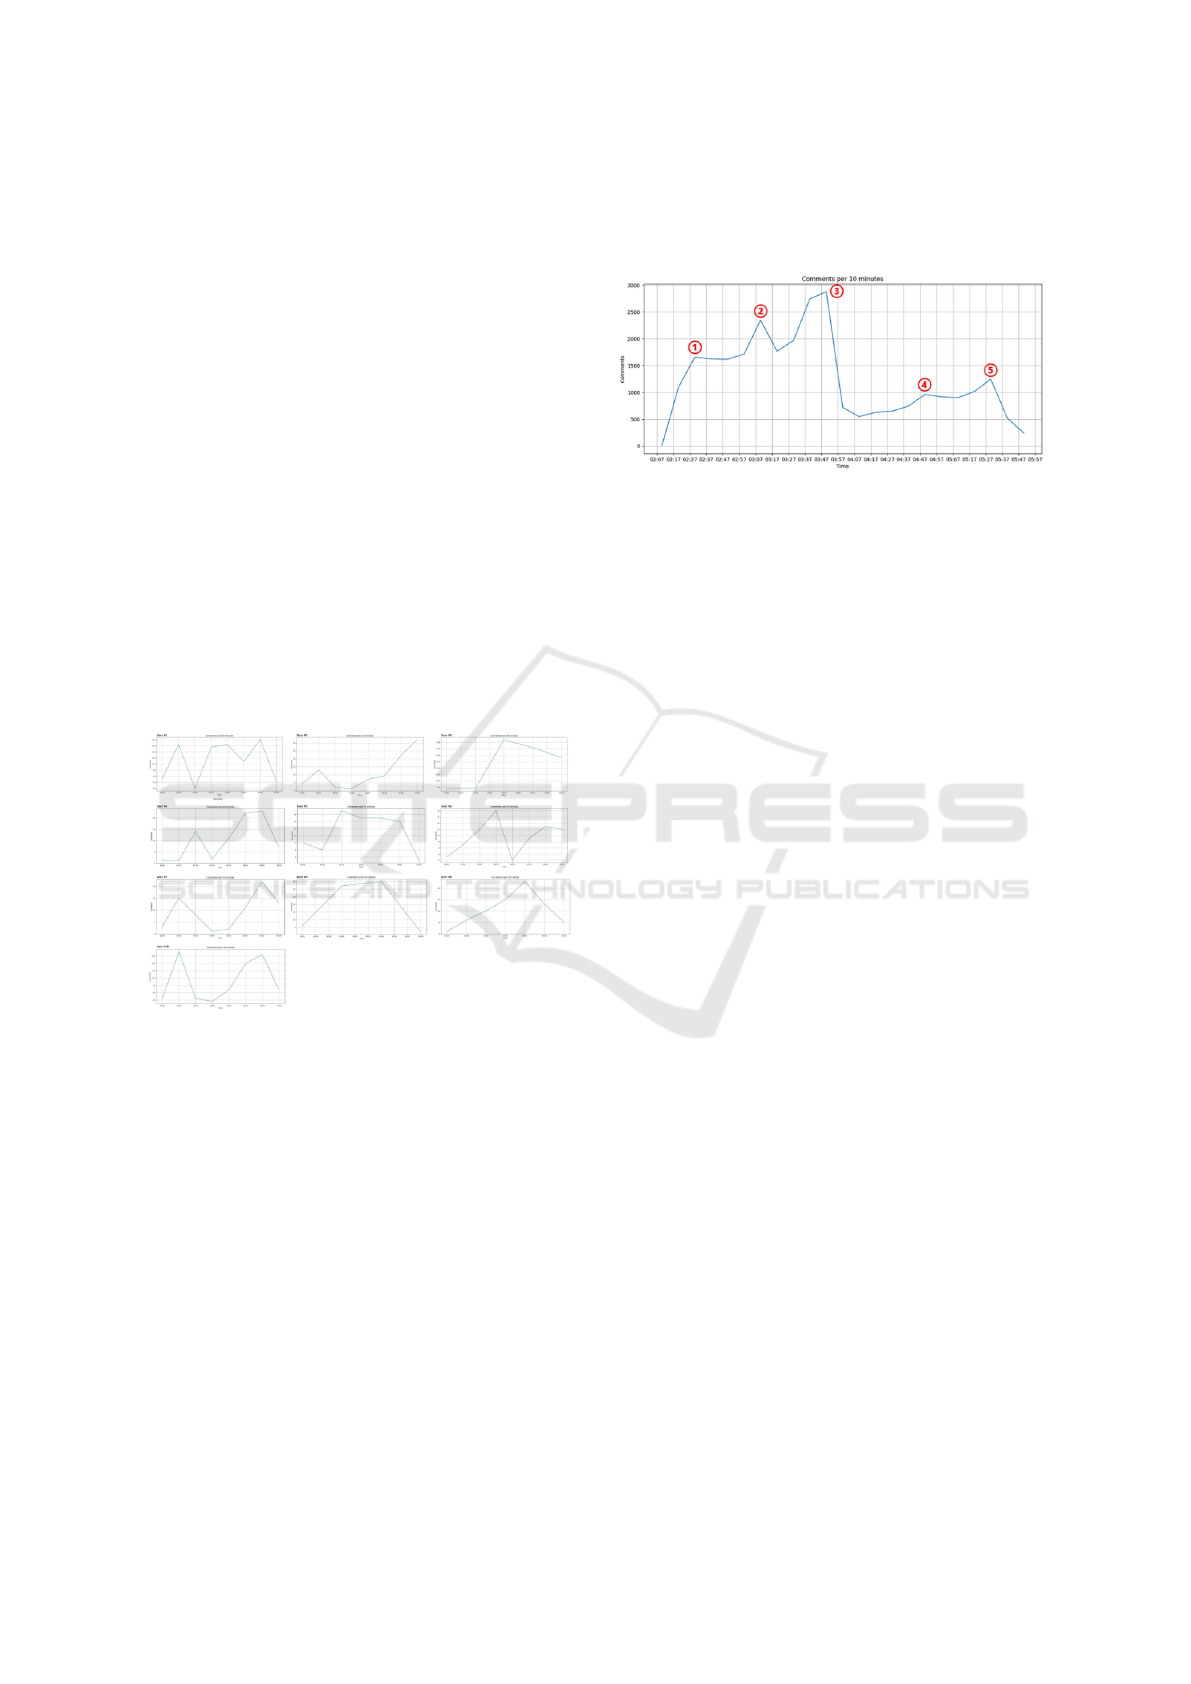
in Figure 7.
Figure 7: Comments throughout the live stream by the top
10 users.
Figure 7 shows the distribution of all comments
over the course of the game, allowing for a deeper
analysis of user behavior. What one can observe in
the ten charts shown in Figure 7 is that there are dis-
tinct behaviors among users. Primarily, users’ posting
behavior does not follow a consistent curve, as one
might expect from a professional commentator or a
game narrator. Driven by fan support for the team or
attention to specific plays, the curves suggest different
motivations for engagement, which becomes evident
when examining individual messages more closely.
Considering the overall numbers of the comments,
there were 135,498 words with 23,172 unique words,
and an average of 4.75 words per comment. When all
comments made during the game broadcast are ag-
gregated into a line chart based on the comment fre-
quency one can observe an increasing interest toward
the middle of the match and a decreasing interest in
the second half, represented in Figure 8.
Figure 8: Comments throughout the live stream.
The three highest peaks of interest in terms of
comments are clustered in the first half. Typically,
fan enthusiasm and key plays prompt increased com-
menting. Our platform can analyze each peak in de-
tail using segmented word clouds. The first peak,
comprising 1,655 comments (5.8% of the total), oc-
curred during one of the initial commercial breaks
(Figure 9), highlighting a common second-screen be-
havior where viewers shift their attention to chat and
comments during pauses in the main broadcast. This
break followed a field goal by the Green Bay Pack-
ers, a moment that sparked a trend seen throughout
the broadcast: references and comparisons between
American football (NFL) and soccer (the dominant
sport in Brazil and the location of the event, held at
the Corinthians football club stadium). In this con-
text, the recurrence of the word ‘Goi
´
as’ stands out, re-
ferring to Goi
´
as Futebol Clube, which shares a similar
visual identity with the Green Bay Packers. Viewers
played on this similarity with comments like ‘VAMO
GOI
´
AS, 3X0 J
´
A’ (LET’S GO GOI
´
AS, 3-0 NOW),
‘Goi
´
as 3 X 0 Corinthians?’ and ‘CARACA KKK
GOI
´
AS T
´
A JOOOGANDO!!!!’ (WOW LOL GOI
´
AS
IS PLAYIIING!!!!). Moreover, much of the discus-
sion centered on ‘Anitta,’ the Brazilian singer per-
forming at the halftime show, with comments such
as ‘we want Anitta,’ ‘When is Anitta’s show???,’ and
‘Come on, Anitta.’
The second peak also occurred during the break
following another score, with 2,349 comments
(8.2%), already indicating a higher frequency of
viewers as the main break and the show approached.
At this point, mentions of the singer ‘Anitta’ were al-
ready considerably higher than any other topic. Dur-
ing the third peak, Anitta’s show finally took place,
directly mentioned in the comments, with 2,877 com-
ments (10% from the total). The comments reveals
a high volume of criticism directed at the show,
with words like ‘playback’ and ‘shame’ standing
out. Throughout Anitta’s performance, the comments
StreamVis: An Analysis Platform for YouTube Live Chat Audience Interaction, Trends and Controversial Topics
637
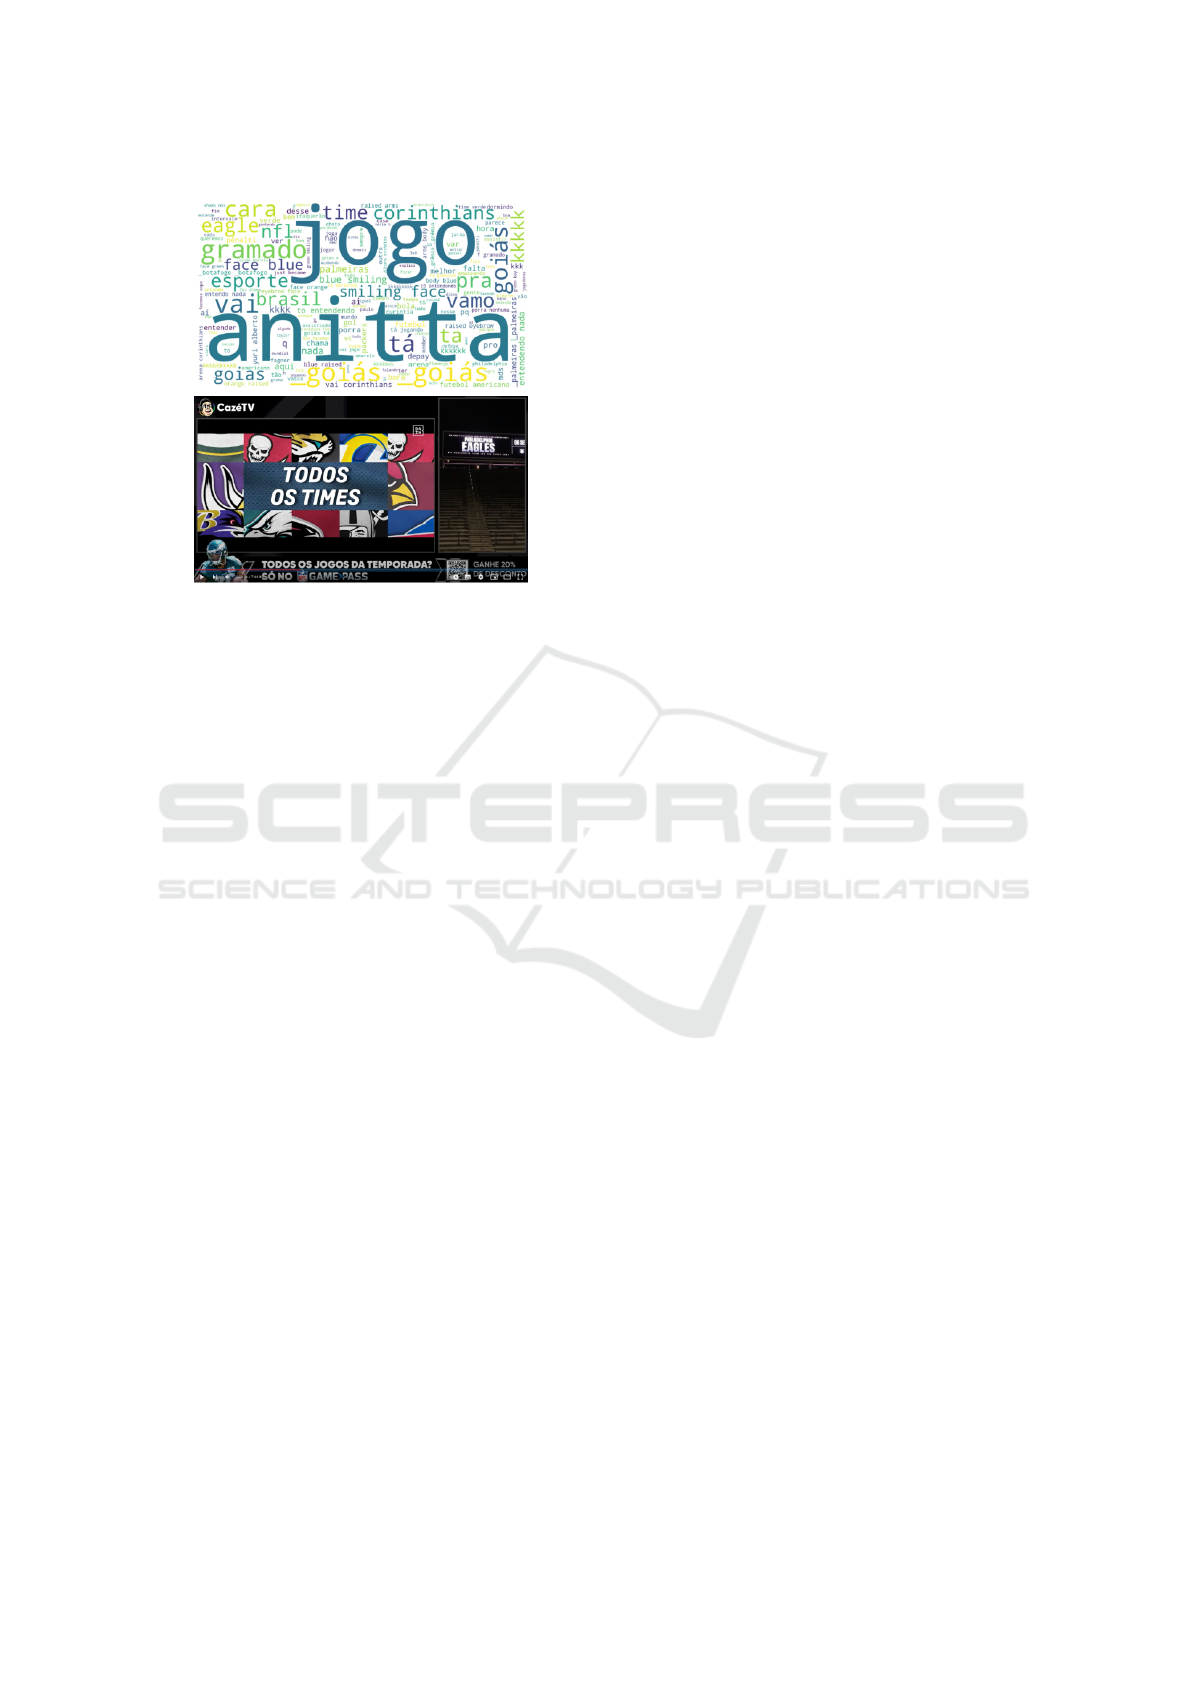
Figure 9: Wordcloud of peak one comments.
were divided between criticism of her use of playback
and her decision to sing only her international songs
rather than her native Portuguese repertoire of songs.
It is also worth noting the word ‘better,’ which, when
analyzed in isolation, might seem positive, but upon
reviewing the comments, its tone aligned with the crit-
ical sentiment of the audience: ‘wasn’t there a bet-
ter singer???,’ ‘the game deserved something better,’
‘so many better and quality artists to choose from,’
among others. Few comments used ‘better’ in a com-
plimentary manner. The presence of emojis in the
comments was also noteworthy, with a significant vol-
ume of expressions representing shame and criticism.
‘shame’ / Fuchsia Poop / poop shape (poop emoji?) /
face fuchsia (shame?)”
The fourth peak occurred during a rare game mo-
ment: a field goal hitting the post, which allows for
a direct comparison to soccer. This peak had 964
comments (3.3%), with most of them once again fo-
cusing on the game, consistently making references
to soccer. The pitch and its quality were frequently
mentioned. Athlete LeBron James criticized the pitch
on his social media, which reignited discussions in
the live chat about its quality and concerns that the
sport might be ‘ruining’ the stadium’s pitch. Some
of the comments included: ‘LeBron criticized the
pitch, oh boy,’ ‘Is it just me, or is the pitch deterio-
rating?’, ‘EVEN LEBRON COMPLAINED ABOUT
THE PITCH,’ ‘COME ON CORINTHIANS, WHAT
ARE THEY DOING TO OUR PITCH, IT’S A DIS-
GRACE.’”
Finally, peak 5 had 1,247 comments (4.3%),
around the time of an error in the official broadcast
that incorrectly announced a touchdown and mistak-
enly changed the score, a fact that was highlighted by
the commentators and caught viewers’ attention. In
spite of that, this incident itself did not stand out in
the comments, once more focused on the connection
to soccer. The presence of the words ‘Corinthians,’
‘Tim
˜
ao’ (a popular nickname for the team in Brazil),
and ‘Vai Corinthians’ (a characteristic chant among
the fans) versus ‘Goi
´
as’ brought soccer back into the
spotlight. Another analysis enabled by the tool re-
lates to the channel’s members. The channel has a
membership area that offers benefits in exchange for
a monthly subscription. These benefits range from a
badge in the chat to the opportunity to make more fre-
quent comments. Regarding memberships, there were
57 new members during the game. It is possible to
observe a trend that the beginning of the games has
a higher potential for attracting new members, with
this number decreasing significantly as the match pro-
gresses.
6 DISCUSSION
While many studies, such as those by Mehta and
Deshmukh (Mehta and Deshmukh, 2022), focused
on pre-recorded videos and YouTube ads, this
work specifically targets live streaming environments,
which present unique challenges and opportunities in
real-time data gathering and its subsequent analysis.
The idea of collecting and analyzing live com-
ments and chats during YT broadcasts has proven
rich in possibilities and relatively simple to imple-
ment. Firstly, StreamVis does not automatically pro-
vide a way to receive live video or audio feeds, as
typical in TV broadcasts or platforms like Stream-
Yard. Thus, the primary feedback channel chosen by
YouTube is text, which includes using slang, hash-
tags, and emojis, adding different inflections to the in-
teraction. Previous research on comment analysis has
mainly addressed content moderation and spam de-
tection in pre-recorded content, as seen in the works
of Latorre and Amores (Latorre and Amores, 2021)
or Abdullah et al. (Abdullah et al., 2018). In con-
trast, our approach focuses on providing insights into
audience engagement and interaction dynamics dur-
ing live streams, making it more relevant to dynamic
broadcasting scenarios.
Besides, we are not directly analyzing video or au-
dio content, which would require significantly more
computational power. This allows our platform to be
used on various machines without needing high-end
hardware. This accessibility is advantageous, as it
opens opportunities for analysts, consultants, and pro-
fessionals interested in understanding and evaluating
engagement with YT live content. Our platform im-
ICEIS 2025 - 27th International Conference on Enterprise Information Systems
638

plementation emphasizes visual analytics using, e.g.,
frequency charts and word clouds, allowing users to
interpret trends in live chat data interactively. This
visual approach sets this tool apart from traditional
text-based sentiment analysis methods used in earlier
studies.
The ability to perform a visual analysis of the
data allows the StreamVis users to develop a macro
understanding of the dynamics during the broadcast
and audience engagement, and a granular view that
enables them to examine conversations in detail and
identify situations or moments that acted as turning
points. This dual perspective helps users capture
broader trends while also pinpointing specific inter-
actions or events that significantly influenced the flow
of the live broadcast. When aligned with an under-
standing of what was happening in the broadcast dur-
ing those specific minutes, the visual nature of peaks
allows us to build an insight into how people collec-
tively react to what is being shown. We recognize that
different events can elicit varying behaviors, and even
the behavior of the most active users is not necessarily
convergent.
The choice of an NFL game as the proof-of-
concept of our platform was intentional for several
reasons. First, the novelty of the sporting event guar-
anteed attention and was likely to drive engagement.
Additionally, the growing interest in American foot-
ball in Brazil is a proxy to the richer strata of the popu-
lation, one with widely available internet services and
devices, consequently abundant participation on YT
and other platforms.
7 FINAL REMARKS
The work done in this study contributes to the existing
area research by introducing a platform specifically
designed for YouTube live chat analysis, which allows
real-time data gathering, visualization of user engage-
ment, trending topics, and emotional intensity during
live events. We provide all the codes of our data gath-
ering and visual analytics approach at the GitHub
15
,
and the StreamVis app is available online
16
for any-
one who wants to use it. Thus, it is possible to gather
and analyze data from different contexts.
As future possibilities for this research, we be-
lieve that integrating other natural language process-
ing models and AI infrastructures will enable a more
detailed sentiment analysis, potentially allowing for
seamless operation in multiple languages. This would
15
https://github.com/DAVINTLAB/StreamVis
16
https://davint-live-comments.streamlit.app
make it possible to observe the reactions of inter-
national audiences to the same event that attracts
viewers from various countries, such as the Olympic
Games, the UEFA Champions League, or other simi-
lar sporting events.
ACKNOWLEDGEMENTS
Carraro and M
¨
uller would like to thank the Tutorial
Education Program (PET). Manssour would like to
thank the financial support of the CNPq Scholarship -
Brazil (303208/2023-6).
While preparing and revising this manuscript, we
used ChatGPT, Grammarly, and Google Translate to
enhance clarity and grammatical precision, as English
is not our first language. The authors take full respon-
sibility for the content and its technical accuracy.
REFERENCES
Abdullah, A. O., Ali, M. A., Karabatak, M., and Sengur, A.
(2018). A comparative analysis of common youtube
comment spam filtering techniques. In 2018 6th Inter-
national Symposium on Digital Forensic and Security
(ISDFS), pages 1–5.
Barnouw, E. (1990). Tube of Plenty: The Evolution of
American Television. Oxford University Press.
Bourdon, J. and M
´
eadel, C. (2014). Television Audiences
Across the World: Deconstructing the Ratings Ma-
chine. Palgrave Macmillan UK.
Burgess, J. and Green, J. (2018). YouTube: Online Video
and Participatory Culture. Digital Media and Society.
Polity Press.
Chalkias, I., Tzafilkou, K., Karapiperis, D., and Tjortjis, C.
(2023). Learning analytics on youtube educational
videos: Exploring sentiment analysis methods and
topic clustering. Electronics, 12(18).
Dubovi, I. and Tabak, I. (2020). An empirical analysis
of knowledge co-construction in youtube comments.
Computers & Education, 156:103939.
Guo, J. and Fussell, S. R. (2020). A preliminary study of
emotional contagion in live streaming. In Compan-
ion Publication of the 2020 Conference on Computer
Supported Cooperative Work and Social Computing,
CSCW ’20 Companion, page 263–268, New York,
NY, USA. Association for Computing Machinery.
Latorre, J. P. and Amores, J. J. (2021). Topic mod-
elling of racist and xenophobic youtube comments.
analyzing hate speech against migrants and refugees
spread through youtube in spanish. In Ninth Inter-
national Conference on Technological Ecosystems for
Enhancing Multiculturality (TEEM’21), TEEM’21,
page 456–460, New York, NY, USA. Association for
Computing Machinery.
StreamVis: An Analysis Platform for YouTube Live Chat Audience Interaction, Trends and Controversial Topics
639

Liebeskind, C., Liebeskind, S., and Yechezkely, S. (2021).
An analysis of interaction and engagement in youtube
live streaming chat. In 2021 IEEE SmartWorld,
Ubiquitous Intelligence & Computing, Advanced &
Trusted Computing, Scalable Computing & Commu-
nications, Internet of People and Smart City Inno-
vation (SmartWorld/SCALCOM/UIC/ATC/IOP/SCI),
pages 272–279.
Luo, M., Hsu, T. W., Park, J. S., and Hancock, J. T. (2020).
Emotional amplification during live-streaming: Evi-
dence from comments during and after news events.
Proc. ACM Hum.-Comput. Interact., 4(CSCW1).
Marc, D. (1996). Demographic Vistas: Television in Amer-
ican Culture. University of Pennsylvania Press.
Mehta, T. and Deshmukh, G. (2022). Youtube ad view senti-
ment analysis using deep learning and machine learn-
ing. International Journal of Computer Applications,
184(11):10–14.
Siersdorfer, S., Chelaru, S., Nejdl, W., and San Pedro, J.
(2010). How useful are your comments? analyzing
and predicting youtube comments and comment rat-
ings. In Proceedings of the 19th International Confer-
ence on World Wide Web, WWW ’10, page 891–900,
New York, NY, USA. Association for Computing Ma-
chinery.
Singh, R. and Tiwari, A. (2021). Youtube comments sen-
timent analysis. International Journal of Scientific
Research in Engineering and Management (IJSREM),
5(5):1–11.
Sterling, C. and Kittross, J. M. (2001). Stay Tuned: A His-
tory of American Broadcasting. Routledge Communi-
cation Series. Taylor & Francis.
Tarafder, T., Vashisth, H. K., and Arora, M. (2023). Au-
tomated tool for toxic comments identification on live
streaming youtube. In International Conference on
MAchine inTelligence for Research & Innovations,
pages 47–56. Springer.
Tirpude, S., Thakre, Y., Sudan, S., Agrawal, S., and
Ganorkar, A. (2024). Mining comments and senti-
ments in youtube live chat data. In 2024 4th In-
ternational Conference on Intelligent Technologies
(CONIT), pages 1–6.
Uryupina, O., Plank, B., Severyn, A., Rotondi, A., Mos-
chitti, A., et al. (2014). Sentube: A corpus for sen-
timent analysis on youtube social media. In LREC,
pages 4244–4249.
Yang, S., Yim, J., Kim, J., and Shin, H. V. (2022). Catchlive:
Real-time summarization of live streams with stream
content and interaction data. In Proceedings of the
2022 CHI Conference on Human Factors in Comput-
ing Systems, CHI ’22, New York, NY, USA. Associa-
tion for Computing Machinery.
Yasin, S., Ullah, K., Nawaz, S., Rizwan, M., and Aslam,
Z. (2020). Dual language sentiment analysis model
for youtube videos ranking based on machine learn-
ing techniques. Pakistan Journal of Engineering and
Technology, 3(2):213–218.
Yousukkee, S. and Wisitpongphan, N. (2021). Analy-
sis of spammers’ behavior on a live streaming chat.
IAES International Journal of Artificial Intelligence,
10(1):139.
ICEIS 2025 - 27th International Conference on Enterprise Information Systems
640
