
Evaluating Performance and Acceptance of the UUXE-ToH
Questionnaire for Touchable Holographic Solutions
Thiago Prado de Campos
1,3 a
, Saul Delabrida
2 b
, Eduardo Filgueiras Damasceno
1 c
and Natasha M. C. Valentim
3 d
1
Universidade Tecnol
´
ogica Federal do Paran
´
a, Brazil
2
Universidade Federal de Ouro Preto, Brazil
3
Universidade Federal do Paran
´
a, Brazil
Keywords:
Usability, User Experience, Evaluation, UUXE-ToH Questionnaire, Touchable Holographic Solutions,
Augmented Reality, Mixed Reality.
Abstract:
Touchable Holographic Solutions (THS) enable natural hand interactions with virtual objects in augmented
and mixed reality environments, presenting unique challenges for usability and user experience (UX) evalua-
tion. Traditional tools, such as the System Usability Scale (SUS) and User Experience Questionnaire (UEQ),
do not adequately address critical aspects of THS, including immersion and presence. The UUXE-ToH ques-
tionnaire was developed to bridge this gap, integrating usability and UX dimensions into a single instrument
tailored to THS contexts. This paper presents the results of a performance and acceptance study conducted
during a workshop at a conference on Human-Computer Interaction (HCI). The study compared UUXE-ToH
v4 with a combination of established instruments, using the Cubism game as a case study on Meta Quest 2
and Meta Quest 3 devices. Fourteen participants evaluated the game using one of the two approaches, pro-
viding feedback on effectiveness, efficiency, and technology acceptance. Results show that UUXE-ToH v4
enabled the identification of a greater number of unique usability and UX issues and scored higher in ease of
use and future intention to use compared to the combined instruments. These findings highlight the robustness
and applicability of UUXE-ToH v4 in evaluating THS, offering significant insights for improving evaluation
methodologies and the design of interactive holographic solutions.
1 INTRODUCTION
Touchable Holographic Solutions (THS) represent a
major innovation in Augmented Reality (AR) and
Mixed Reality (MR), enabling users to interact natu-
rally with holograms via midair hand gestures (Kerve-
gant et al., 2017; Billinghurst et al., 2015). By re-
moving the need for physical touch surfaces, these so-
lutions provide more immersive and intuitive experi-
ences. However, their unique features, such as immer-
sion and presence, pose challenges for usability and
User Experience (UX) assessment, often inadequately
addressed by traditional tools like the System Usabil-
ity Scale (SUS) (Brooke, 1996) and the User Experi-
ence Questionnaire (UEQ) (Laugwitz et al., 2008).
a
https://orcid.org/0000-0003-1038-4004
b
https://orcid.org/0000-0002-8961-5313
c
https://orcid.org/0000-0002-6246-1246
d
https://orcid.org/0000-0002-6027-3452
To address this gap, the Usability and User eXpe-
rience Evaluation for Touchable Holography (UUXE-
ToH) questionnaire was developed as a dedicated
tool for assessing usability and UX in THS (Prado
De Campos et al., 2024). Previous studies exam-
ined its content, face, semantic, and structural valid-
ity, along with internal consistency (Campos et al.,
2024a). These efforts shaped its evolution to UUXE-
ToH v4, refined through expert and user feedback and
adapted for AR/MR contexts. This study builds on
that foundation by comparing the performance and
acceptance of UUXE-ToH v4 with established instru-
ments during an HCI workshop at the Brazilian Sym-
posium on Human Factors in Computing Systems
(IHC 2024) (Campos et al., 2024b).
The study involved 14 participants with varying
levels of expertise in usability, UX, and AR/MR, who
evaluated the Cubism game
1
on Meta Quest 2 and
1
https://www.cubism-vr.com/
Campos, T. P., Delabrida, S., Damasceno, E. F. and Valentim, N. M. C.
Evaluating Performance and Acceptance of the UUXE-ToH Questionnaire for Touchable Holographic Solutions.
DOI: 10.5220/0013447100003929
In Proceedings of the 27th International Conference on Enterprise Information Systems (ICEIS 2025) - Volume 2, pages 641-648
ISBN: 978-989-758-749-8; ISSN: 2184-4992
Copyright © 2025 by Paper published under CC license (CC BY-NC-ND 4.0)
641

Meta Quest 3 devices. Participants were divided into
two groups: one used the UUXE-ToH v4 question-
naire, while the other used a combination of estab-
lished instruments. To assess the effectiveness of the
evaluation tools, the total number of issues identified
by each group was analyzed, distinguishing between
unique and duplicate issues. Efficiency was measured
as the number of issues identified per minute, calcu-
lated based on the recorded evaluation time for each
participant. Feedback was also collected using an
adapted Technology Acceptance Model (TAM) form
(Venkatesh and Bala, 2008), capturing participants’
perceptions of perceived utility, ease of use, and fu-
ture intention to use the tools.
Both statistical analyses, including tests for signif-
icance, and qualitative analyses of open-ended feed-
back revealed that UUXE-ToH v4 enabled the iden-
tification of a more significant number of unique is-
sues and achieved higher ratings for ease of use and
behavioral intent. This indicates its advantages as an
evaluation tool in the context of THS. These findings
reinforce the value of UUXE-ToH v4 in advancing us-
ability and UX evaluations for emerging interactive
technologies, providing a robust and user-centered
approach tailored to the distinctive attributes of THS.
The remainder of this paper is organized as fol-
lows: Section 2 reviews related work, providing con-
text for the study. Section 3 introduces the UUXE-
ToH v4 questionnaire, the core focus of this research.
Section 4 outlines the study design, detailing the pro-
cedures, data analysis methodology and participants
profile. Section 5 presents the study’s findings on per-
formance and acceptability. Section 6 offers a discus-
sion of the results, and Section 7 concludes with final
considerations, including the study’s limitations and
directions for future research.
2 RELATED WORKS
The evaluation of usability and UX in interactive sys-
tems often relies on questionnaires such as the System
Usability Scale (SUS) (Brooke, 1996), the User Expe-
rience Questionnaire (UEQ) (Laugwitz et al., 2008),
and the Usefulness, Satisfaction, and Ease of Use
Questionnaire (USE) (Gao et al., 2018). These instru-
ments are widely used due to their simplicity and reli-
ability across various contexts. However, they present
limitations when adapted to emerging technologies
like THS (Campos et al., 2023; Campos et al., 2025).
The SUS (Brooke, 1996) is one of the most widely
used tools for assessing perceived usability. Its con-
cise 10-item format, rated on a 5-point Likert scale,
provides a unidimensional usability measure. While
early studies suggested a bifactor structure (Usabil-
ity and Learnability) (Lewis and Sauro, 2009), later
analyses with larger datasets confirmed SUS func-
tions better as a single-dimension instrument (Lewis
and Sauro, 2017). Despite its reliability and ease of
use, SUS evaluates usability generically, without ad-
dressing specific dimensions like Efficiency, Satisfac-
tion, or Immersion. Thus, while useful for a quick
usability overview, it lacks the depth needed to assess
the complex interactions of THS.
The USE questionnaire (Laugwitz et al., 2008),
developed to assess usability through four dimensions
— Usefulness, Ease of Use, Ease of Learning, and
Satisfaction — has demonstrated strong psychome-
tric reliability, with Cronbach’s alpha reaching 0.98
(Gao et al., 2018). Its effectiveness lies in covering
key usability aspects, with 30 items rated on a 7-point
Likert scale. However, its limited focus restricts its
adaptability to THS environments, where nuanced in-
teractions require deeper contextual sensitivity.
The UEQ (Gao et al., 2018) offers a comprehen-
sive UX assessment across six dimensions: Attrac-
tiveness, Perspicuity, Efficiency, Dependability, Stim-
ulation, and Novelty. It balances pragmatic and hedo-
nic aspects, using 26 word pairs on a 7-point seman-
tic differential scale to capture user perceptions. Al-
though validated through task-based studies and com-
parisons with tools like AttrakDiff2 (Laugwitz et al.,
2008), the UEQ lacks specificity for immersive and
interactive contexts like AR/MR, where Immersion
and Presence are critical.
The Slater-Usoh-Steed Inventory (Slater et al.,
1994; Usoh et al., 2000), also known as SUS, was
designed explicitly to measure Presence in virtual en-
vironments, employs six items to gauge the user’s
sense of “being there.” Despite its popularity in VR
research, this tool has undergone limited psychomet-
ric validation and doesn’t have adaptation for mixed-
reality settings, where both subjective and technolog-
ical factors interplay uniquely.
Together, these instruments offer valuable insights
but fall short in addressing the integrated usability and
UX challenges posed by THS. Their combined use in
evaluations may lead to redundancy and user fatigue,
complicating data interpretation.
To address these gaps, the UUXE-ToH question-
naire was developed as a tailored solution for THS.
Incorporating 56 Likert-scale items and open-ended
questions, it uniquely combines pragmatic usability
aspects (e.g., Effectiveness, Efficiency, Learnability)
with hedonic UX aspects (e.g., Immersion, Presence,
Engagement and Emotions). This instrument under-
went rigorous validation, including content, face, se-
mantic, and structural validations, ensuring its suit-
ICEIS 2025 - 27th International Conference on Enterprise Information Systems
642

ability for capturing the complex dynamics of THS
user interactions. This comprehensive approach al-
lows it to evaluate THS-specific factors effectively,
offering a holistic framework unmatched by generic
or narrowly focused instruments.
The present study focuses on comparing the per-
formance and acceptability of the UUXE-ToH with
a combination of established tools (USE, UEQ, and
Slater-Usoh-Steed Inventory) in evaluating usability
and UX in THS. By examining the effectiveness, ef-
ficiency, and user acceptance of UUXE-ToH relative
to these combined technologies, this research aims to
provide empirical evidence of its advantages as a uni-
fied instrument. This comparison, conducted during
a controlled evaluation of the holographic game Cu-
bism using different headsets, seeks to highlight the
practical benefits of employing a specialized, compre-
hensive tool like UUXE-ToH over the combined use
of multiple general-purpose questionnaires.
3 UUXE-ToH v4
The UUXE-ToH is a questionnaire designed to as-
sess usability and user experience (UX) in THS. Its
fourth version (v4) comprises 19 aspects covering key
dimensions of usability and UX, such as Effective-
ness, Efficiency, Learnability, Comfort, Memorabil-
ity, Immersion, Presence, Pleasure and Fun, Interest,
and Absorption (Flow). Sentences related to Pleasure
and Fun, as well as Emotions, use a semantic differ-
ential scale, while the other items are assessed using
a 7-point Likert scale, enabling precise response gra-
dation. Additionally, the option “Not applicable” is
included to increase flexibility and applicability.
The questionnaire contains 56 objective items or-
ganized into categories based on the mentioned as-
pects. Furthermore, it includes four open-ended ques-
tions to capture qualitative insights about positive
experiences, encountered difficulties, improvement
suggestions, and comparisons with similar solutions.
This combination of quantitative and qualitative as-
sessments ensures a comprehensive analysis of users’
interactions with the THS. An English-translated ver-
sion of UUXE-ToH v4 is available online
2
.
4 STUDY PLANNING
This section describes the context of the study, ethical
approval, procedures, instrumentation, the methodol-
ogy used for data analysis, and the participants’ pro-
2
https://doi.org/10.6084/m9.figshare.28446956
file. The study was conducted during a workshop at
the Brazilian Symposium on Human Factors in Com-
puting Systems (IHC 2024), held on October, 2024, at
the Professional Practices and Applied Research Lab-
oratory (PAPP Lab) of the Federal Institute of Bras
´
ılia
(IFB). The workshop provided an ideal setting to test
the UUXE-ToH v4 questionnaire with a diverse group
of participants knowledgeable in usability and UX.
An amendment to a previous research project
was submitted to the Ethics Committee of the Fed-
eral University of Paran
´
a (UFPR), following all eth-
ical guidelines for human participant studies. The
project was approved under the protocol CAAE
77369524.6.0000.0102.
4.1 Procedures and Instrumentation
Participants were invited to join voluntarily, with no
repercussions for those opting out. Before participa-
tion, they were introduced to the study’s objectives,
potential risks, and benefits. Those who agreed to par-
ticipate signed an Informed Consent Form (ICF) and
completed a demographic questionnaire.
Participants interacted with the Cubism game, a
MR puzzle game that involves assembling 3D geo-
metric shapes, using either the Meta Quest 2 or Meta
Quest 3 devices for 10 minutes. The choice of Cubism
was intentional due to its simplicity and accessibility,
which allowed participants with varying levels of ex-
perience with MR technology to engage effectively.
Additionally, the straightforward nature of the game
minimized operational challenges, reducing the risk
of bias in participants’ interactions and ensuring that
their focus remained on evaluating the usability and
UX aspects of the holographic solution.
They were then divided into two groups. Group
A evaluated the solution using the UUXE-ToH v4
questionnaire. Group B used a combination of estab-
lished instruments, specifically the Usefulness, Satis-
faction, and Ease of Use Questionnaire (USE) (Gao
et al., 2018), Slater-Usoh-Steed (SUS) (Slater et al.,
1994), and User Experience Questionnaire (UEQ)
(Laugwitz et al., 2008), referred to collectively as
USE+SUS+UEQ.
The combination of the USE, SUS, and UEQ
questionnaires was chosen for Group 2 due to their
established validity and broad use in usability and
UX evaluations. Each instrument covers distinct
aspects: USE assesses usability through four con-
structs—Usefulness, Ease of Use, Ease of Learn-
ing, and Satisfaction—using 30 items on a 7-point
Likert scale; UEQ evaluates UX across six dimen-
sions—Attractiveness, Perspicuity, Efficiency, De-
pendability, Stimulation, and Novelty—using 26
Evaluating Performance and Acceptance of the UUXE-ToH Questionnaire for Touchable Holographic Solutions
643

word pairs on a 7-point semantic differential scale;
and the Slater-Usoh-Steed (SUS) questionnaire mea-
sures Immersion and Presence in virtual reality via six
items on a 7-point scale. Together, these tools provide
62 items across scales similar to UUXE-ToH v4 (56
items), supporting reliable comparative analysis while
covering overlapping quality criteria identified in sys-
tematic mapping studies on the topic (Campos et al.,
2023; Campos et al., 2025).
The participants completed their respective eval-
uation questionnaires on paper and conducted an
inspection-based evaluation of the game, using the
questionnaire items as a guide to identify and report
issues. At the end of the session, all participants com-
pleted a form based on the Technology Acceptance
Model (TAM v3) (Venkatesh and Bala, 2008) to as-
sess their acceptance of the evaluation technology.
4.2 Data Analysis
Descriptive statistics summarized participant re-
sponses. Normality tests (Shapiro-Wilk) determined
the appropriate statistical tests for group comparisons.
Non-parametric tests were applied for non-normally
distributed data, ensuring consistent comparisons.
Performance Analysis. It was evaluated in terms of
effectiveness and efficiency. Effectiveness was mea-
sured by the number of unique and duplicate issues
identified. Issues were categorized as unique (re-
ported by one participant) or duplicate (reported by
multiple participants), with the total number reflect-
ing effectiveness. Efficiency was calculated by divid-
ing the total issues identified by evaluation time. Par-
ticipants recorded their start and end times, and group
efficiency was determined as total issues identified di-
vided by the group’s average evaluation time.
Acceptability Analysis. It was measured using the
TAM responses, converted to a 1–7 scale. The me-
dian values for each TAM construct were calculated
and statistical tests (Mann-Whitney U or Student’s t-
test, depending on the data distribution) were used to
compare the groups.
Qualitative Analysis. Open-ended responses from
the TAM form were analyzed using the first two
phases of Grounded Theory: open and axial coding.
This method identified common themes, issues, and
suggestions related to the evaluation technology.
4.3 Participants
The study involved 14 participants, comprising five
men and nine women. The participants’ ages ranged
from 18 to 50 years, with three aged between 18 and
20, nine aged between 21 and 30, and two aged be-
tween 41 and 50. Regarding education, the group in-
cluded one Ph.D., one Ph.D. candidate, one master’s
student, and 11 undergraduates.
Most participants had expertise in relevant areas:
13 in Usability, 12 in UX, four in Virtual Reality
(VR), and four in AR/MR. Many also had experience
planning or conducting usability and UX evaluations,
either in academia (11 participants) or industry (4 par-
ticipants). Specifically, 11 had conducted up to four
evaluations, two had experience with five to 15, and
one had conducted over 15.
Regarding AR/MR/VR knowledge, one partici-
pant was a novice, with the workshop as their first
exposure. Seven had basic knowledge, understand-
ing the terms; two were intermediate, familiar with
their applications; and four were advanced, integrat-
ing AR/MR/VR into daily activities. For experience
with AR/MR/VR applications using head-mounted
displays (HMDs), three had never used them, nine
used them rarely, one used them monthly, and one
used them weekly. Eight participants were profes-
sionals from research groups and companies engaged
in activities directly related to HCI, AR/MR, and ad-
vanced interactive systems.
5 RESULTS
Regarding the distribution tests, results indicated that
most variables followed a normal distribution, except
for the “time taken” by Group A, which required non-
parametric testing. The results of the study are pre-
sented below, focusing on performance, acceptability,
and qualitative feedback.
5.1 Performance Results
A total of 51 issues were reported by participants,
of which 46 were considered valid and classified as
unique or duplicate. The analysis identified 43 dis-
tinct issues in the THS (Cubism), including 40 unique
and 3 duplicate issues.
Group A (UUXE-ToH v4). Participants identified
31 issues (26 unique, 5 duplicates). The most pro-
lific participant identified 7 issues, with an average of
approximately 4.4 issues per participant. This group
achieved 67.4% coverage of identifiable issues.
Group B (USE+SUS+UEQ). Participants identified
15 issues (14 unique, 1 duplicate). The most prolific
participant identified 3 issues, with an average of ap-
proximately 2.1 issues per participant. This group had
coverage of 34.8% of identifiable issues.
The distribution of issues by aspects revealed that
Group A outperformed Group B in identifying issues
ICEIS 2025 - 27th International Conference on Enterprise Information Systems
644

related to Effectiveness (5 vs. 1), Learnability (2 vs.
1), Controllability and Operability (10 vs. 6), Error
Prevention and Recovery (5 vs. 1), Trustworthiness (2
vs. 0), Beauty and Aesthetics (1 vs. 0), and Presence
(1 vs. 0). Both groups identified the same number of
issues related to Immersion (5 each), while Group B
outperformed Group A in Comfort (1 vs. 0).
Table 1: Issues by Aspect.
A B
Effectiveness 5 1
Efficiency
Comfort 1
Learnability 2 1
Memorability
Controllability and Operability 10 6
Error Prevention and Recovery 5 1
Immersion 5 5
Utility
Trustworthiness 2
Value
Beauty and Aesthetics
Interest
Absorption (Engagement, Flow)
Beauty and Aesthetics 1
Presence 1
Satisfaction
Pleasure and Fun
Emotions
Total 31 15
The performance of each participant is avail-
able online
3
, which includes the start and end times,
elapsed evaluation time (in minutes), the number of
unique, duplicate, and total issues identified, as well
as the respective coverage rate and efficiency index
(speed for detection of total issues, STI = TI/Time).
Statistical significance tests, including Student’s t-
test and the Mann-Whitney U test, revealed a statisti-
cally significant difference between Groups A and B
for both the total issues identified (TI) and the cov-
erage rate. All p-values were below 0.05, as shown
in Table 2, highlighting the superior performance of
Group A in these measures.
Table 2: p-Values of significance tests (A̸=B).
Test\Var TI Coverage Time STI
Student 0,014 0,014 0,434 0,219
Mann-Whitney 0,017 0,017 0,925 0,41
Regarding the evaluation time, in Group A, the
shortest completion time was 4 minutes by partici-
pant P6, who identified 3 total issues (TI). The longest
evaluation time was 38 minutes by participant P5,
who identified 7 TI. The average evaluation time in
Group A was 11 minutes. In Group B, the quickest
3
https://doi.org/10.6084/m9.figshare.28446566
inspection was completed in 3 minutes by participant
P8, who identified only 1 TI, while the longest eval-
uations were conducted by participants P11 and P12,
each taking 9 minutes and identifying 2 TI. The aver-
age evaluation time for Group B was 6 minutes.
The issue identification speed (STI) was 2.82 TI
per minute for Group A and 2.50 TI per minute for
Group B. Although Group A showed a slightly higher
STI, significance tests did not reveal a statistical dif-
ference between the groups for the variables Time and
STI. The null hypothesis could not be rejected for
these variables, as all p-values exceeded 0.05.
5.2 Acceptability Results
The Technology Acceptance Model (TAM) responses
were converted to a 1–7 scale, and medians were
calculated for each construct. While both groups
provided positive feedback on the evaluation meth-
ods, the results indicate that Group A, which
evaluated the UUXE-ToH v4 questionnaire, gener-
ally outperformed Group B, which used the com-
bined USE+SUS+UEQ approach, across all con-
structs: Perceived Utility (PU), Perceived Ease of Use
(PEOU), and Behavioral Intention (BI).
For PU, participants in Group A demonstrated
high scores overall, with most participants assign-
ing the maximum score of 7 across all items, lead-
ing to a median PU score of 7 for nearly all partic-
ipants. However, one participant in Group A rated
PU3 with a score of 4, introducing some variability
within the group. In contrast, Group B showed consis-
tently moderate to high scores for PU, with medians
ranging from 5 to 7 and no participant scoring below
5, suggesting that participants in Group B also found
the combined evaluation technology useful.
For PEOU, Group A maintained high median
scores between 6 and 7, reflecting strong perceptions
of ease of use, while Group B exhibited more vari-
ability, with PEOU medians ranging from 4 to 6.5 and
some individual scores dropping as low as 3. For BI,
Group A again showed higher medians, consistently
at 6 or above, indicating strong future intentions to use
the UUXE-ToH v4. In contrast, Group B had lower
medians, ranging from 3 to 6, suggesting weaker in-
tent to adopt the combined evaluation approach.
Overall, while Group A showed greater consis-
tency and stronger results in all constructs, the per-
formance of Group B suggests that the combined
USE+SUS+UEQ approach was also valued, particu-
larly for PU. These findings reinforce the robustness
of UUXE-ToH v4 while recognizing the strengths of
traditional instruments.
Statistical significance tests did not reveal differ-
Evaluating Performance and Acceptance of the UUXE-ToH Questionnaire for Touchable Holographic Solutions
645
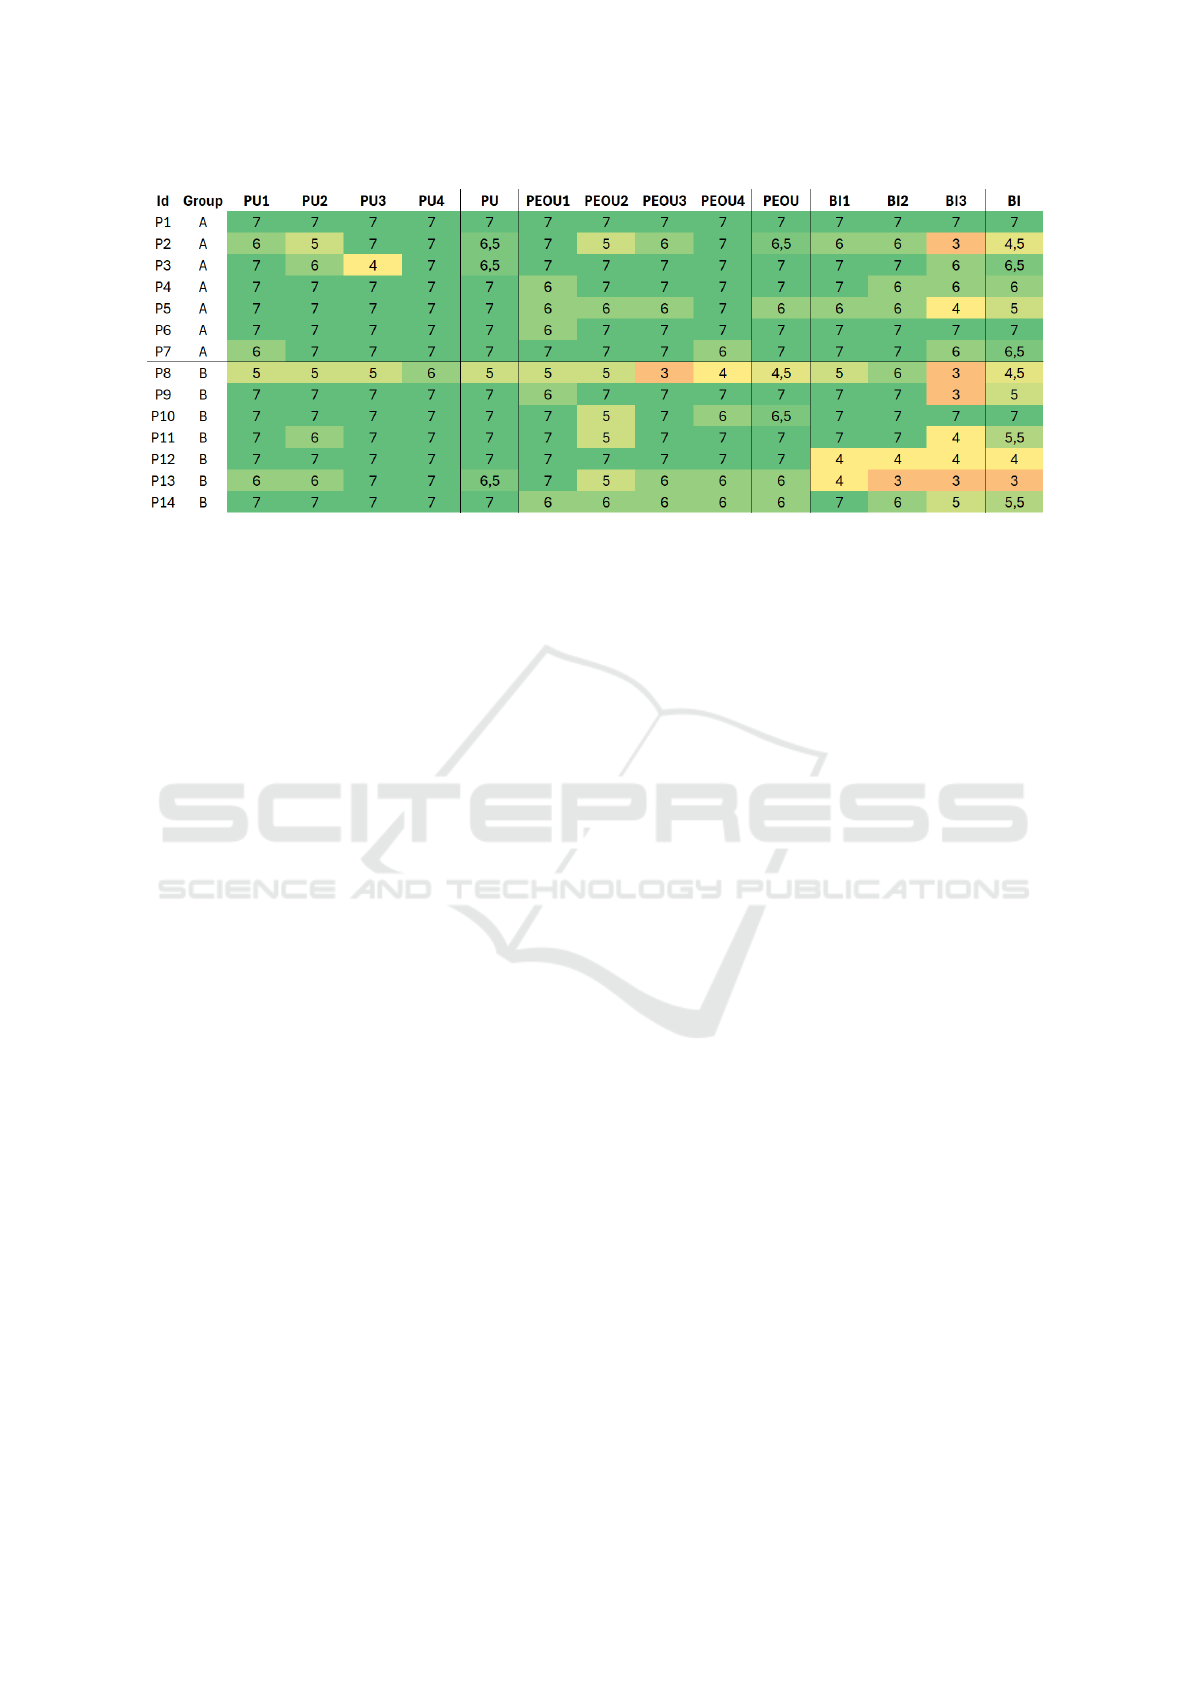
Figure 1: TAM results.
ences between the groups for PU or PEOU, except
for BI. Specifically, a directed Student’s t-test (A>B)
for the variables BI and BI3 resulted in p-values be-
low 0.05 (p-values: BI, 0.042, and BI3, 0.049), in-
dicating a tendency for Group A to achieve higher
scores than Group B for BI. However, this finding re-
quires further verification with a larger sample size.
For PEOU, a directed Mann-Whitney test (A>B) pro-
duced p-values close to, but not below, 0.05, suggest-
ing no statistically significant advantage for Group A
in this construct (p-values: PEOU1, 0.442; PEOU2,
0.053; PEOU3, 0.273; PEOU4, 0.056, and PEOU,
0.127). Overall, while Group A showed stronger per-
formance trends, the statistical results suggest that the
differences between the two groups are not definitive
across all constructs and highlight the need for further
studies to confirm these trends.
5.3 Qualitative Feedback
Open-ended responses from the TAM form provided
valuable insights into the study’s outcomes. Partici-
pants in Group A, who used the UUXE-ToH v4 ques-
tionnaire, highlighted its utility and clarity. For in-
stance, Participant P3 noted, “It is useful for evalu-
ating games from the user’s perspective.” Similarly,
Participant P7 commented, “The questionnaire helps
guide the evaluation process.” This feedback under-
scores UUXE-ToH v4’s ability to comprehensively
and effectively support usability and UX evaluations.
Regarding usability, Participant P7 remarked,
“The questionnaire is practical and straightforward,”
while also highlighting a challenge related to its ap-
plication as a basis for an inspection method. He
commented, “The difficulty lies in using it only af-
ter interacting with the app/solution,” referring to the
unique challenges of evaluating holographic solutions
through inspection methods. Unlike traditional sys-
tems such as mobile or desktop applications, where
evaluators can take notes in real time while interact-
ing with the system, holographic solutions often re-
quire the evaluator’s full attention during use, making
it difficult to document issues as they arise. This feed-
back reflects the practicality of the instrument but also
underscores the need for usability improvements that
better support evaluators in recording problems effec-
tively, either during or immediately after interaction
with holographic solutions.
On the topic of future usage, Participant P3 stated,
“I would use it to evaluate a game,” and Participant
P7 added, “I work with immersive applications, and
this questionnaire would be very useful.” These com-
ments highlight the perceived applicability and rele-
vance of UUXE-ToH v4 in professional contexts in-
volving usability and UX assessments.
However, participants also provided suggestions
for improvement. Participant P5 suggested, “Make
the question about productivity a bit more objective.”
Additionally, P5 and P7 raised concerns about recall-
ing interactions for reporting issues, with P7 noting,
“I consider it a challenge to remember the prior inter-
action to report the problems.” These insights point
to areas where the questionnaire could enhance its us-
ability and support for users.
Group B participants had mixed opinions on the
combined USE+SUS+UEQ approach. P9 acknowl-
edged its potential for valuable feedback, stating, “It
is possible to collect interesting feedback with it,”
while P13 described it as “efficient and user-friendly.”
Likewise, P14 emphasized its usefulness, noting, “It
helps guide the evaluation, assisting the evaluator in
remembering problems faced during use.”
However, the complexity of managing three sep-
arate tools led to some confusion. P14 observed,
“Some questions left me in doubt about how to re-
spond or their relevance in the given context.” This
ICEIS 2025 - 27th International Conference on Enterprise Information Systems
646

reflects the challenges of overlapping and potentially
redundant items across the three questionnaires.
Overall, these qualitative insights reveal the
strengths and limitations of both evaluation technolo-
gies. The combined USE+SUS+UEQ approach pro-
vides detailed feedback but poses challenges in us-
ability and contextual relevance.
6 DISCUSSION
The findings of this study provide valuable perspec-
tives into the performance and acceptability of the
UUXE-ToH v4 questionnaire compared to the com-
bined use of established instruments (USE, SUS, and
UEQ) for evaluating THS. These results are discussed
here in the context of the study’s objectives and their
broader implications for usability and UX evaluation
in AR/MR environments.
Group A, using UUXE-ToH v4, demonstrated sig-
nificantly better performance in identifying unique
and total issues compared to Group B, using
USE+SUS+UEQ. The higher coverage rate of 67.4%
for Group A versus 34.8% for Group B underscores
the comprehensiveness of UUXE-ToH v4. This tai-
lored questionnaire enabled participants to identify
critical issues across multiple constructs, such as Ef-
fectiveness, Learnability, Controllability and Oper-
ability, and Error Prevention and Recovery, where
Group B’s coverage was notably lower.
Both groups performed equally well in identify-
ing Immersion-related issues, indicating that this con-
struct is effectively addressed by both UUXE-ToH
and traditional instruments. However, Group A’s su-
perior performance in Presence and Trustworthiness
underscores the limitations of generalized tools in
capturing nuanced aspects specific to THS.
The TAM results indicate that Group A rated
UUXE-ToH v4 higher across constructs of Perceived
Utility (PU), Perceived Ease of Use (PEOU), and Be-
havioral Intention (BI). While PU and PEOU did not
exhibit statistically significant differences between
groups, Group A showed a clear trend of higher
scores, reflecting a more positive evaluation experi-
ence. The directed statistical tests revealed signifi-
cant differences for BI, indicating that participants in
Group A expressed a stronger intent to use UUXE-
ToH v4 in future evaluations.
Qualitative feedback supports these findings, with
participants highlighting the questionnaire’s clarity,
structure, and comprehensive coverage. However,
challenges were noted regarding its application for
inspection-based evaluations in holographic contexts,
where it is difficult to document issues during inter-
action. Suggestions for improvement included pro-
viding more illustrative examples and enhancing the
digital format of the questionnaire.
Group B’s experience with USE+SUS+UEQ re-
vealed some benefits, such as familiarity with the
tools and their ability to guide evaluators in remem-
bering encountered problems. However, the frag-
mented nature of the combined approach led to par-
ticipant fatigue, overlapping questions, and reduced
efficiency, as reflected in the lower coverage and be-
havioral intention scores.
These findings reinforce the need for evaluation
tools tailored to the unique characteristics of AR/MR
technologies. Constructs such as Presence, Absorp-
tion, and Immersion are central to touchable hologra-
phy and demand specialized evaluation instruments.
UUXE-ToH v4 effectively bridges this gap by inte-
grating usability and UX metrics into a single, user-
friendly tool. Its superior performance in identifying
critical issues and its higher acceptability among par-
ticipants underscore its potential as a benchmark for
evaluating emerging interactive technologies.
7 CONCLUSIONS
This study evaluated the performance and acceptance
of the UUXE-ToH v4 questionnaire compared to a
combination of established instruments (USE, SUS,
and UEQ) in assessing THS. The results demonstrate
that UUXE-ToH v4 is a robust and effective tool for
capturing usability and UX aspects specific to touch-
able holography. Participants using UUXE-ToH v4
identified a more significant number of issues, par-
ticularly in constructs like Effectiveness, Learnabil-
ity, and Presence, underscoring its comprehensive-
ness and relevance to AR/MR contexts.
The questionnaire’s intuitive design and ability to
integrate multiple usability and UX constructs into a
single instrument enhanced its acceptability among
participants. In contrast, the combined use of USE,
SUS, and UEQ presented challenges, including re-
dundancy and increased cognitive load, highlighting
the practical advantages of UUXE-ToH v4.
While the study provides strong evidence of
UUXE-ToH v4’s effectiveness, certain limitations
must be acknowledged. The small sample size and
focus on a single use case (Cubism) limit the gener-
alizability of the findings. Most participants were un-
dergraduates, though some had experience in research
groups or companies focused on usability and UX
evaluation. Additionally, the limited usage time and
the workshop-based inspection constrain its applica-
bility to real-world evaluations. Future studies should
Evaluating Performance and Acceptance of the UUXE-ToH Questionnaire for Touchable Holographic Solutions
647

expand the sample, involve more diverse participant
profiles, and include a broader range of AR/MR ap-
plications and devices.
Future initiatives for the UUXE-ToH question-
naire aim to expand its application and global reach.
Plans include promoting its use in conferences and
academic networks, developing an official website
with a user manual, application examples, and a dig-
ital tool for data collection and analysis. This tool
could automate reports, perform statistical calcula-
tions and integrate databases, improving versatility
with heuristic checklists and observational tools. In
addition, efforts will focus on translating the ques-
tionnaire into multiple languages and validating it
across cultures for semantic and construct equiva-
lence. Future studies may explore the integration of
UUXE-ToH with inspection methods such as heuris-
tic evaluations or cognitive walk-throughs and de-
velop shorter or modular versions for faster assess-
ments or resource-limited studies.
The UUXE-ToH v4 represents a significant ad-
vancement in usability and UX evaluation for THS.
By addressing the unique challenges of AR/MR en-
vironments, it provides a comprehensive and user-
friendly tool that supports the development of more
intuitive and engaging technologies. This study con-
tributes to the growing field of interactive technology
evaluation and offers a foundation for future research
in usability and UX assessment in emerging contexts.
ACKNOWLEDGEMENTS
We thank the funding and support of the Coordina-
tion for the Improvement of Higher Education Per-
sonnel (CAPES) — Program of Academic Excellence
(PROEX), FAPEMIG (APQ-00890-23) and CNPq
(306101/2021-1).
REFERENCES
Billinghurst, M., Clark, A., and Lee, G. (2015). A Sur-
vey of Augmented Reality. Foundations and Trends
in Human-Computer Interaction, 8(2-3):73–272.
Brooke, J. (1996). SUS: A ’Quick and Dirty’ Usability
Scale. In Usability Evaluation In Industry, pages 207–
212. CRC Press, London, 1st edition.
Campos, T., Castello, M., Damasceno, E., and Valentim, N.
(2025). An Updated Systematic Mapping Study on
Usability and User Experience Evaluation of Touch-
able Holographic Solutions. Journal on Interactive
Systems, 16(1):172–198.
Campos, T., Damasceno, E., and Valentim, N. (2024a). Us-
ability and User Experience Questionnaire Evaluation
and Evolution for Touchable Holography. In Proceed-
ings of the 26th International Conference on Enter-
prise Information Systems, pages 449–460, Angers,
France. SCITEPRESS - Science and Technology Pub-
lications.
Campos, T., Delabrida, S., and Valentim, N. (2024b).
Avaliac¸
˜
ao da Usabilidade e da Experi
ˆ
encia do Usu
´
ario
em Realidade Aumentada e Virtual. In Simp
´
osio
Brasileiro de Fatores Humanos em Sistemas Com-
putacionais (IHC), pages 7–8. SBC.
Campos, T. P. d., Damasceno, E. F., and Valentim, N. M. C.
(2023). Usability and User Experience Evaluation of
Touchable Holographic solutions: A Systematic Map-
ping Study. In IHC ’23: Proceedings of the 22st
Brazilian Symposium on Human Factors in Comput-
ing Systems, IHC ’23, pages 1–13, Maceio, Brazil.
ACM.
Gao, M., Kortum, P., and Oswald, F. (2018). Psychome-
tric Evaluation of the USE (Usefulness, Satisfaction,
and Ease of use) Questionnaire for Reliability and Va-
lidity. Proceedings of the Human Factors and Er-
gonomics Society Annual Meeting, 62(1):1414–1418.
Kervegant, C., Raymond, F., Graeff, D., and Castet, J.
(2017). Touch hologram in mid-air. In ACM SIG-
GRAPH 2017 Emerging Technologies, SIGGRAPH
’17, pages 1–2, New York, NY, USA. Association for
Computing Machinery.
Laugwitz, B., Held, T., and Schrepp, M. (2008). Construc-
tion and Evaluation of a User Experience Question-
naire. In Holzinger, A., editor, HCI and Usability for
Education and Work, Lecture Notes in Computer Sci-
ence, pages 63–76, Graz, Austria. Springer.
Lewis, J. R. and Sauro, J. (2009). The Factor Structure of
the System Usability Scale. In Kurosu, M., editor,
Human Centered Design, pages 94–103, Berlin, Hei-
delberg. Springer.
Lewis, J. R. and Sauro, J. (2017). Revisiting the Factor
Structure of the System Usability Scale - JUX. JUX -
The Journal of User Experience, 12(4):183–192.
Prado De Campos, T., Damasceno, E. F., and Valentim, N.
M. C. (2024). Evaluating Usability and UX in Touch-
able Holographic Solutions: A Validation Study of the
UUXE-ToH Questionnaire. International Journal of
Human–Computer Interaction, pages 1–21.
Slater, M., Usoh, M., and Steed, A. (1994). Depth of Pres-
ence in Virtual Environments. Presence: Teleopera-
tors and Virtual Environments, 3(2):130–144.
Usoh, M., Catena, E., Arman, S., and Slater, M. (2000).
Using Presence Questionnaires in Reality. Presence:
Teleoperators and Virtual Environments, 9(5):497–
503.
Venkatesh, V. and Bala, H. (2008). Technology Acceptance
Model 3 and a Research Agenda on Interventions. De-
cision Sciences, 39(2):273–315.
ICEIS 2025 - 27th International Conference on Enterprise Information Systems
648
