
Hybrid Root Cause Analysis for Partially Observable Microservices
Based on Architecture Profiling
Isidora Erakovic and Claus Pahl
Free University of Bozen-Bolzano, 39100 Bolzano, Italy
fi
Keywords:
Microservices, Container, Root Cause Analysis, Anomaly Detection, Architecture Mining.
Abstract:
Managing and diagnosing faults in microservices architectures is a challenge. Solutions such as anomaly de-
tection and root cause analysis (RCA) can help, as anomalies often indicate underlying problems that can lead
to system failures. This investigation provides an integrated solution that extracts microservice architecture
knowledge, detects anomalies, and identifies their root causes. Our approach combines the use of latency
thresholds with other techniques to learn the normal behavior of the system and detect deviations that point to
faults. Once deviations are identified, a hybrid RCA method is applied that integrates empirical data analysis
with an understanding of the system’s architecture to accurately trace the root causes of these anomalies. The
solution was validated using trace log data from an Internet Service Provider’s (ISP) microservices system.
1 INTRODUCTION
Microservices allow large applications to be split into
smaller, independent services that are easier to man-
age and scale. However, the increased number of ser-
vices and their interdependencies can lead to signif-
icant challenges in system monitoring and anomaly
detection (Landim, 2023; Li et al., 2021). Identify-
ing and remediating anomalies in such a decentral-
ized system can be time-consuming. An effective root
cause analysis (RCA) is crucial for ensuring the relia-
bility and performance of microservices (Ikram et al.,
2022), but the current state-of-the-art lacks a deeper
interpretation of RCA results within the architectural
properties of the target system.
We analyzed trace log data in order to understand
how the microservices interacted and to identify the
roles of key components in the system. Our task was
to find out how these microservices worked together,
including their functions and how errors could propa-
gate through the system. Identifying whether compo-
nents shared similar roles or supported different parts
of the system was critical to understand the architec-
ture and dynamics of the system. Our goal was to cre-
ate a proof-of-concept RCA framework that combines
different approaches, including architecture mining,
anomaly detection, and rule-based analysis. We as-
sume here that only partial information about the
health of the system is available, e.g., where resource
information on CPU, network and storage might not
be visible as in some cloud environments.
Our goal was to answer the following question:
How can an effective rule system for root cause
analysis be defined based on latency information in
trace logs? As an answer, we developed a hybrid
RCA framework that integrates architecture mining,
anomaly detection and rule-based analysis. The work
included a set of rules for the RCA that covers a
range of CPU, network and storage-related anoma-
lies. These rules were designed to systematically
identify and diagnose problems within the microser-
vices. This rule-based analysis was important to de-
termine the root causes of the errors. The rule system
identifies affected components and analyzes latency
patterns. By tracing the spread of anomalies across
components and examining the specific latency spikes
associated with these faults, we were able to pinpoint
the root causes. This approach allowed us to corre-
late anomalies with components, making it possible
to systematically diagnose issues within the microser-
vices environment using trace logs.
We conducted several experiments. We compared
the call trees with the source-destination paths found
in the CSV files, which helped us confirm the accu-
racy of our architecture mining. For anomaly detec-
tion, we compared the anomalies detected with the
fault injection patterns observed. We also checked
how the system behaved in normal cases and during
fault injections to ensure that our thresholds and rules
correctly identified the issues.
Erakovic, I. and Pahl, C.
Hybrid Root Cause Analysis for Partially Observable Microservices Based on Architecture Profiling.
DOI: 10.5220/0013453600003950
In Proceedings of the 15th International Conference on Cloud Computing and Services Science (CLOSER 2025), pages 255-263
ISBN: 978-989-758-747-4; ISSN: 2184-5042
Copyright © 2025 by Paper published under CC license (CC BY-NC-ND 4.0)
255

2 BACKGROUND
Microservices architecture allows an application to
be divided into independent and small services. We
worked with microservices deployed using container-
ization, specifically Docker (Merkel, 2014; Scolati
et al., 2020; von Leon et al., ).
Tracing is a technique we used to monitor how re-
quests move through different services in a microser-
vices system. Each trace logs the request’s path, cap-
turing the services involved and durations of steps
(Sigelman et al., 2010). This detailed logging is cru-
cial for understanding the interdependencies between
services. (Dragoni et al., 2017) emphasize that ef-
fective tracing can significantly enhance the ability
to pinpoint performance bottlenecks and diagnose the
root causes of issues.
RCA is essential for microservices due to the
complexity and interdependence of services, where
an issue can propagate and cause widespread disrup-
tion. By systematically tracing and identifying the
root causes, RCA helps in minimizing downtime and
improving the reliability of the system (Samir and
Pahl, 2021). Recent studies have explored the appli-
cation of causal discovery techniques in RCA, empha-
sizing the importance of accurately identifying causal
relationships between different system components to
effectively isolate and address the root causes of fail-
ures (Ikram et al., 2022). RCA in microservices often
involves analyzing multiple metrics such as CPU and
memory usage across different containers.
3 RELATED WORK
Various studies have focused on tracing and log-
ging methods to understand system behavior, espe-
cially during failures (Fonseca et al., 2007; Samir and
Pahl, 2020). For instance, X-Trace tracks the path
of requests through a system, crucial for pinpointing
where problems start and how they spread. Other
tools, like Dapper (Sigelman et al., 2010), automate
tracing to manage the complexity of microservices
without extensive manual effort. (Ahmed et al., 2016)
explore RCA in microservices, focusing on anomaly
detection and localization using detailed performance
metrics and Markov models. This research demon-
strates that RCA techniques can still be effective with
limited or incomplete data, particularly when focus-
ing on specific performance metrics. (Forsberg, 2019)
introduces a method for anomaly detection and root
cause analysis in microservice environments by learn-
ing normal behavior patterns and identifying devi-
ations. Similarly, (Mohamed and El-Gayar, 2021)
studied the impact of CPU and network utilization
on latency in microservices, highlighting that net-
work utilization is a significant contributor to latency
spikes, showing that high CPU utilization often leads
to consistent performance degradation, while network
congestion tends to cause abrupt and unpredictable
latency spikes. To understand latency distribution,
(Sundberg S. and S., 2024) shows for ISPs that many
subnets had latencies above 50 ms, but only a few ex-
ceeded 100 ms. (Yu et al., 2024) have shown how a
latency of 100 ms can mimic a network disruption that
only affects directly connected services, highlighting
the importance of the network topology when ana-
lyzing latency spikes. To address CPU and memory
faults, (Samir and Pahl, 2020) discuss the use of Hid-
den Markov Models (HMMs) to detect problems such
as CPU hogs and memory leaks.
A graph-based RCA method proposed by (Bran-
dona et al., 2023) focuses on using graph represen-
tations to identify root causes through comparison of
anomalous graphs with a knowledge base of known
anomalies. This approach emphasises the relation-
ships between elements in the architecture. (Wang
et al., 2023) show how increased message rates can
lead to spikes in CPU and memory usage, which in
turn can lead to latency variations. Anomaly detec-
tion in complex systems was also addressed by (Li
et al., 2024), who discussed the integration of differ-
ent data sources for better detection. In (Wang et al.,
2024), MRCA is introduced as multi-modal RCA ap-
proach. There the focus is on integrating different
sources such as logs and directly monitored metrics
to automate RCA. We go beyond their method of cor-
relating logs with architectural components by using
different architectural knowledge types as a novel ap-
proach to fault classification and root cause analysis.
We introduce a novel hybrid RCA approach that
integrates architecture mapping with anomaly detec-
tion in a rule-based RCA approach. Unlike previ-
ous research, which primarily focuses on using de-
tailed performance metrics and Markov models, our
method provides a more comprehensive solution, es-
pecially in environments with sparse or incomplete
data. By considering both the structural and inter-
action aspects of the microservices architecture, this
method addresses the limitations of traditional RCA.
4 ROOT CAUSE ANALYSIS
We draw on several sources to define our RCA rules
system. (Forsberg, 2019) differentiates between net-
work faults, CPU issues, and memory anomalies,
which we considered for our RCA approach. (Yu
CLOSER 2025 - 15th International Conference on Cloud Computing and Services Science
256

et al., 2024) focus on network-related RCA, demon-
strating how latency injections simulate network con-
gestion and affect directly connected services. (Samir
and Pahl, 2020) explored the detection of CPU and
memory faults through latency spikes and perfor-
mance degradation patterns.
We introduce the trace log analysis using anomaly
detection and architecture mining, before presenting
the RCA rule definition. The section concludes with
a case study from the ISP domain for illustration.
4.1 Trace Log-Based Analysis
Our goal was to develop an effective rule system for
root cause analysis in a microservices environment by
utilizing trace logs and key indicators such as com-
ponent interactions and latency patterns. Drawing on
(Ahmed et al., 2016), who emphasized the importance
of correlating various data streams for accurate RCA,
we integrated multiple metrics—such as latency, error
rates, and interaction patterns—to diagnose the root
causes of anomalies.
We used a trace data set for an ISP that covered
microservices interactions over a number of days,
where several faults on resources (CPU, network,
database) were injected
1
. The logs show the inter-
actions between components with the latencies and
possible failures. We built this system by analyz-
ing one of the dataset days (rca 2020 04 22.csv) and
the fault injection (ret info.csv) datasets, monitoring
system behavior before, during, and after fault injec-
tions
2
. Key metrics were examined within the context
of the system’s architecture to accurately trace and
identify the root causes of anomalies.
This RCA technique combines two dimensions
where respective core information is incorporated in
the trace logs and can be extracted:
• temporal: change patterns of anomalies over time
• spatial: location and dependencies of containers
The combination allows to determine accurately the
fault location and the fault reason.
We used BIRCH clustering (balanced iterative re-
ducing and clustering using hierarchies) as part of our
hybrid method to validate our results.
4.2 RCA Rule System
We develop an RCA rule system for trace logs to iden-
tify and categorize anomalies by analyzing latency
and interaction patterns across the system. We define
1
https://github.com/NetManAIOps/TraceRCA
2
Different datasets were used to evaluate the solution.
the key metrics that were instrumental in our RCA ap-
proach, including latency, error rates, and interaction
patterns. These metrics formed the basis of our rule
system and were crucial in tracing the root causes of
anomalies. We define rules for identifying different
fault types, such as CPU exhaustion, memory exhaus-
tion, and network errors. These rules were derived
from the literature and our analysis, providing a struc-
tured approach to fault identification.
We use latency-based pattern trace analysis, us-
ing specific latency patterns to confirm the types of
faults and their impact on the system. We also look at
anti-pattern trace analysis, examining traces that did
not exhibit the expected anomalies in order to vali-
date our findings and ensured that detected anomalies
are accurately linked to root causes.
We utilize knowledge about the system architec-
ture and investigated key metrics such as latency, error
rates, and interaction patterns. Important is the detec-
tion of latency patterns per component over time. This
allowed us to observe which components showed si-
multaneous changes in latency patterns and how these
changes occurred. By analyzing the spread of latency
across components, we were able to identify which
parts of the system were affected and to understand
the nature of the latency distribution.
4.2.1 Anomaly Metrics and Anomaly Patterns
To investigate anomalies in the system traces, we fo-
cused on several key statistical indicators, including
mean, median, minimum, and maximum latency val-
ues for each component. We tracked interactions and
unique trace IDs exhibiting high-latency values and
identified the most affected components during fault
injection. We also analyzed component latency over
time to trace fault propagation through the system,
identifying trends that pointed to the root cause. Fi-
nally, we assessed success and failure rates for each
component, focusing on significant deviations to de-
termine where and how anomalies were introduced.
Overall, we distinguish a number of anomaly pat-
terns as indicators for identifying root causes (Er-
akovic and Pahl, 2025):
• Gradual latency increase – defined through a low
gradient of the latency-over-time function (Fig. 2,
middle). Components that show this behaviour
are generally closer to the directly affected ones.
• Rapid latency increase – defined through a high
gradient of the latency-over-time function (Fig. 2,
left). Components with these rapid increases are
often a bit further away and have a lower base la-
tency initially making spikes more pronounced.
Hybrid Root Cause Analysis for Partially Observable Microservices Based on Architecture Profiling
257

• Widespread latency spikes – defined through ir-
regular spikes in the latency-over-time function
(Fig. 2, right). These tend to be less directly con-
nected to problematic behaviour and the spikes re-
flects various different incidents.
Anomaly anti-patterns reflect situations in which the
latency values do not vary in a significant way from
their normal behaviour.
4.2.2 Architecture Knowledge Mining
In addition to anomaly patterns, we use architectural
knowledge to understanding the semantics of the ar-
chitecture and to further narrow down possible fault
root causes (Fang et al., 2016). We list the technique
we employed with the respective options, e.g., pattern
mining as the technique and shared resources as an
option/outcome:
• Architectural pattern mining: shared resources
(CPU, network, storage), shared host. For this
an architectural pattern analysis was conducted.
For instance, a load balancing solution can be de-
tected, indicating two or more different hosts for
the containers that themselves share resources.
• Call dependency analysis: affected component,
all components connected to the database, af-
fected container plus connected containers. For
this a call graph was constructed that determines
invocation-based call dependencies.
This information can be mined directly from the trace
logs. It would reflect that containers that shared the
same host or resource experience an immediate effect
of faults. Containers connected via call dependencies
see a gradual effect over time. Thus, the anomaly pat-
tern analysis distinguishes these forms and allows the
RCA to link these to architectural settings.
Further details about the combination of architec-
ture mining and anomaly detection can be found in
(Erakovic and Pahl, 2025).
4.2.3 RCA Rules for Fault Type Identification
The rules are defined based on a common format
that links detected anomaly patterns with architectural
knowledge to determine the root cause of a fault:
• condition: anomaly = ’anomaly pattern’ ∧ archi-
tecture = ’architectural configuration’
• root cause: detected fault root cause type
The fault root causes are categorised below. The three
anomaly patterns used here are defined above. The
architectural configuration is also described in terms
of the two aspects outlined above.
We cover here error types that were injected into
the system under test and were reflected in the logs.
1. CPU Exhaustion: Based on (Samir and Pahl,
2020), we can expect rapid latency increases
across all components sharing the same CPU.
• condition: anomaly = rapid latency increase ∧
architecture = shared CPU
• root cause: CPU exhaustion
2. Memory Exhaustion: As noted by (Forsberg,
2019) and (Samir and Pahl, 2020), memory ex-
haustion typically results in a gradual increase in
latency within the affected component.
• condition: anomaly = gradual latency increase
∧ architecture = affected component
• root cause: Memory exhaustion
3. Host Network Error: Following (Yu et al., 2024),
host network errors cause widespread latency
spikes across all components on the same host.
• condition: anomaly = widespread latency
spikes ∧ architecture = all components on the
same host
• root cause: Host network error
4. Container Network Error: Latency spikes local-
ized to a specific container and its connected com-
ponents indicate a container network error such as
buffering or connectivity issues.
• condition: anomaly = rapid latency increase
∧ architecture = affected container plus con-
nected containers
• root cause: Container network error
5. Database Failures: According to (Hadi and Gir-
sang, 2023), database failures result in rapidly in-
creased latency across all components interacting
with the database.
• condition: anomaly = rapid latency increase ∧
architecture = all components interacting with
database
• root cause: Database failure
4.3 RCA Analysis Illustration
We discuss the RCA technique using the ISP trace log
dataset to illustrate function and utility.
4.3.1 Sample Root Cause Analysis
Change patterns of latencies over time are important
to determine the cause of faults. Sharp increases indi-
cate different situations than gradual increases. We
can apply the RCA rule ’Container network error’,
which provides the following concrete indications:
CLOSER 2025 - 15th International Conference on Cloud Computing and Services Science
258
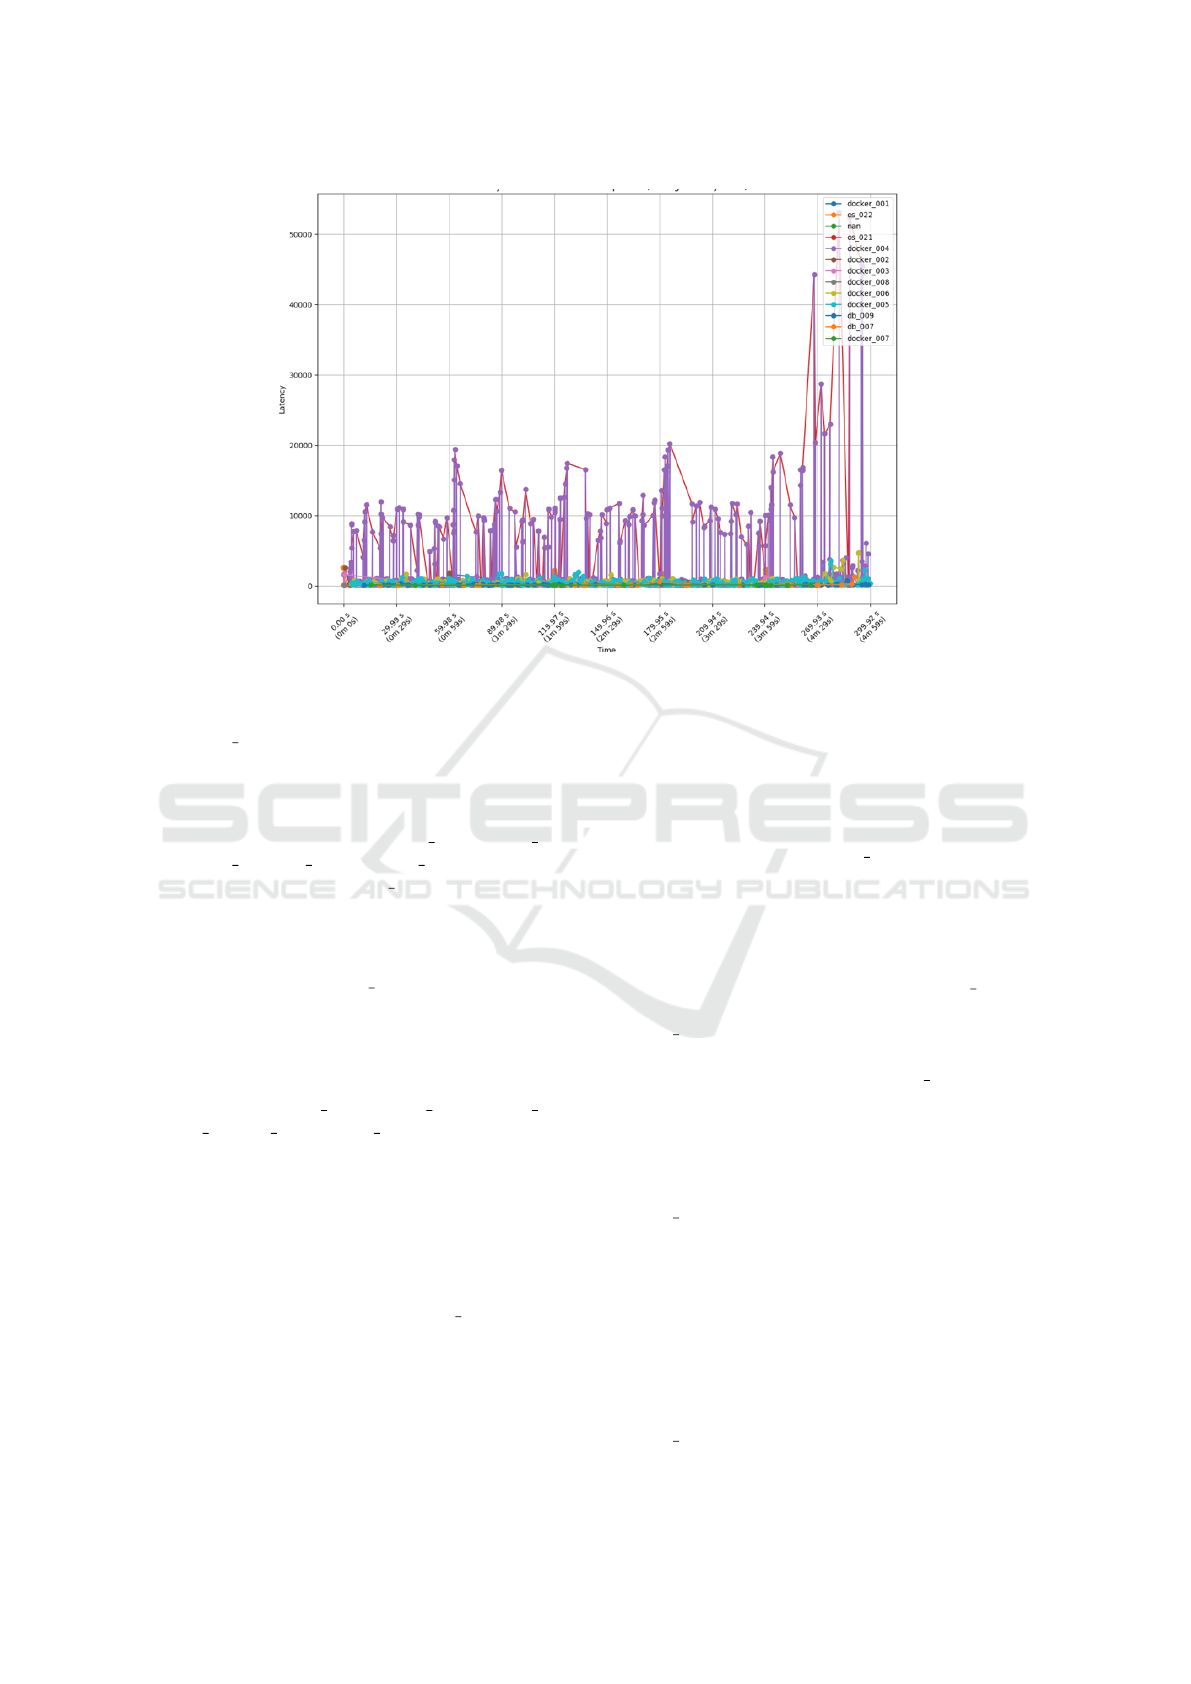
Figure 1: Latency Over Time for Each Component during Anomaly Detection.
• Anomaly pattern: As shown in Figure 1,
docker 004 exhibited the most pronounced ran-
dom increases in latency, i.e., making a network-
related anomaly a candidate cause option.
• Architecture: The latency spikes were also evi-
dent in components such as os 021, docker 005,
docker 006, db 007, and db 009, which inter-
acted directly with docker 004, making the latter
a candidate cause component.
• Root cause: This pattern suggests that the fault
was indeed localized within the container network
associated with docker 004, impacting its con-
nected components more severely.
We analyzed the latency trends over a 40-minute
period for all components (see Fig. 2 for selected
examples. Significant latency spikes were identified
for the containers os 021, docker 004, docker 005,
docker 006, db 007, and db 009, consistent with the
earlier detection of a network-related fault. Unlike the
focused previous analysis, which concentrated on the
immediate period surrounding the detected anomaly,
this analysis provides a comprehensive overview,
showing how the fault affected various components
for the entire observed period. The patterns of latency
spikes reaffirmed our conclusion that the network er-
ror was localized at container docker 004, but with
broader implications across the system.
We did consider CPU exhaustion, memory or
database anomalies as alternative causes. CPU ex-
haustion would have resulted in rapid latency spikes
across all components sharing the same CPU, which
we did not observe. Memory issues typically cause
gradual performance degradation rather than a sharp,
localized spike. Database anomalies would have pro-
duced more rapid latency increases across all compo-
nents interacting with the database, which was also
not the case. Therefore, the evidence points to a con-
tainer network error in docker 004 as the root cause
component of the observed anomaly.
4.3.2 Pattern Trace Analysis
We observed that when focusing on a single Trace
ID (04c3017183be087a5958) where docker 004 was
involved, the components directly interacting with
docker 004 were significantly impacted. Fig. 3 shows
that latency spikes were predominantly associated
with components connected to docker 004. Fig. 4 il-
lustrates how latency changed over time for this trace,
showing increased latency during the 5-10 minute
period, which corresponded to the time when the
fault was injected. This pattern further confirmed
the earlier findings that the anomaly was linked to
docker 004 and its associated network interactions.
The data in the figures allows a spatial analysis to
determine how the effect of a fault cause is spreading
between related containers using the architecture call
graph to validate dependencies.
4.3.3 Anti-Pattern Trace Analysis
Latency values were much lower in some traces (Figs.
5 and 6), which did not involve direct interaction with
docker 004. The stable and consistent latency values
Hybrid Root Cause Analysis for Partially Observable Microservices Based on Architecture Profiling
259
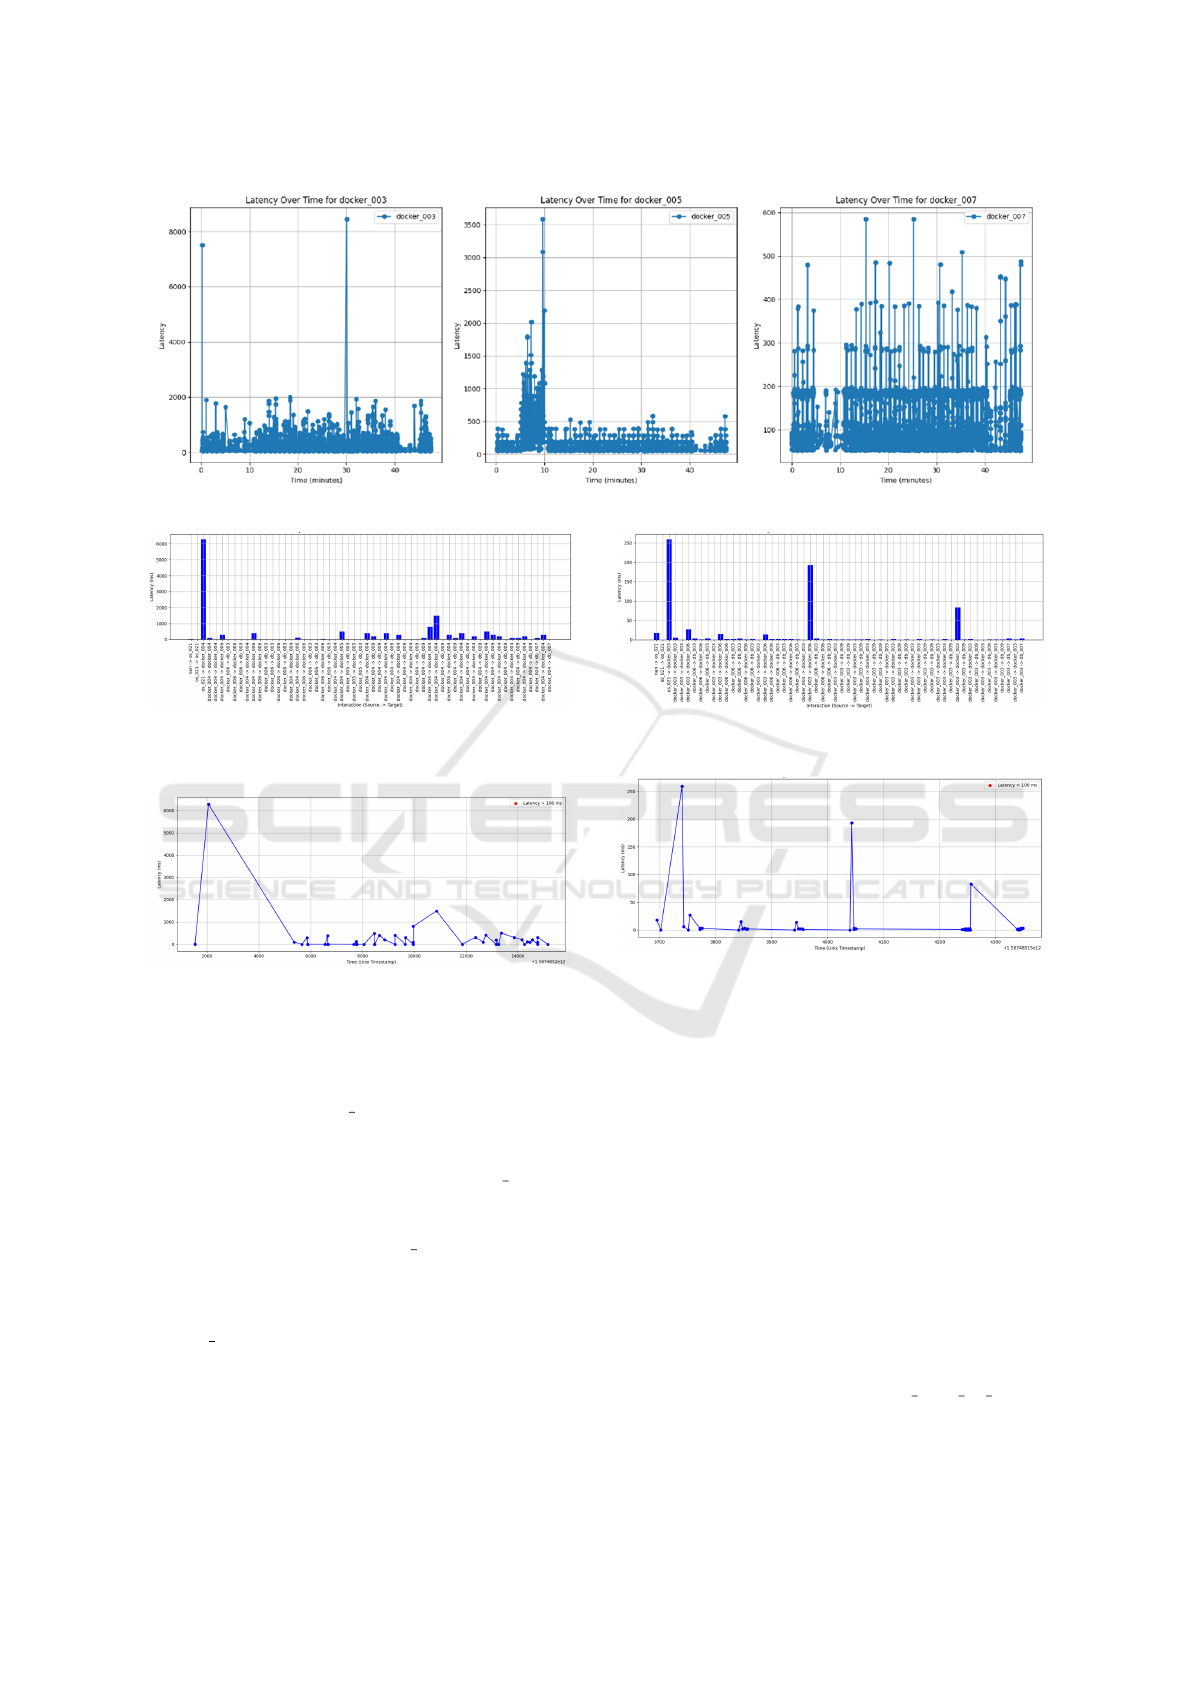
Figure 2: Latency Over Time for Each Component for Pattern Identification (Detailed View).
Figure 3: Visual representation of the Latency per Compo-
nent in Trace ID: 04e3017183be087a5958 – showing Inter-
actions between Components (along the Call Graph).
Figure 4: Visual representation of the Latency over Time
Trace ID: 04e3017183be087a5958 – showing Changes of
Latency over Time.
served as an anti-pattern, where the expected anoma-
lies due to network congestion were absent. Thus, the
issues observed in docker 004 were localized and spe-
cific to network interactions. By comparing these pat-
terns and anti-patterns, we observed a clear difference
in behavior between traces involving docker 004 and
those that did not, highlighting the network-related
nature of the fault. The lack of similar issues in com-
ponents not connected to docker 004 ruled out other
explanations like CPU exhaustion or memory leaks.
Our analysis of latency spikes and occurrence counts
led us to conclude the location of the fault component
(docker 004) and that the fault reason was container
network-related.
Figure 5: Visual representation of the Latency per Compo-
nent in Trace ID: 052d117183bd4d9f5704.
Figure 6: Visual representation of the Latency over Time
Trace ID: 052d117183bd4d9f5704.
5 VALIDATION AND ANALYSIS
We will now present experiments to evaluate the ef-
fectiveness of different RCA approaches. The experi-
ments include the application of a fixed threshold def-
inition for analyzing latency data, as well as the evalu-
ation of a threshold-based method within the ISP sys-
tem for a specific date range. Note that we used trace
sets different from the one used for the construction
of the RCA technique.
5.1 Experiment - Threshold Definition
We simulated a scenario using our solution to analyze
latency data collected from the rca 2020 04 22.csv
file containing interactions between system com-
ponents. The experiment was conducted follow-
CLOSER 2025 - 15th International Conference on Cloud Computing and Services Science
260
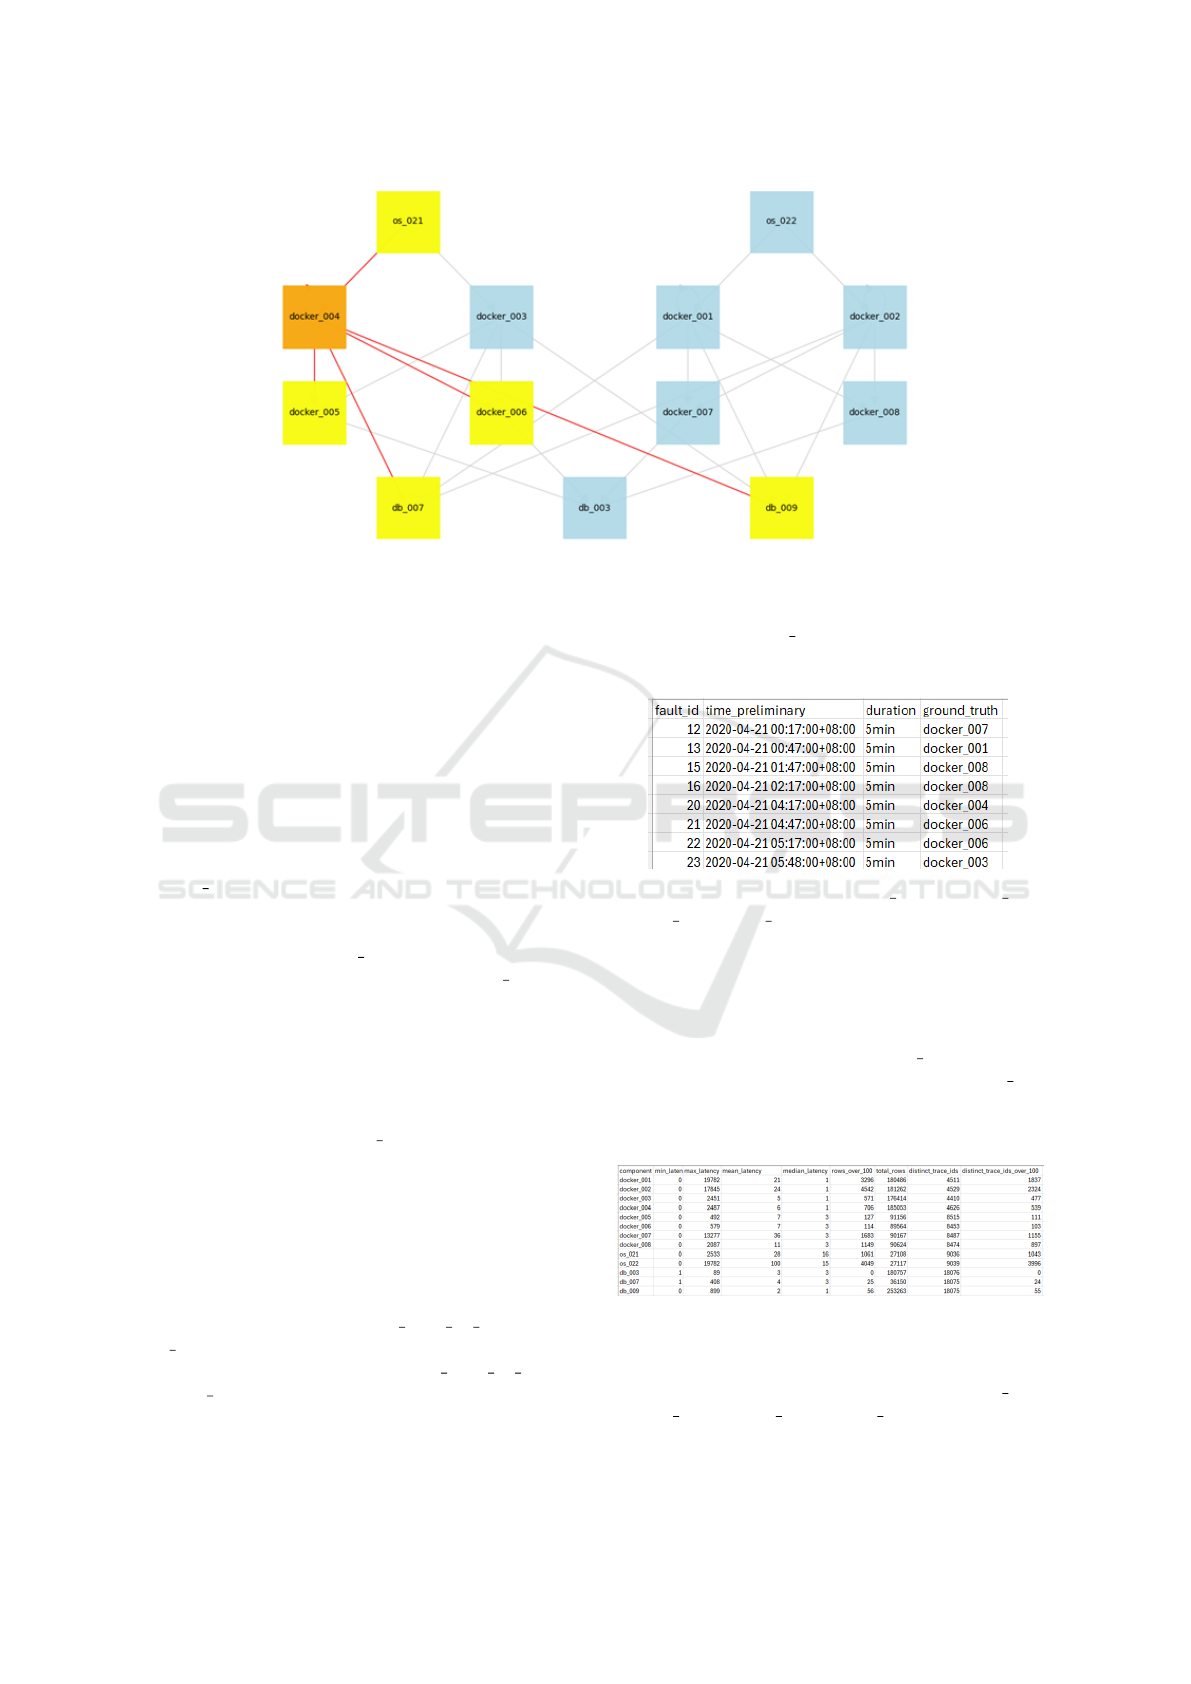
Figure 7: Highlighted High-Latency Paths in Component Interactions.
ing the (Forsberg, 2019) methodology. The idea
is to examine latency values for each component,
record their maximum values during normal opera-
tion (the ”normal behavior”), and then compare these
recorded maximums with the values observed dur-
ing the anomaly period. We used Python and the
NetworkX library to visualize the relationships be-
tween components and to highlight interactions where
anomalies were observed. Specifically, interactions
where latency values exceeded the pre-fault maxi-
mums were identified and highlighted as anomalies.
Fig. 7 shows that the interactions involving
docker 004 were highlighted, indicating that this
component experienced significant latency issues.
This observation suggests that the fault was most
likely injected into docker 004. Also, since the high-
lighted paths were primarily between docker 004 and
directly connected components, it points to a con-
tainer network fault as the probable cause.
The latency distribution over time for the compo-
nents with highlighted interactions is shown in Fig.
8. The anomaly, detected approximately five min-
utes into the observed period, manifested as random
high latency spikes in docker 004 and its directly con-
nected components. This pattern is consistent with a
container network fault.
5.2 Experiment - Predefined Thresholds
Using the approach applied to the faults injected
on 22-04-2020, which was the basis for our anal-
ysis where we analyzed rca 2020 04 22.csv and
ret info.csv, we employed the same method on a dif-
ferent dataset from the ISP case (rca 2020 04 21.csv
and ret info.csv) in this experiment. Through this
analysis, we determined that the dataset includes
trace ID data only for the first 40 minutes on 21-04-
2020, during which only one fault injection occurred,
specifically in docker 007 at 00:17.
Table 1: Fault Injection Details for the 21-04-2020 Dataset.
Table 2 shows that docker 001, docker 002,
docker 007 and os 022 had more interactions exceed-
ing the defined latency threshold and higher mean
and maximum latencies compared to other compo-
nents. These components were more affected during
the fault period, leading us to focus on them during
both anomaly detection and root cause analysis. The
absence of a significant impact on db 003 is a conse-
quence of low number of interactions between db 003
and other components that prevented an impact.
Table 2: Latency Statistics for the 21-04-2020 Dataset.
In Fig. 9, which displays latency over time for
each component after the fault injection, we can
observe significant latency spikes in docker 002,
docker 001, docker 007, and os 022. These compo-
nents exhibited elevated latency shortly after fault in-
Hybrid Root Cause Analysis for Partially Observable Microservices Based on Architecture Profiling
261
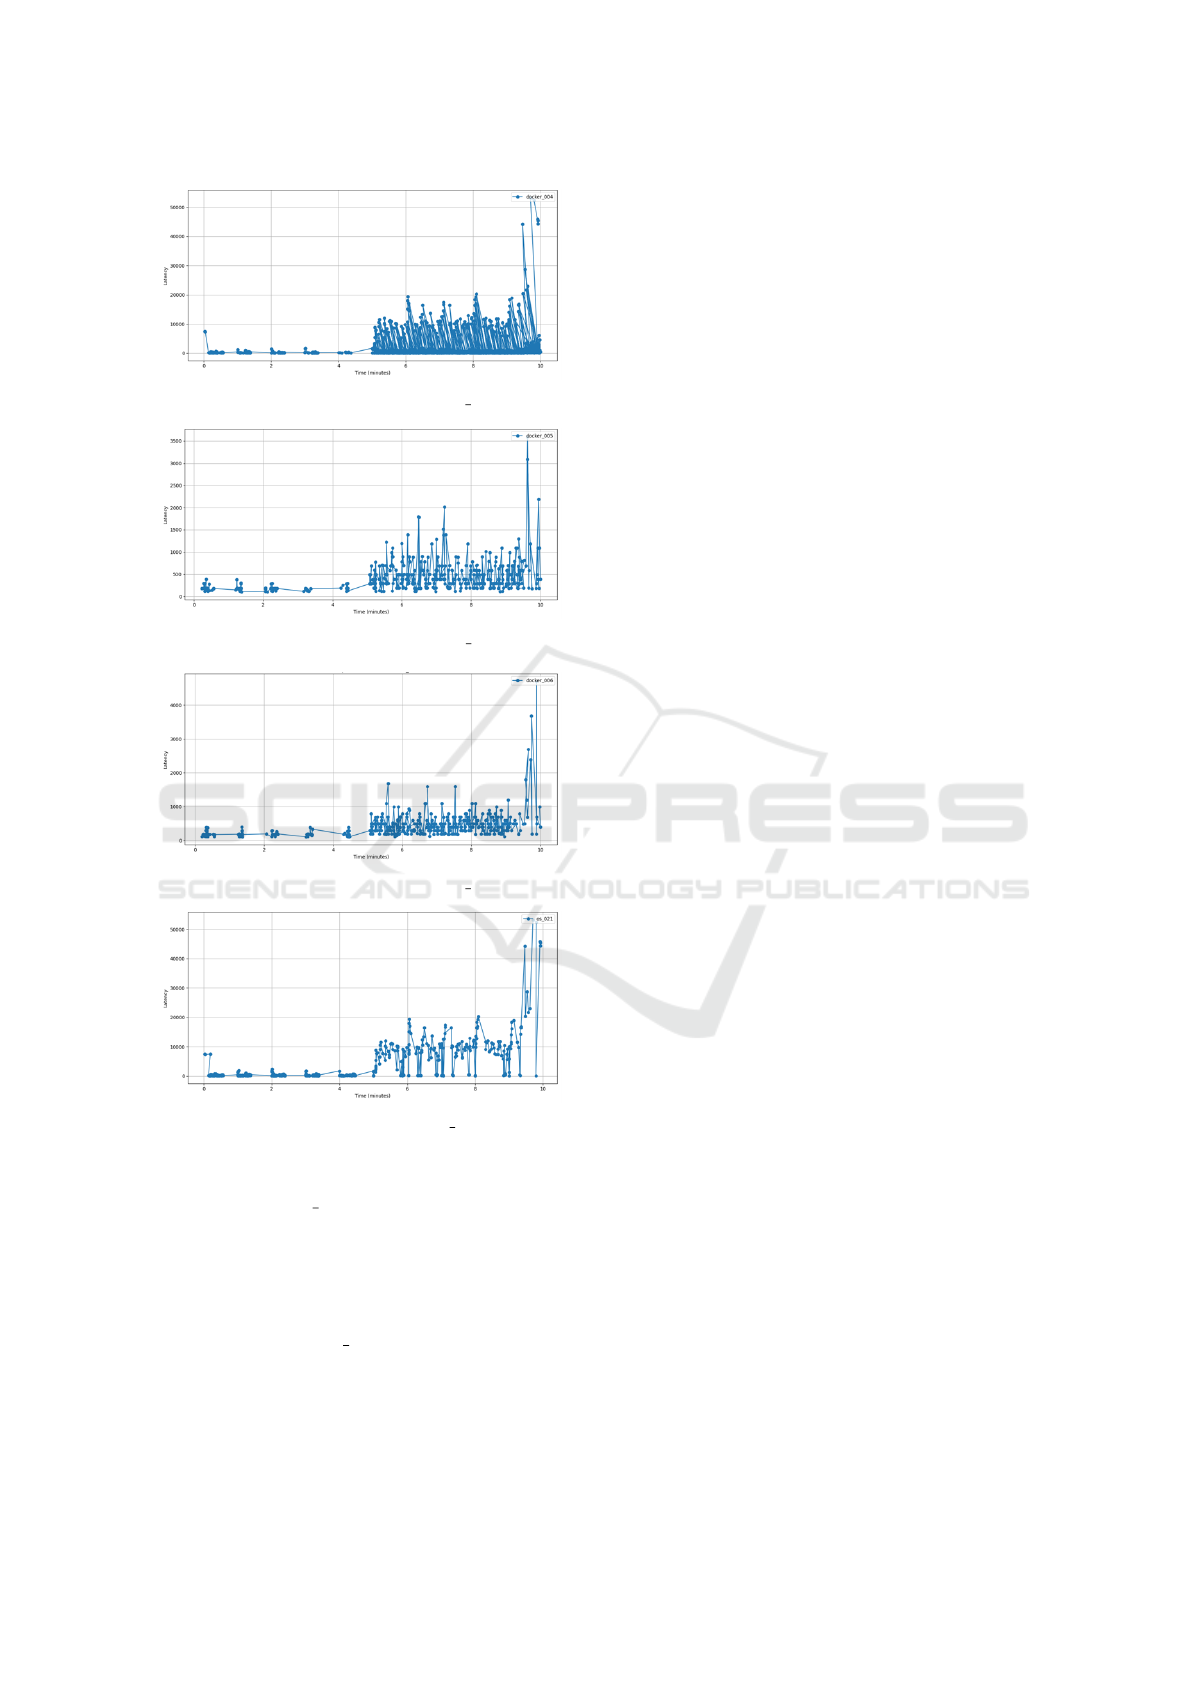
(a) Latency Over Time for docker 004
(b) Latency Over Time for docker 005
(c) Latency Over Time for docker 006
(d) Latency Over Time for os 021
Figure 8: Latency Patterns Over Time for Components with
Highlighted Interactions.
jection, with docker 007 experiencing the most fre-
quent spikes. The timing and concentration of these
spikes indicated that the fault had a substantial im-
pact on the network interactions involving these com-
ponents. This pattern of latency, further supported the
conclusion that the anomaly was related to a container
network issue in docker 007, similar to our findings
from the analysis of the 22-04-2020 fault injection.
6 CONCLUSIONS
We developed an integrated approach for analyzing
faults in a microservices architecture.Based on la-
tency anomaly thresholds, we mapped the system
architecture, detected anomalies, and identified root
causes of faults. By developing a hybrid approach
to root cause analysis in a microservices environment
based on architecture mining and anomaly detection,
we addressed some key challenges in managing mi-
croservice system faults, in particular where not all
platform resource details are available.
We evaluated the RCA by applying predefined
rules for each fault type to identify specific anoma-
lies and their locations within the system. The re-
sults showed that the RCA approach was successful in
identifying the origins of the anomalies and provided
reliable insights into the fault types, demonstrating
the effectiveness of the developed rules.
The hybrid approach proved to be effective for
identifying root causes of anomalies. However, we
encountered challenges related to the variability of
system behavior and the need for adaptive thresholds
(Pahl, 2023; Azimi and Pahl, 2024). Thus, future
work could focus on enhancing adaptability to chang-
ing conditions, possibly through machine learning or
dynamic threshold adjustments, to improve accuracy
and effectiveness. It could also explore an automated
remediation processes that considers more than the
container-caused failures considered so far.
REFERENCES
Ahmed, M., Mahmood, A., and Hu, J. (2016). A survey
of network anomaly detection techniques. Journal of
Network and Computer Applications.
Azimi, S. and Pahl, C. (2024). Anomaly analytics in data-
driven machine learning applications. International
journal of data science and analytics, pages 1–26.
Brandona,
´
A., Sole, M., Huelamo, A., Solans, D., Perez,
M. S., and Muntes-Mulero, V. (2023). Graph-based
root cause analysis for service-oriented and microser-
vice architectures. Journal of Systems and Software.
Dragoni, N., Lanese, I., Larsen, S., Mazzara, M., Mustafin,
R., and Safina, L. (2017). Microservices: yesterday,
today, and tomorrow. In Present & Ulterior SW Eng.
Erakovic, I. and Pahl, C. (2025). Anomaly detection for par-
tially observable container systems based on architec-
ture profiling. In International Conference on Cloud
Computing and Services Science CLOSER.
Fang, D., Liu, X., Romdhani, I., Jamshidi, P., and Pahl, C.
(2016). An agility-oriented and fuzziness-embedded
semantic model for collaborative cloud service search,
retrieval and recommendation. Future Generation
Computer Systems, 56:11–26.
CLOSER 2025 - 15th International Conference on Cloud Computing and Services Science
262
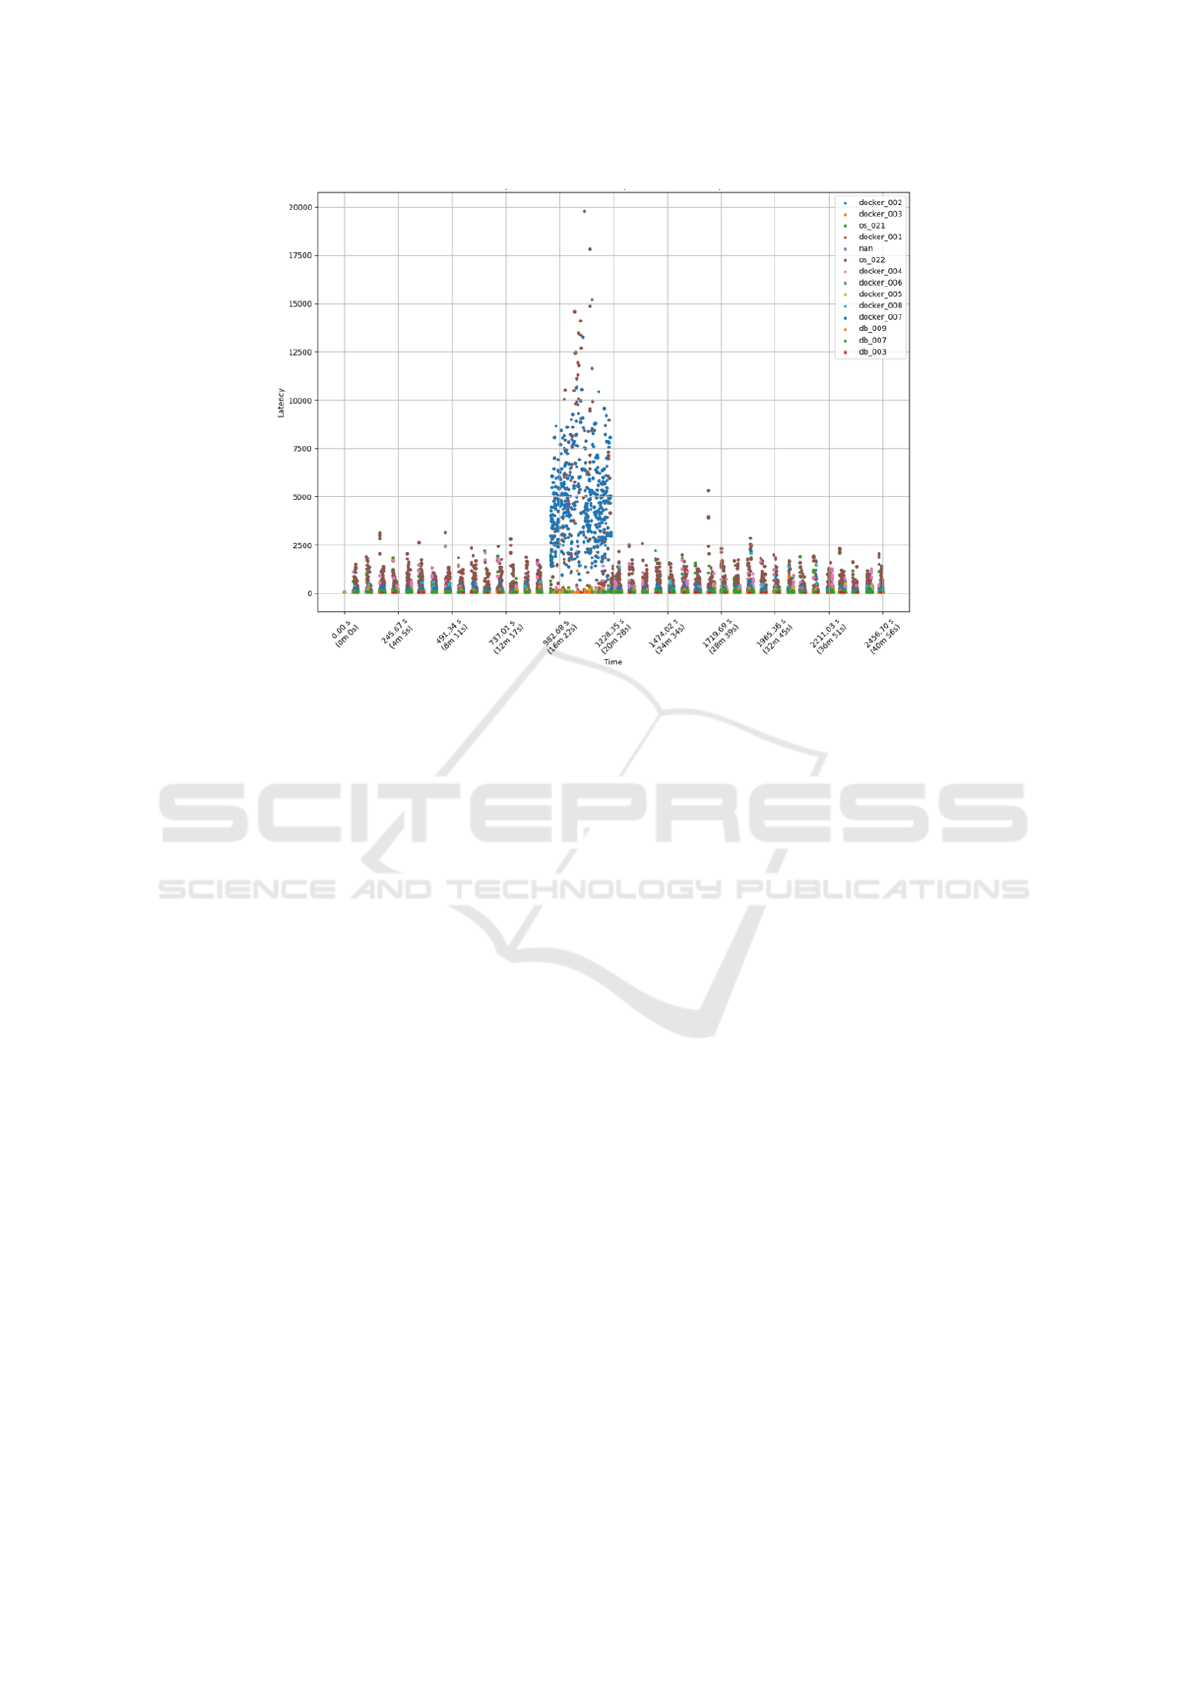
Figure 9: Latency Distribution over Time.
Fonseca, R., Porter, G., Katz, R. H., Shenker, S., and Sto-
ica, I. (2007). X-trace: A pervasive network tracing
framework. In USENIX Symposium.
Forsberg, V. (2019). Automatic anomaly detection and root
cause analysis for microservice clusters. Master’s the-
sis, Ume
˚
a University.
Hadi, R. and Girsang, A. S. (2023). Root cause analysis for
it incident using artificial neural network (ann). Jour-
nal of System and Management Sciences, 13.
Ikram, A., Chakraborty, S., Mitra, S., Saini, S. K., Bagchi,
S., and Kocaoglu, M. (2022). Root cause analysis of
failures in microservices through causal discovery. In
International Conference on Software Engineering.
Landim, L. P. T. (2023). Monitoring and detection of
anomaly in microservices environments. Master’s the-
sis, Polytechnic Institute of Castelo Branco.
Li, B., Yang, T., Chen, Z., Su, Y., Yang, Y., and Lyu, M.
(2024). Heterogeneous anomaly detection for soft-
ware systems via attentive multi-modal learning. In
ICSE.
Li, Z., Chen, J., Jiao, R., Zhao, N., Wang, Z., Zhang, S.,
Wu, Y., Jiang, L., Yan, L., Wang, Z., Chen, Z., Zhang,
W., Nie, X., Su, K., and Pei, D. (2021). Practical root
cause localization for microservice systems via trace
analysis. In Intl Symp on Quality of Service.
Merkel, D. (2014). Docker: lightweight linux containers for
consistent development and deployment. Linux Jrnl.
Mohamed, H. and El-Gayar, O. (2021). End-to-end latency
prediction of microservices workflow on kubernetes:
A comparative evaluation of machine learning models
and resource metrics. In HICSS.
Pahl, C. (2023). Research challenges for machine learning-
constructed software. Service Oriented Computing
and Applications, 17(1):1–4.
Samir, A. and Pahl, C. (2020). Detecting and localizing
anomalies in container clusters using markov models.
Electronics.
Samir, A. and Pahl, C. (2021). Autoscaling recovery ac-
tions for container-based clusters. Concurrency and
Computation: Practice and Experience, 33(23).
Scolati, R., Fronza, I., El Ioini, N., Samir, A., Barzegar,
H. R., and Pahl, C. (2020). A containerized edge cloud
architecture for data stream processing. In Lecture
Notes in Computer Science. Springer.
Sigelman, B. H., Barroso, L. A., Burrows, M., Stephenson,
P., Plakal, M., Beaver, D., Jaspan, S., and Shanbhag,
C. (2010). Dapper, a large-scale distributed systems
tracing infrastructure. Google research.
Sundberg S., Brunstrom A., F.-R. S. and S., C. (2024). Mea-
suring network latency from a wireless isp: Variations
within and across subnets. Preprint.
von Leon, D., Miori, L., Sanin, J., El Ioini, N., Helmer, S.,
and Pahl, C. A lightweight container middleware for
edge cloud architectures. Fog and Edge Computing:
Principles and Paradigms.
Wang, R., Qiu, H., Cheng, X., and Liu, X. (2023). Anomaly
detection with a container-based stream processing
framework for industrial internet of things. Journal
of Industrial Information Integration, 35.
Wang, Y., Zhu, Z., Fu, Q., Ma, Y., and He, P. (2024).
MRCA: Metric-level root cause analysis for microser-
vices via multi-modal data. In ASE.
Yu, G., Chen, P., Chen, H., Guan, Z., Huang, Z., Jing, L.,
Weng, T., Sun, X., and Li, X. (2024). Microrank: End-
to-end latency issue localization with extended spec-
trum analysis in microservice environments. In Con-
ference on Computer Communications.
Hybrid Root Cause Analysis for Partially Observable Microservices Based on Architecture Profiling
263
