Fuzzy Based Model for Mitigating Employee Attrition
Nida Hasib
1a
, Syed Wajahat Abbas Rizvi
1b
and Vinodani Katiyar
2
1
Amity University Uttar Pradesh, India
2
DSMNR University, Lucknow, India
Keywords: Model for Mitigating Employee Attrition, MMEA, Risk Code, Risk Metrics, Fuzzy Inference System, FIS.
Abstract: Employee attrition is a major concern for IT firms in today's corporate environment. Aside from the loss of
human resources, employee turnover also diminishes the organization's ability to use the expertise and
revenue-generating potential of those individuals. This study proposes a fuzzy logic-based phase-wise Model
for Mitigating Employee Attrition (MMEA) that evaluates employee attrition at each stage of the software
development life cycle using the most pertinent risk measures. The research has made use of the fuzzy
inference process power in creating a model based on the anticipated and reduced staff attrition. Using data
from sixteen actual software projects, the suggested model's predictive accuracy is confirmed. The MMEA
model developed as per the guidelines of the proposed framework may help software professionals to take
appropriate corrective measures to predict and reduce employee attrition during software development life
cycle for efficient and accurate software development process in IT sector. By giving management of the
organization the ability to proactively address attrition-related issues and make long-term strategic decisions
that benefit the company, the model effectively maximizes staff retention, according to the research. Our
results produced proof that the alternate strategy was valid. As a result, managers and companies may find a
more practical tool in the used method for evaluating employee decline.
1 INTRODUCTION
Employee attrition is a significant concern for
organizations, leading to substantial losses in IT
industry. Each organization’s context is unique, so
tailored strategies are essential. Employee attrition in
the IT industry can be influenced by several factors,
including absenteeism, performance, and
engagement. By combining predictive models, data
insights, and employee development, companies can
effectively reduce attrition rates in the software
development industry (Hasib et al. 2023).
There are various number of techniques through
which employee attrition can be mitigated in software
development industry- Data Analytics and Insights,
Upskilling and Empowering Managers, Predictive
Models Using Machine Learning, Fuzzy logic. Fuzzy
is the term used to describe things that are ambiguous
or unclear. Fuzzy is the term used to describe the
things that we commonly encounter in the real world
that are ambiguous or confusing. Fuzzy logic
a
https://orcid.org/0000-0001-8178-422X
b
https://orcid.org/0009-0006-8064-9388
provides tremendously helpful thinking flexibility
since we often encounter circumstances in the real
world when we are unable to determine whether a
condition is true or untrue.
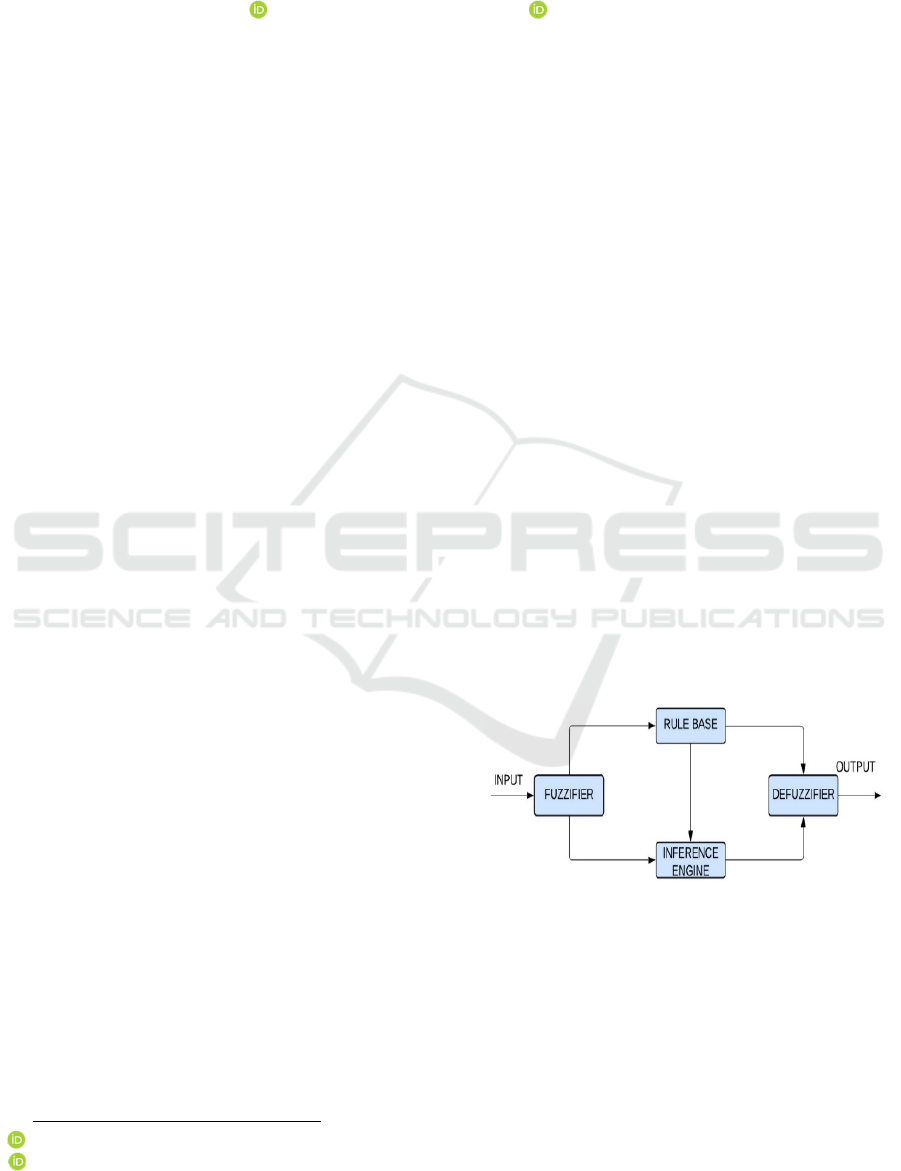
Figure 1: Fuzzy Logic Architecture.
Fuzzy logic is created using fuzzy rules, which are if-
then statements that depict the relationship between
input and output variables in a fuzzy way as rule base.
A fuzzy logic system produces a fuzzy set, which is a
collection of membership degrees for each possible
Hasib, N., Rizvi, S. W. A. and Katiyar, V.
Fuzzy Based Model for Mitigating Employee Attrition.
DOI: 10.5220/0013460500003956
Paper published under CC license (CC BY-NC-ND 4.0)
In Proceedings of the 7th International Conference on Finance, Economics, Management and IT Business (FEMIB 2025), pages 105-117
ISBN: 978-989-758-748-1; ISSN: 2184-5891
Proceedings Copyright © 2025 by SCITEPRESS – Science and Technology Publications, Lda.
105
output value
(Yadav and Yadav, 2015), (Nikmanesh,
2023).
Figure 1 depicts a fuzzy logic architecture that
handles fuzzification and defuzzification.
Figure 2 depicts a comprehensive fuzzy logic
system for reliability modelling. Fuzzy logic systems
consist of four primary parts: fuzzy rule base, fuzzy
inference process, fuzzy membership function
(input), and defuzzification (output). The process of
converting a clear value into a fuzzy value is called
fuzzification. The input and output variables are
fuzzified using linguistic variables such as low (L),
medium (M), and high (H) based on the available data
and related uncertainty. The fuzzy rule base is the
fundamental building block of all fuzzy systems.
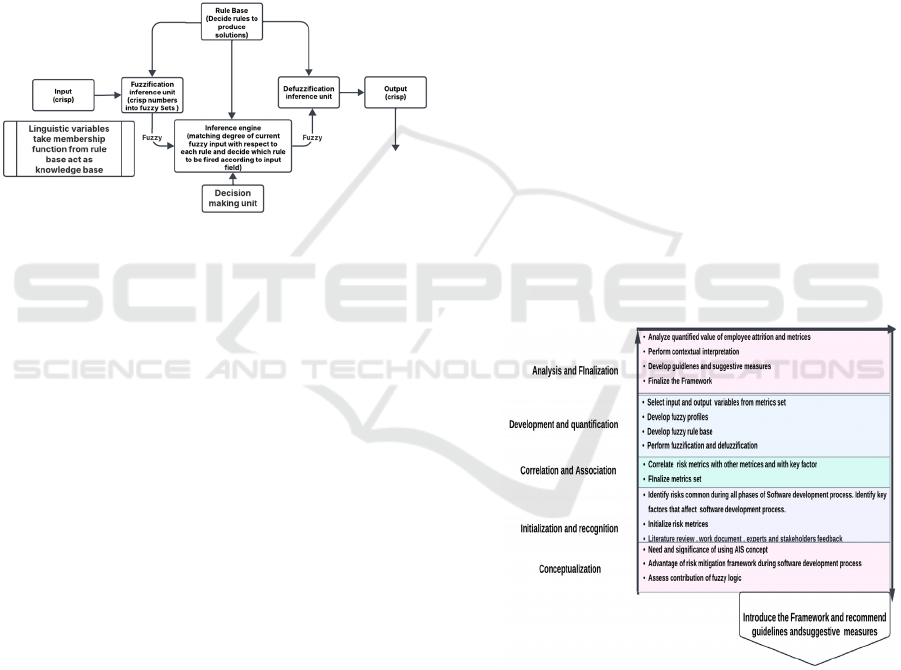
Figure 2: Overview of Fuzzy Logic System for mitigating
employee attrition.
The fuzzy rule foundation is made up of historical
data, human knowledge expertise, and failure
analysis. These rules are implemented in an
acceptable and effective manner using the other
fuzzy system components.
To sum up, fuzzy logic is a mathematical
framework that captures ambiguity and uncertainty in
decision-making; it has many uses and permits partial
truths. There is an intermediate value in fuzzy logic,
nevertheless, that is both partially true and partially
false. Thus, utilizing the risk measures that impact
employee attrition throughout the SDLC phases, a
fuzzy logic based phase-wise employee attrition
recognition and mitigation model is presented in this
article (Yadav and Yadav, 2015).
The rest of the paper is organized as follows: In
section 2, related work is discussed. In section 3, the
proposed framework is presented. Section 4 describe
implementation of phases of model. Section 5
describe empirical validation of sixteen case studies
and predicted result of MMEA, Section 6 and 7
predictive accuracies of MMEA and quantitative
comparison with other models. Conclusion and future
extensions are presented in section 8.
2 FRAMEWORK FOR
MITIGATING EMPLOYEE
ATTRITION
In continuation with the highlighted need and
significance as discussed in previous section, the
researcher has already proposed a structured
framework for Mitigating Employee Attrition (Figure
2.) based on biological immune system based
artificial immune system conceptual theory as a
solution for the identified inadequacies present in
earlier employee attrition evaluation studies (Hasib et
al., 2023) (Hasib et al., 2024).
The framework described a comprehensive
employee attrition quantification process through its
eight phases (Conceptualization, Initialization and
Recognition, Correlation and Association,
Development and Quantification, Analysis and
Finalization) as depicted in Figure 3. It has been
designed in such a way that both industry personnel
and researchers will find it simple to execute. The
framework focuses on all phases of the software
development life cycle. The researcher thoroughly
defined all of the framework's phases, as well as its
key attributes, which support its claim to be a better
employee attrition framework. (Chauhan and Patel,
2013) (Hasib et al., 2024)
Figure 3: Framework for Mitigating Employee Attrition.
3 FRAMEWORK
IMPLEMENTATION
In the proposed mode (MMEA), employee attrition
indicator during all the phases of SDLC using eleven
risk metrics for recognition and mitigation of
FEMIB 2025 - 7th International Conference on Finance, Economics, Management and IT Business
106
employee attrition of IT sectors. The model was
developed using a fuzzy inference technique, and risk
metrics are evaluated in language terms.
3.1 Implementing Conceptualization
Phase
In terms of the framework, this phase serves as the
foundation for the subsequent phases. This is the
initial phase in developing a comprehensive solution
to a problem. The image illustrates two subtasks: The
importance of applying the AIS idea and
implementing a risk mitigation framework during
software development are discussed in (Hasib et al.,
2023) (Hasib et al., 2024). The first two sections of this
paper and past research work covered all three
conceptual subtasks.
3.2 Implementing Initialization and
Recognition Phase
Certain risk issues pose a hazard to every stage of the
SDLC, from the project's first examination to its final
release. The risk factors that are relevant to every stage
of the SDLC are continually changing requirements,
time contention, project funding loss, team attrition,
data loss, miscommunication. One the key factor that
effect software development process most according
to literature review is employee attrition. Employee
attrition effects and disturb continuous processing of
Software development life cycle phases and impact
IT sectors/industries in its cost, efficiency and
productivity.
There are number of causes of employee attrition
in IT industries during software development process.
A number of employee attrition reduction
frameworks uses risk metrics has been proposed in
last two decades. The accuracy of predictions may
rise with the selection of risk measures. But the most
important factors in lowering employee attrition have
to be taken into account. As a result, the researcher
obtained a number of risk measures from various
available sources through a literature study. As per
the comprehensive literature review performed by
researcher there are number of variables exist in
literature that effects employee attrition in IT sectors
(Gupta and Bhatia, 2023), (Rusi and Viollet, 2023).
Researcher has taken top most recommended risk
metrics that effects most out of number of factors
which are reasons of employee attrition in IT industry
(Table 1) (Hasib et al., 2025). Those are considered
as risk metrics for recognition and mitigation of
employee attrition through quantification analysis of
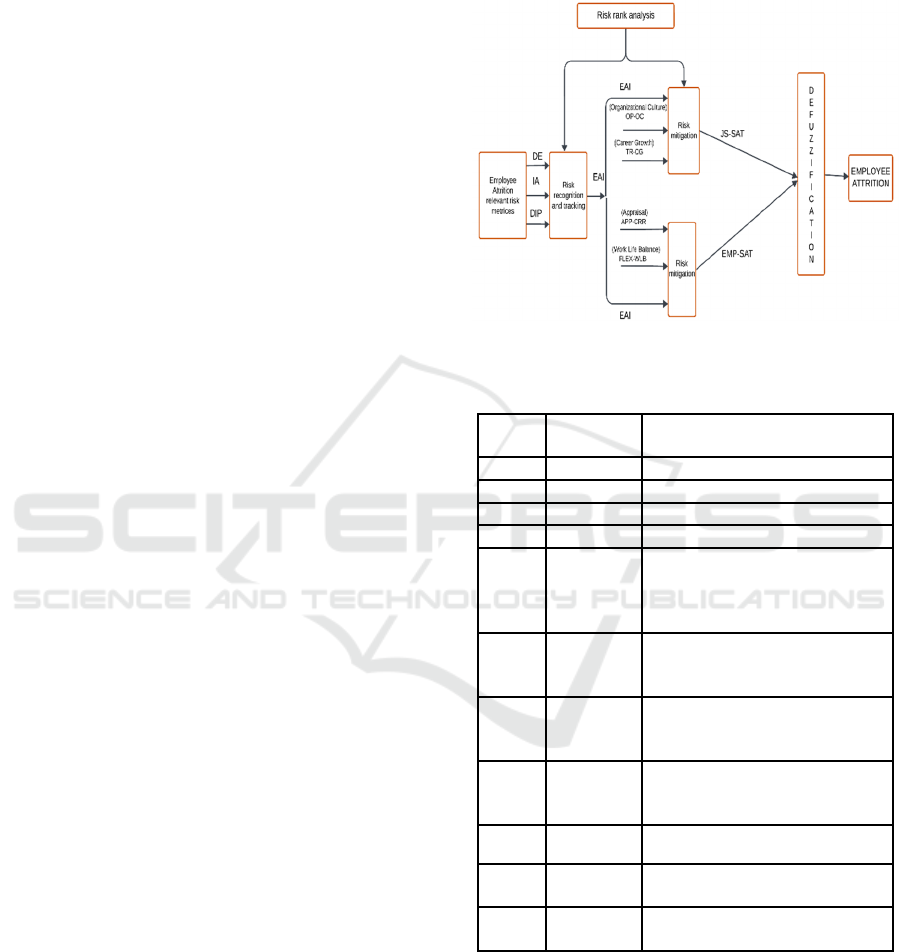
our model (MMEA) (Figure 4). The objective of the
initialization and recognition phase is to initialize and
recognize the effectiveness of factors that are related
directly or indirectly to the employee attrition during
software development process.
Figure 4: Model for Mitigating Employee Attrition.
Table 1: Risk Code and Metrics.
S.NO.
Risk
Code
Risk Metrics
1 DE Decreased Engagement
2 IA Increased Absenteeism
3 DIP Decline in Performance
4EAIEm
p
lo
y
ee Attrition Indicator
5 OP-OC
Organization
Culture
(Openness-Organizational
Culture)
6 TR-CG
Career Growth opportunities
(Training-Career Growth
opportunities)
7
APP-
CRR
Appraisal
(Appraisal-Compensation,
reward, recognition)
8
FLEX-
WLB
Work Life Balance
(Flexibility-Work Life
Balance)
9 JS-SAT Job Satisfaction
10
EMP-
SAT
Employee Satisfaction
11
EMP-
ATT
Employee Attrition
3.3 Implementing Correlation and
Association Phase
In this step of the framework the researcher has
shortlisted eleven metrics out of others form the
literature review of different organization dealing with
evaluation of employee attrition for betterment of
Fuzzy Based Model for Mitigating Employee Attrition
107
software development process in IT industries (Hasib et
al., 2025). Out of these some refer to risk recognition
phase and other refers to risk mitigation (Kermani,
2021). All risk metrics are assigned with linguistic
values after expert renewal. After that correlation and
association process conducted through risk matrix
between key risk metrics (employee attrition indicator
and employee attrition, job satisfaction, employee
satisfaction) with other risk metrics on the basis of if-
then analysis. (Figure 5).
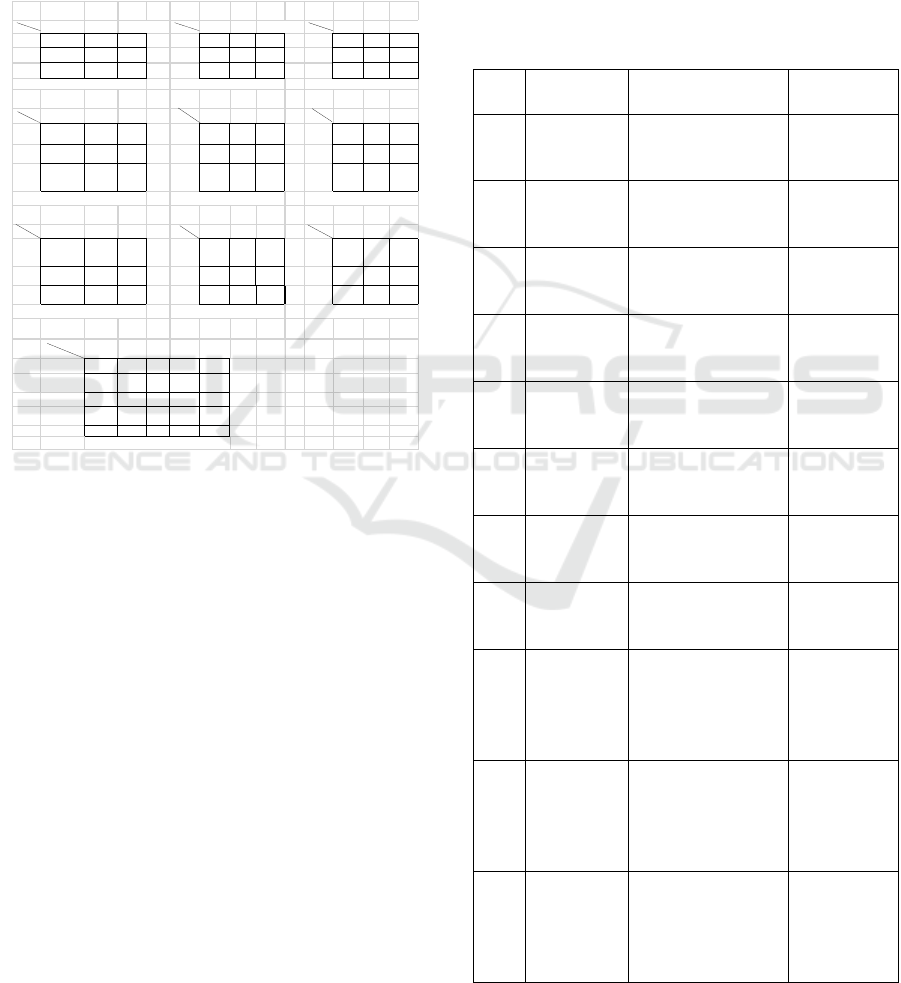
Figure 5: Risk metric analysis in FIS1, FIS2, FIS3, FIS4
using risk matrix.
After rationalizing association and correlation with
respect to employee attrition of recognized risk
metrics in above section, finally is to freeze metric set
which can be mutated according to strategies of
organization environmental condition during
software development process and employee attrition
mitigation accuracy will be maintained.
3.4 Implementing Development and
Quantification Phase
Since the actual development of the MMEA occurs
during this phase, it is the most important one in the
framework. The model is implemented using the
Mandani type-1 fuzzy logic toolbox in MATLAB
R2024a. The model's fundamental steps include
choosing risk metrics (input/output variables),
creating a fuzzy profile of these variables, creating a
fuzzy rule base, and utilizing a fuzzy inference system
(FIS) to recognize and mitigate employee attrition
throughout the software development process at all
stages.
The forms of membership functions can be
polygonal, trapezoidal, triangular, and more. Triangle
membership functions are taken into consideration in
this study for the creation of fuzzy profiles for a
variety of identified input/output variables (Table 2).
Due to its simplicity and ease of comprehension,
triangular membership functions (TMFs) are
frequently employed for the computation and
interpretation of employee attrition statistics.
Table 2: Risk metrics range of membership function.
S.
NO.
Risk
Metrics
Input/ Output
metrics
MF range
(0-1)
1 DE Less, Somewhat,
More
[-.5 0 .5],
[0 .5 1], [.5
1 1.5]
2 IA Low, Moderate,
Substantial
[-.5 0 .5],
[0 .5 1], [.5
1 1.5]
3 DIP Low, Moderate,
Substantial
[-.5 0 .5],
[0 .5 1], [.5
1 1.5]
4 EAI Low, Medium,
High
[-.5 0 .5],
[0 .5 1],
[.5 1 1.5]
5 OP-OC Poor, Average,
Good
[-.5 0 .5],
[0 .5 1],
[.5 1 1.5]
6 TR-CG Limited, Average,
Ample
[-.5 0 .5],
[0 .5 1],
[.5 1 1.5]
7 APP-CRR Low, Medium,
High
[-.5 0 .5],
[0 .5 1], [.5
1 1.5]
8 FLEX-WLB Poor, Average,
Good
[-.5 0 .5],
[0 .5 1], [.5
1 1.5]
9 JS-SAT Dissatisfied,
slightly satisfied,
neutral,
somewhat
satisfied, satisfied
[-.25 0 .25],
[0 .25 .5],
[.25 .5 .75],
[.5 .75 1],
[.75 1 1.25]
10 EMP-SAT Dissatisfied,
slightly satisfied,
neutral,
somewhat
satisfied, satisfied
[-.25 0 .25],
[0 .25 .5],
[.25 .5 .75],
[.5 .75 1],
[.75 1 1.25]
11 EMP-ATT Very Low, Low,
Medium, High,
Very High
[-.25 0 .25],
[0 .25 .5],
[.25 .5 .75],
[.5 .75 1],
[.75 1 1.25]
F
I
S
1
Low Moderate Substantial Low Moderate Substantial Low Moderate Substantia
Less Low Medium High Less Low Medium High Low Low Medium High
Some
w
ha
t
Low Medium High
Somewhat
Low Medium High
Moderate
Low Medium High
More Medium High High More Medium High High Substantia Medium High High
EAI (Employee Attrition Indicator) EAI (Employee Attrition Indicator) EAI (Employee Attrition Indicator)
F
I
S
2
Poor Average Good Limited Average Ample Limited Average Ample
Low
Somewhat
satisfied
Somewhat
satisfied
Satisfied
Low
Somewhat
satisfied
Somewh
at
ti fi d
Satisfied
Poor
Dissatisfie
d
Slightly
Satisfied
Somewha
t satisfied
Med ium
Slightly
Satisfied
Nuetral Somewha
t satisfied
Med ium
Slightly
Satisfied
Nuetral Somewha
t satisfied
Average
Slightly
Satisfied
Nuetral Somewha
t satisfied
High
Dissatisfied Slightly
Satisfied
Slightly
Satisfied
High
Dissatisfie
d
Slightly
Satisfied
Slightly
Satisfied
Good
Somewhat
satisfied
Somewh
at
satisfied
Satisfied
JS-SAT (Job Satisfaction) JS-SAT (Job Satisfaction) JS-SAT (Job Satisfaction)
F
I
S
3
Poor Average Good Low Medium High Poor Average Good
Low
Dissatisfied Slightly
satisfied
Somewha
t satisfied
Low Somewhat
satisfied
Somewh
at
satisfied
Satisfied Low Somewhat
satisfied
Somewh
at
satisfied
Satisfied
Med ium
Slightly
satisfied
Nuetral Somewha
t satisfied
Medium Slightly
satisfied
Nuetral Somewha
t satisfied
Medium Slightly
satisfied
Nuetral Somewha
t satisfied
High
Somewhat
satisfied
Somewhat
satisfied
Satisfied High Dissatisfie
d
Slightly
satisfied
Slightly
satisfied
High Dissatisfie
d
Slightly
satisfied
Slightly
satisfied
EMP-SAT (Em ployee Satisfaction) EMP-SAT (Em ployee Satisfaction) EMP-SAT (Employee Satisfaction)
F
I
S
4
Dissatisfied Slightly
satisfied
Nuetral Somewhat
satisfied
Satisfied
Dissatisfied
VH H M L VL
Slightly
satisfied
HHMLVL
Neutral
MMMLVL
Somewhat
satisfied
LLLVLVL
Satisfied
VL VL VL VL VL
EMP-ATT ( Employee Attrition )
IA
DE
DIP
DE
DIP
IA
EAI
TR-CG
EAI
TR-CG
OP-O
C
FLEX-W
L
APP-CRR
OP-OC
EAI
EAI
APP- CRR
FLEX-WLB
EMP-SAT
JS-SAT
FEMIB 2025 - 7th International Conference on Finance, Economics, Management and IT Business
108
FIS 1
Figure 6: Fuzzy Inference System (FIS 1) plot.
Figure 7: 27 Rules of FIS1.
FIS 2
Figure 8: Fuzzy Inference System (FIS 2) plot.
Figure 9: 27 Rules of FIS2.
FIS 3
Figure 10: Fuzzy Inference System (FIS 3) plot.
Figure 11: 27 Rules of FIS3.
FIS 4
Figure 12: Fuzzy Inference System (FIS 4) plot.
Figure 13: 25 Rules of FIS4.
Fuzzy Based Model for Mitigating Employee Attrition
109
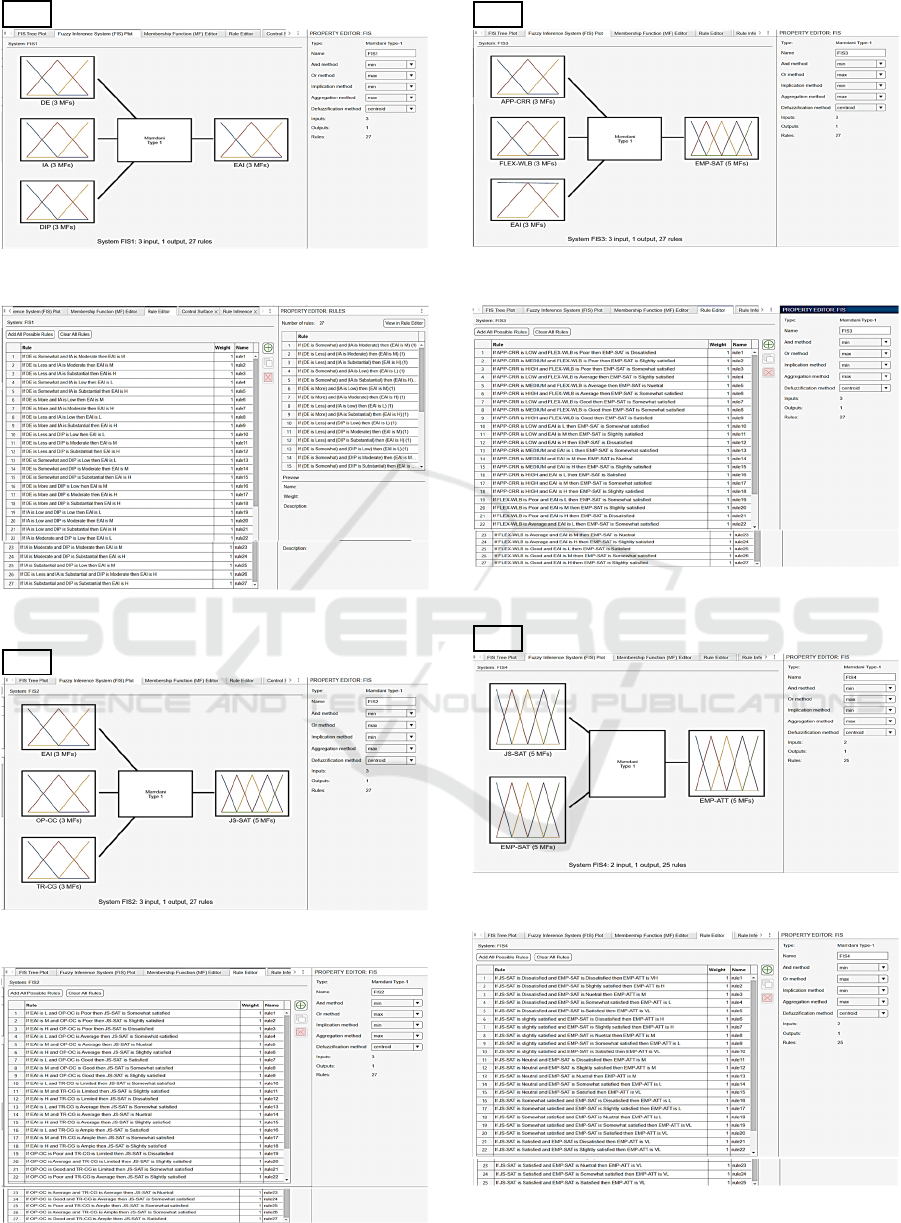
From the above correlation and association phase, it
has been visualized that range of membership
function are created between 0-1. As shown in above
(Table 2) first eight risk metrics have three MFs
ranges and last three risk metrics form the list have
five MFs ranges. On the basis of the previous phase,
we come to know how much fuzzy rules are to be
prepared, 106 fuzzy rules are prepared for dealing
with recognition and mitigation of employee attrition
using different risk metrics. With reference to these
fuzzy rules, fuzzy inferences are reflected with
various significant values from organizations work
modules document. Employee attrition evaluation
performed through these rules and their inferences to
recognize level of attrition and try to reduce attrition
percentage through manipulating various risk metrics
in proposed model based on organization
environmental condition. The explanatory process of
proposed model is shown above in this section as 4
Fuzzy Inference System (FIS1, FIS2, FIS3, FIS4)
which consist of Fuzzy Inference System(FIS) plot;
property editor of all FIS consist of -implication
method (min), aggregation method (max),
defuzzification method (centroid); membership
function plot for every metrics showing degree of
membership; rule editor showing all possible rules
created in every fuzzy inference system; rule
inference system. In proposed model FIS 1 consist of
27 rules, FIS 2 consist of 27 rules, FIS 3 consist of 27
rules, FIS 4 consist of 25 rules. In all total 106 rules
to solve employee attrition mitigation problem in IT
sectors. (Figure 6 to Figure 13) shows all fuzzy
profiles of FIS 1, FIS2, FIS3, FIS4 including its fuzzy
inference system plot, fuzzy profiles with
membership ranges, and fuzzy rules (Ahmed et al.,
2013).
3.5 Implementing Analysis and
Finalization Phase
Although the developed Model for Mitigating
Employee Attrition has been theoretically and
empirically validated for accuracy and efficiency
even though in order to analyse employee attrition
consistency an analysis on special cases (0,0.5,1) of
risk metrics during every phase of framework has
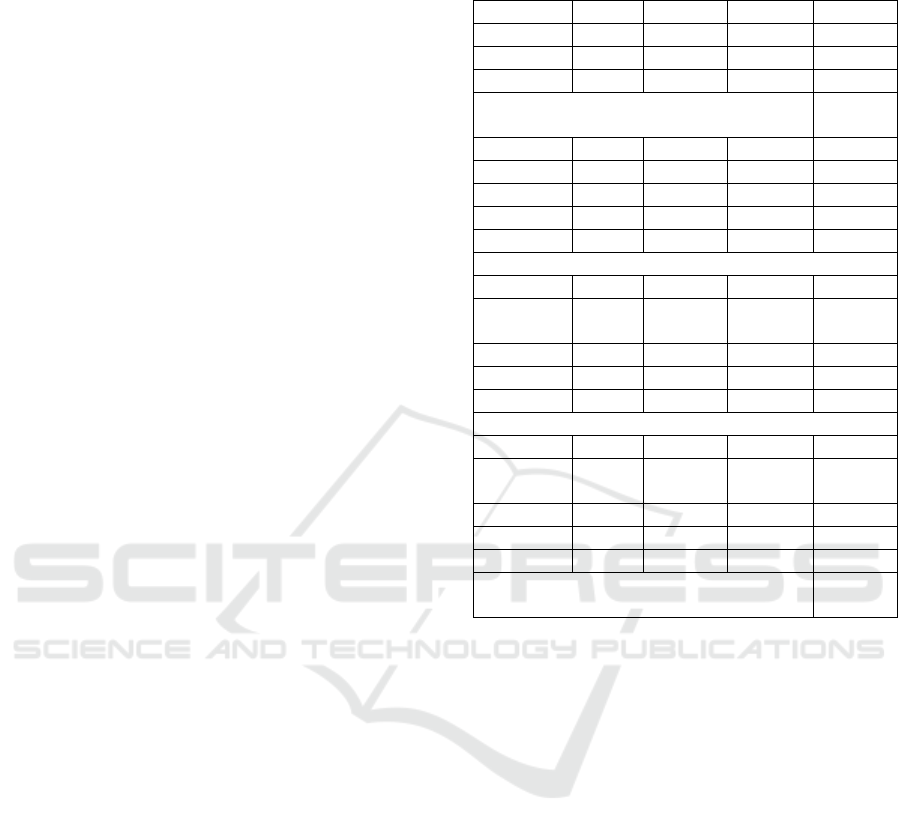
been presented in (Table 3).
Table 3: Special cases of EAI, JS-SAT, EMP-SAT for
employee attrition mitigation.
DE IA DIP EAI
Best 0 0 0 0.163
Average 0.5 0.5 0.5 0.5
Worst 1 1 1 0.837
Employee Attrition Indicator at
Initialization and Recognition phase
OP-OC TR-CG EAI JS-SAT
Best 1 1 0 0.92
Average 0.5 0.5 0.5 0.5
Worst 0 0 1 0.08
Job satisfaction during mitigation phase
APP-
CRR
FLEX-
WLB
EAI EMP-
SAT
Best 1 1 0 0.92
Average 0.5 0.5 0.5 0.5
Worst 0 0 1 0.08
Employee Satisfaction during mitigation phase
JS-SAT EMP-
SAT
EMP-
ATT
Best 0 0 0.92
Average 0.5 0.5 0.5
Worst 1 1 0.08
Employee Attrition during Mitigation
phase
The following stage is to formulate several suggestive
measures based on the analysis carried out in the
previous step. These actions will serve as suggestions
for reducing staff attrition. These recommendations
will help control the risk metrics' values and lessen
employee churn in the IT industry when software
projects are being developed. As a result, the staff
members engaged in the software development
process' risk recognition and mitigation phase have
the following recommendations made for them.
a) Recognize the change in engagement,
performance, absenteeism by taking feedback from
employees. Target the threshold of 20% of
recognized variables. On the basis of last work
documents of company recognized variables will be
updated according to organization environmental
conditions. Value greater than or equal to 25% will
undergo mitigation process, as this will impact on the
percentage of employee attrition.
b) On the basis of value of DE (Somewhat, More),
DIP (Moderate, Substantial), IA (Moderate,
Substantial) in recognition phase based on feedback,
interview, past work document, strategies are
followed according to the fuzzy rules implemented. If
FEMIB 2025 - 7th International Conference on Finance, Economics, Management and IT Business
110
DE, IA, DIP is more than threshold then EAI will be
average and worst.
c) Strategies may be changed throughout the software
development life cycle on the basis of organization
environment feedback.
d) In this study OP-OC, TR-CG, must be changed
during phases of the software life cycle towards 100%
for better Job Satisfaction and better reduced
employee attrition.
e) In this study APP-CRR, FLEX-WLB must be
changed during phases of the software life cycle
towards 100% for better Job Satisfaction and better
reduced employee attrition.
f) JS-SAT and EMP-SAT both are directly
proportional to EMP-ATT (Employee Attrition).
density.
g) Job satisfaction and employee satisfaction level
must be above 25% for better employee attrition.
In the light of above guidelines, the following
recommendations are made to the designer in order to
mitigate employee attrition for smooth functioning of
all phases of software development process.
Continuously monitor the effectiveness of the
implemented strategies and adjust the FIS and rules
as needed to reflect changes in the organization or
industry trends.
4 EMPIRICAL VALIDATION OF
THE MMEA
In order to statistically validate the proposed model
(MMEA), this section of the work calculates the
Pearson's correlation coefficient between the actual
employee attrition values, which are already known,
and the defuzzified (predicted) values using a model
that is used in an IT organization's software
development process to reduce employee attrition.
The researcher contacted reputable and well-
established software development companies in
Noida and Lucknow to confirm or validate the
model's ability to quantify. The researcher then
gathered pertinent data during all phases of software
development life cycle of 16 software projects that
were already implemented and operating (see
appendix). The Table 4 indicate actual data quantified
from above mentioned dataset and predicted data
from proposed research framework.
Table 4: Actual and predicted values.
PROJECTS ACTUAL PREDICTED
1 0.4 0.372
2 0.49 0.473
3 0.4 0.366
4 0.45 0.35
5 0.58 0.5
6 0.39 0.322
7 0.313 0.25
8 0.236 0.2
9 0.45 0.3
10 0.55 0.42
11 0.54 0.42
12 0.7 0.6
13 0.6 0.55
14 0.58 0.52
15 0.45 0.42
16 0.43 0.38
In order to validate the proposed model (MMEA),
EMP-ATT has been computed using the fuzzy
toolbox of MATLAB, for 16 software projects, those
are currently in operation. The related real values and
their predicted values are shown in the (Table 4). The
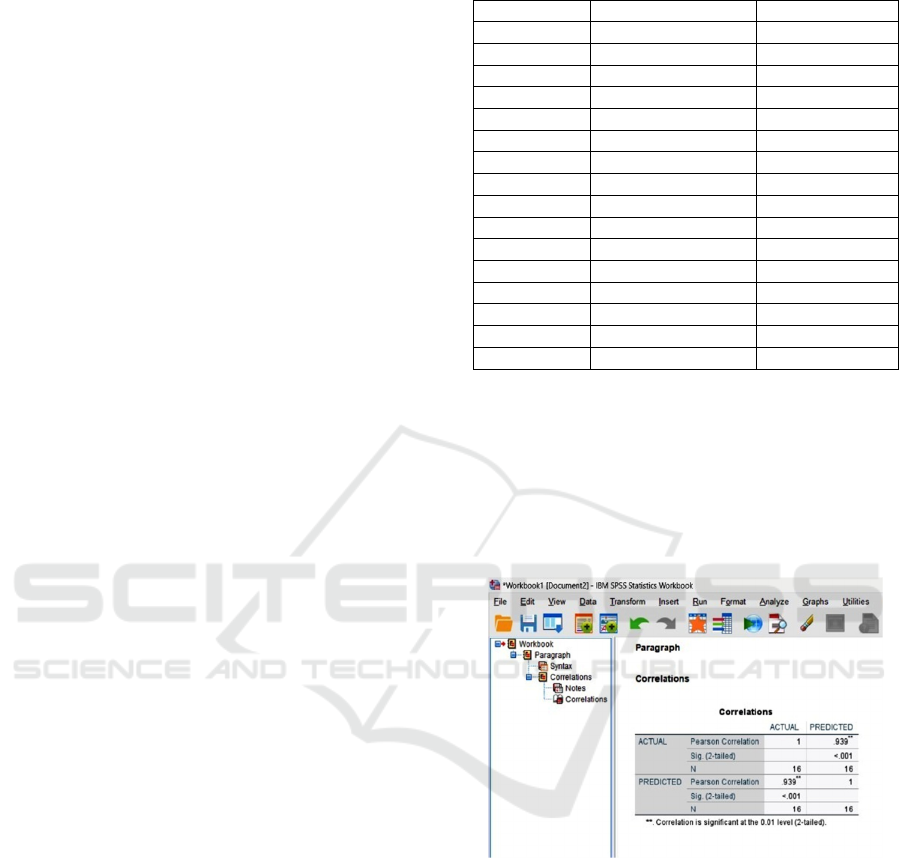
Pearson's correlation coefficient between anticipated
and actual employee attrition has now been calculated
to verify the model's capacity to be quantified.
Figure 14: SPSS correlation analysis.
The correlation was calculated using IBM SPSS,
and as (Figure 14) illustrates, its value is (0.939). The
correlation value makes it clear that there is a
substantial association between the employee
attrition values that are already known and the
attrition that the MMEA predicts and mitigates. As a
result, it can be said that the suggested model
effectively quantifies staff attrition (Priambodo et al.,
2022).
Fuzzy Based Model for Mitigating Employee Attrition
111
5 RESULTS AND DISCUSSIONS
5.1 Comparison on Employee Attrition
Values
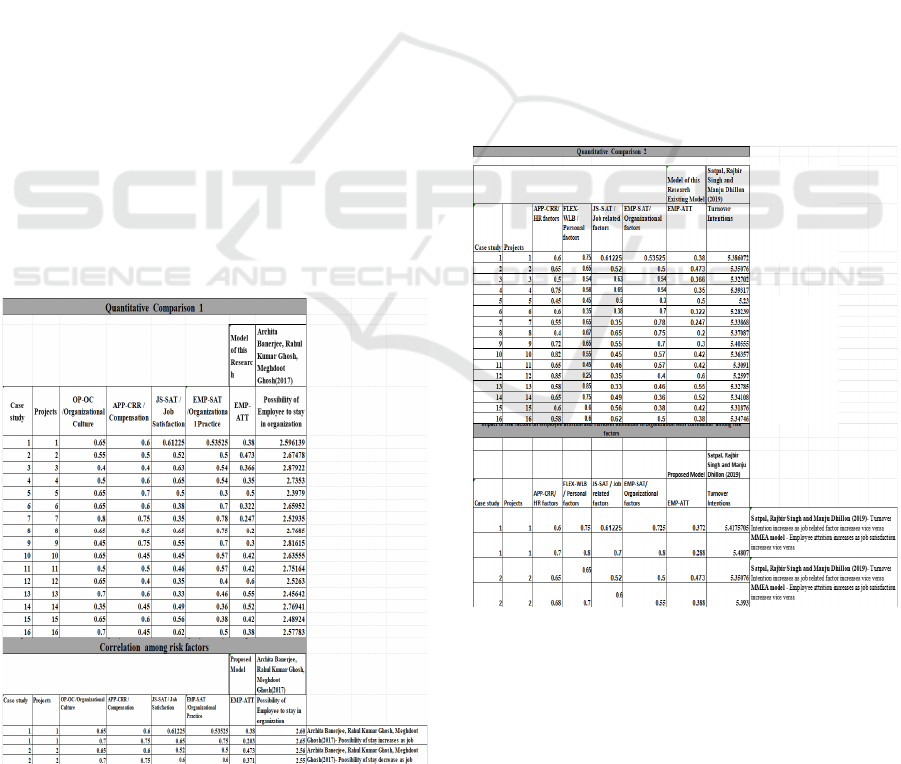
Following section is going to briefly describe and
quantitatively compare some of those studies on the
basis of their relevance with the new Model for
Mitigating Employee Attrition (MMEA) in terms of
their quantified employee attrition values.
(Archita Banerjee, Rahul Kumar Ghosh,
Meghdoot Ghosh, 2017) (Figure 15) contributed to
the West Bengal IT sector and developed a model for
employee retention. The equation that resulted from
the procedure is as follows:
Y= 2.897 - 0.864X1 - 0.305X2 + 0.174X3 +
0.630X4
(1)
Where, Y denote Possibility of staying in the existing
organization, X1 is Uncongenial Organizational
Culture, X2 is Insufficient Compensation follows, X3
is Job Satisfaction, X4 is Sociable Organizational
Practice
Looking at the table values, it is clear that the
MMEA developed in this study predicts and manages
the process of reducing employee attrition in the IT
industry during the software development process
more accurately than the model developed by Archita
Banerjee, Rahul Kumar Ghosh, and Meghdoot Ghosh
(2017) as (shown in Figure 15).
Figure 15: Comparison between proposed model and
existing model.
Satpal, Rajbir Singh and Manju Dhillon (2019)
provided a model for the constructs that exist in the
literature, but only selected dimensions of both
constructs are utilized to generate inferences that
assist companies in identifying factors that influence
attrition intentions. The equation which emerged after
the process was as
Attrition Intentions (C) = 4.884 + 0.215 × H
R
Factors + 0.201 × Personal Factors + 0.218 ×
Job Related Factors + 0.166 × Organizational
Factors.
(2)
The study attempts to investigate and establish a
relationship between a number of characteristics that
may contribute to retention risks. The study also aims
to draw attention to the shift in tactics used to lower
staff attrition.
Now looking at the table values it can be easily
inferred that the MMEA developed in this research
predict and manage the process of mitigation of
employee attrition in IT industry during software
development process quiet accurately than the model
developed by (Satpal and Dhillon, 2019) as (shown in
Figure 16).
Figure 16: Comparison between proposed model and
existing model.
Deepesh Mamtani and Dr. Bharti Malukani
(2023) suggested a model that focuses on making
precise predictions about employee attrition, needing
a suitable dataset for training and validation reasons.
The implemented machine learning methods are
thoroughly examined, and the results are compiled.
FEMIB 2025 - 7th International Conference on Finance, Economics, Management and IT Business
112

The major goal of this work is to create and apply a
prediction model that can effectively forecast staff
attrition inside a corporation. Proposed model for
employee attrition is expressed in equation which
emerged after the process of logistic regression is
lnactive% = - 3.7*satisfaction_level + 0.20 *
evaluation_score + 0.170 *number_of_years +
0.18
(3)
The study seeks to investigate and establish a link
between numerous elements that may be responsible
for retention risk. Furthermore, the study attempts to
highlight the shift in techniques used and evolving
with the concept of employee engagement to reduce
staff attrition. Looking at the table values, it is clear
that the MMEA developed in this study predicts and
manages the process of reducing employee attrition in
the IT industry during the software development
process more accurately than the model developed by
(Mamtani and Malukani, 2023), as (shown in Figure
17).
Figure 17: Comparison between proposed model and
existing model.
5.2 Measures of Predictive Accuracy
Along with validating a model, guaranteeing its
predicted accuracy is a vital component of any
models development. Any improvement in the
accuracy of employee attrition prediction can have a
major impact on the quality of the software product
under development. The literature shows that the
most popular measures are Magnitude Square Error
(MSE), Mean Magnitude of Relative Error (MMRE),
Balanced MMRE, Mean Absolute Percentage Error
(MAPE), and Prediction at level n (Pred(n)). The
researcher used MATLAB fuzzy toolbox to forecast
and reduce employee attrition of software projects
that are part of the data set by calculating job
satisfaction and employee satisfaction during the
software development process. Table 5 displays the
actual and expected employee attrition values for
each of the 16 projects and predictive accuracy of the
model through these values.
The MMRE number is highly encouraging, falling
significantly below the acceptability criterion of 0.25.
Conte et al recommend MMRE ≤ 0.25 accepted as a
prediction accuracy for prediction model. The
Balanced Mean Magnitude of Relative Error
(BMMRE) and Mean Absolute Percentage Error
(MAPE) are the next important accuracy metrics to
calculate after the MMRE as shown in Figure 18. It is
evident from the figures of the several accuracy
metrics that the Model for Mitigating Employee
Attritions has a reasonably accurate prediction ability.
Consequently, the model may be applied to precisely
predict, quantify, and reduce employee attrition
across the software development process and life
cycle. Given that the errors are less than half the
difference between two output outcomes, the model's
validation showed satisfactory validity.
Figure 18:
Measures of Predictive Accuracy for MMEA
Model.
ACTUAL PREDICTED ERROR
ABS OF ERROR Square of error MRE
BMRE %ERROR
1 0.4 0.372 0.0280 0.0280 0.0008 0.0700 0.0753 7.0000
2 0.49 0.473 0.0170 0.0170 0.0003 0.0347 0.0359 3.4694
3 0.4 0.366 0.0340 0.0340 0.0012 0.0850 0.0929 8.5000
4 0.45 0.35 0.1000 0.1000 0.0100 0.2222 0.2857 22.2222
5 0.58 0.5 0.0800 0.0800 0.0064 0.1379 0.1600 13.7931
6 0.39 0.322 0.0680 0.0680 0.0046 0.1744 0.2112 17.4359
7 0.313 0.25 0.0630 0.0630 0.0040 0.2013 0.2520 20.1278
8 0.236 0.2 0.0360 0.0360 0.0013 0.1525 0.1800 15.2542
9 0.45 0.3 0.1500 0.1500 0.0225 0.3333 0.5000 33.3333
10 0.55 0.42 0.1300 0.1300 0.0169 0.2364 0.3095 23.6364
11 0.54 0.42 0.1200 0.1200 0.0144 0.2222 0.2857 22.2222
12 0.7 0.6 0.1000 0.1000 0.0100 0.1429 0.1667 14.2857
13 0.6 0.55 0.0500 0.0500 0.0025 0.0833 0.0909 8.3333
14 0.58 0.52 0.0600 0.0600 0.0036 0.1034 0.1154 10.3448
15 0.45 0.42 0.0300 0.0300 0.0009 0.0667 0.0714 6.6667
16 0.43 0.38 0.0500 0.0500 0.0025 0.1163 0.1316 11.6279
0.1018 0.1489
2.9642 238.2530
MSE(Mean Square
Error)
0.006363625
RMSE(Root Mean
Square Error)
0.079772332
MMRE/MPE(Mean
Magnitude of
relative error/Mean
percentage error)
0.009306758
BMMRE(Balanced
MMRE)
0.185262887
MAPE(Mean
Absolute percentage
error)
14.89081323
PREDICTION AT
LEVEL 0.25
Pred(0.25)
93.75 93.75% of predicted EMP-ATT value by EAMM have MRE's less than or equal to 0.25
PROJECTS
Fuzzy Based Model for Mitigating Employee Attrition
113
Looking at the values of various accuracy measures,
it is evident that prediction ability of the Employee
Attrition Mitigation Model is quiet accurate.
Therefore, it can be concluded that the model can be
used to accurately predict, track and mitigate
employee attrition during software development life
cycle during software development process. The
errors validated by the model exhibited satisfactory
validity, as they are less than half the distance
between two output results (Nikmanesh,2023).
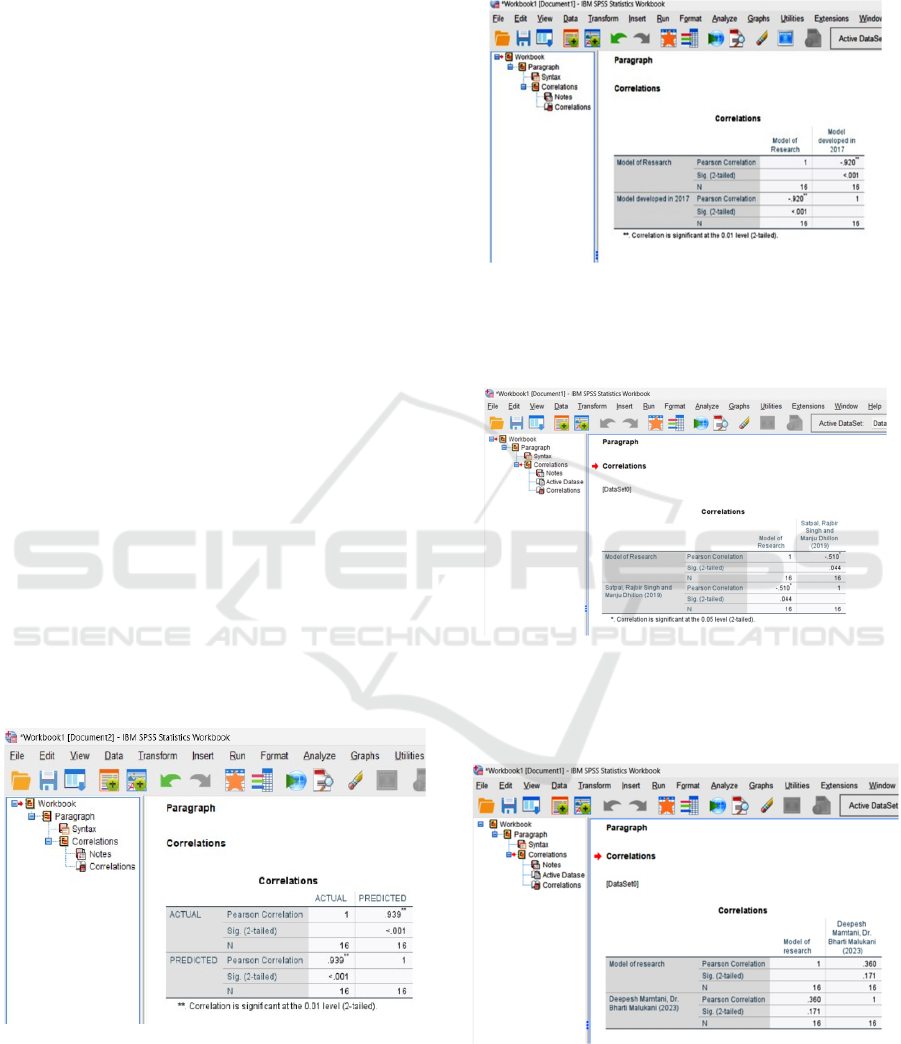
5.3 Comparison on Correlation
Coefficient
The researcher has computed the Pearson’s
Correlation Coefficient between the predicted values
of employee attrition (through the proposed model;
Archita Banerjee, Rahul Kumar Ghosh, Meghdoot
Ghosh (2017); Satpal, Rajbir Singh and Manju
Dhillon (2019); Deepesh Mamtani, Dr. Bharti
Malukani (2023)) and the actual values of the
employee attrition. Looking at the values of the
following table it can be easily noticed that the
proposed model in this research has a very High
Positive Correlation, While the research work done
by Archita Banerjee, Rahul Kumar Ghosh, Meghdoot
Ghosh(2017) has High Negative Correlation, and the
work done in the same area by Satpal, Rajbir Singh
and Manju Dhillon (2019) has a Moderate Negative
Correlation, and research study by Deepesh Mamtani,
Dr. Bharti Malukani (2023) produces Moderate
Positive Correlation (Figure 19 –Figure 22).
Proposed Model Pearson’s Correlation Coefficient Measure
Figure 19: Correlation analysis of proposed model.
Archita Banerjee, Rahul Kumar Ghosh, Meghdoot Ghosh
(2017) Pearson’s Correlation Coefficient measure (Banerjee et
al., 2017)
Figure 20: Correlation analysis of model developed in
2017.
Satpal, Rajbir Singh and Manju Dhillon (2019) Pearson’s
Correlation Coefficient measure (Satpal and Dhillon, 2019)
Figure 21: Correlation analysis of model developed in
2019.
Deepesh Mamtani, Dr. Bharti Malukani (2023) Pearson’s
Correlation Coefficient (Mamtani and Malukani, 2023)
Figure 22: Correlation analysis of model developed in
2023.
FEMIB 2025 - 7th International Conference on Finance, Economics, Management and IT Business
114
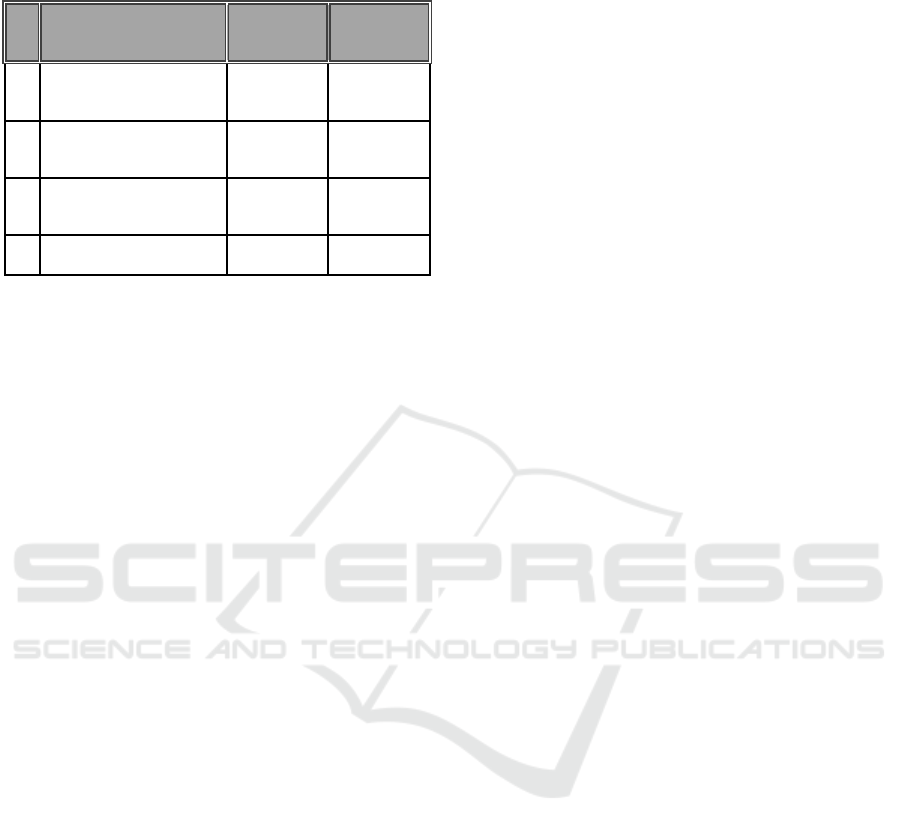
Table 5: Correlation levels of proposed model with other
models.
S.
No.
Employee Attrition
Model
Pearson's
Correlation
Coefficient
Correlation
level
1 Archita Banerjee, Rahul
Kumar Ghosh, Meghdoot
Ghosh(2017) (Figure 20)
-920 High
Negative
2 Satpal, Rajbir Singh and
Manju Dhillon (2019)
(Figure 21)
-510 Moderate
negative
3 Deepesh Mamtani, Dr.
Bharti Malukani (2023)
(Figure 22)
0.360 Low positive
4 Proposed Model(MMEA)
(Figure 19)
0.939 High Positive
Therefore, it can be concluding that the model
(MMEA) of this research is better than the three
existing models, on the basis of quantitative values
(Table 5).
6 CONCLUSION AND FUTURE
EXTENSION
This study could serve as the basis for future research
for risk mitigation in software organizations. The
framework is quite prescriptive in nature, and will
definitely facilitate industry professionals and
researchers to recognize and reduce employee
attrition during software development life cycle
process of software development in IT industry.
Consideration of the employee attrition indicator
along with employee attrition effected by other risk
factors on the basis of its value is an edge over other
studies those are based on only prediction and
considering employee data because ignoring or
overlooking indicator factors and only concentrating
on making the risk metrics will not seem good
enough.
The MMEA model developed as per the
guidelines of the proposed framework in analysis and
finalization phase in section 4 may help software
professionals to take appropriate corrective measures
right from starting phase and continuing towards
other phases on the basis of immune theoretical
concept of primary measures and secondary measures
to help designers as well as developers to predict and
reduce employee attrition during software
development process in the software development life
cycle with an improved efficiency and quality level.
The research has utilized the strength of fuzzy
inference process in building model. The assessment
and amendment of the framework further strengthens
it practicality as well as viability by keeping the doors
of improvement open for any of the earlier phases. In
most of the cases, developed models only provide
quantitative values but neither provides suggestions
on how to make improvement, nor the precautions on
how to avoid abnormalities. Therefore, to fill this gap
research has provided the suggestive measures and
recommendations based on the results and contextual
interpretations.
Apart from the above, reassessment of previously
developed or underdevelopment employee attrition
models could be done as per the guidance proposed
as well as recommendation in this study (Gupta,
2022), (Wardhani and Lhaksmana, 2022),
(Udechukwu and Mujtaba, 2007). Beside this, as far
as further research is concern, the model may open
fresh avenues for the researchers, doing research on
employee attrition estimation as well as dealing with
strategies to overcome employee attrition. Validating
and testing the suggested risk mitigation procedure
against other common risk factors occur during
Software development life cycle in an actual setting
is one way to conduct additional.
ACKNOWLEDGEMENTS
I would like to express my special thanks of gratitude
to Dr. Wajahat Abbas Rizvi as well as Dr. Vinodani
Katiyar who helped me to do this wonderful research
work, which also helped me in doing a lot of Research
and I came to know about so many new things I am
really thankful to them.
Secondly I would also like to thank my family and
friends who helped me a lot in finalizing this study
within the limited time frame.
REFERENCES
H Shihadeh, T. (2014). Risk Factors in Software
Development Phases. European Scientific Journal, 10,
213–231.
Raza, A. (2022). Predicting Employee Attrition Using
Machine Learning Approaches. Applied Sciences,
12(13).
Banerjee, A. (2017). A Study on the Factors Influencing the
Rate of Attrition in IT Sector Based on Indian Scenario.
Pacific Business Review International, 9, 10–19.
Satpal, S., & Dhillon, M. (2019). Impact of Factors
Affecting Employee Retention on Attrition Intentions:
In Indian IT Sector. International Journal on Emerging
Technologies, 10(4), 273–282.
Mamtani, D., & Malukani, B. (2023). Predictive Model for
Employee Attrition Risk Assessment. European
Economic Letters (EEL), 13(1s), 358–364.
Fuzzy Based Model for Mitigating Employee Attrition
115

Yadav, H. B., & Yadav, D. K. (2015). A Fuzzy Logic Based
Approach for Phase- Wise Soft-Ware Defects
Prediction Using Software Metrics. Information and
Software Technology, 63, 44–57.
Nikmanesh, M. (2023). Employee Productivity Assessment
Using Fuzzy Inference System. Employee Productivity
Assessment Using Fuzzy Inference System. Information,
14.
Ahmed, I. (2013). Employee Performance Evaluation: A
Fuzzy Approach. International Journal of Productivity
and Performance Management, 62, 718–734.
Sharma, M. K. (2022). Employee Retention and Attrition
Analysis: A Novel Approach On Attrition Prediction
Using Fuzzy Inference and Ensemble Machine
Learning. Webology, (2).
Urs, N. S. (2014). Exploring the Dynamics of Job
Satisfaction and Employee Engagement in IT/ITes
Industries. Journal of Applied Management and
Investments, 3(1).
Kannan, M., & Vivekanandan, K. (2012). Study on Attrition
among New Entrants in Soft-Ware Testing
Professionals.
Demirel, Z., & Çubukçu, C. (2021). Measurement of
Employees on Human Resources with Fuzzy Logic.
EMAJ: Emerging Markets Journal, 11, 1–7.
Gupta, Santosh & Bhatia, Dr. Nitesh. (2023). A Decade of
Trend in the Employee Turnover Intention Study in
India: A Systematic Review and Recommendation.
FIIB Business Review. 10.1177/23197145231158907.
Bukohwo, E. M. (2015). Risk Model for Software
Development Personnel. Proceedings of the
International Multi Conference of Engineers and
Computer Scientists, 1.
Jiang, R. (2015). A Novel Risk Metric for Staff Turnover in
a Software Project Based on Information Entropy.
Software Project Based on Information Entropy:
Entropy, 17, 2834–2852.
Díaz, G. (2023). Analysing Employee Attrition Using
Explainable AI for Strategic HR Decision-Making.
Mathematics, 11.
Gupta, S. K. (2022). A Review of Employee Attrition
Models and Their Role in Evolution of Attrition
Literature. The Indian Journal of Labour Economics,
65(1), 185–214.
Govindaraju, N. (2018). Addressing Employee Turnover
Problem: A Review of Employee Turnover Core
Models. International Journal of Innovative Science
and Research Technology, 11, 516–527.
Srivastava, P. R., & Eachempati, P. (2021). Intelligent
Employee Retention System for Attrition Rate Analysis
and Churn Prediction: An Ensemble Machine Learning
and Multi-Criteria Decision-Making Approach.
Journal of Global Information Management (JGIM),
29(6), 1–29.
El-Rayes, N. (2020). Predicting Employee Attrition Using
Tree-Based Models. International Journal of
Organizational Analysis, 28(6), 1273–1291.
Priambodo, Bagus & Jumaryadi, Yuwan & Rahayu,
Sarwati & Ani, Nur & Ratnasari, Anita & Salamah,
Umniy & Putra, Zico & Otong, Muhamad. (2022).
Predicting Employee Turnover in IT Industries using
Correlation and Chi-Square Visualization. International
Journal of Advanced Computer Science and
Applications. 13. 10.14569/IJACSA.2022.0131210.
Wardhani, F. H., & Lhaksmana, K. M. (2022). Predicting
Employee Attrition Using Logistic Regression with
Feature Selection. Sinkron: Jurnal Dan Penelitian
Teknik Informatika, 6, 2214–2222.
Priya, V. K., & Harasudha, H. H. (2017). A Study on
Employee Attrition with Reference to Lanson Toyoya,
Chennai. Chennai. Man in India, 97, 115–124.
Udechukwu, I. I., & Mujtaba, B. G. (2007). Determining
the Probability That an Employee Will Stay or Leave
the Organization: A Mathematical and Theoretical
Model for Organizations. Human Resource
Development Review, 6(2), 164–184.
Eyupoglu, S. Z. (2017). Job Satisfaction: An Evaluation
Using a Fuzzy Approach. Procedia Computer Science,
120, 691–698.
Thirupathy, A., & Dhayalan, C. (2016). Employee
Retention and Turnover Using Motivational Variables
at India. Int. J. Res. Granthaalayah, 4(8), 1–9.
Purohit, M. (2016). A Study On-Employee Attrition in IT
Sector with Special Emphasis on Wipro and Infosys.
IOSR Journal of Business and Management, 18(4), 47–
51.
Singh, R., & Satpal, M. (2018). Factors Affecting
Employee Retention in Indian IT Sector.
Abhyankar, A. (2021).: Indian IT Industry: High Attrition
Rates and Employee Retention Strategies. Webology,
Vol 18, No.1, 2023-2029
Teotia, S. (2023). Factors Affecting Employee Retention:
An Analysis of It Sector in Delhi-NCR (pp. 94–98).
Noble Science Press.
Harikumar Pallathadka, V. H. (2022). Attrition in Software
Companies: Reason and Measures. Materials Today:
Proceedings, 51, 528–531.
Saraf, V., & Peshave, D. M. A. (2020). An Analysis on
Employee-Attrition in IT Industry. Mukt Shabd
Journal.
Rusi, X., & Viollet, B. (2023). Factors Affecting Employee
Attrition: A Systematic Literature Review. Economic
Restructuring for Sustainable Development.
Singh, K., & Singh, R. (2019). A Study on Employee
Attrition: Effects and Causes. International Journal of
Research in Engineering, 2(8), 2581–5792.
David, S. (2015). Attrition in IT Sector. International
Journal of Core Engineering and Management
(IJCEM), 2(1), 74–92.
Kermani, A. G. (2021). Human Resource Risk
Management Framework and Factors Influencing IT.
Propósitos y Representac-Iones, 9.
Popescu, S. (2020). A Structured Framework for
Identifying Risks Sources Related to Human Resources
in a 4.0 Working Environment Perspective. 511–527.
Chauhan, V. S., & Patel, D. (2013). Employee Attrition: A
Factorial Study of IT Industry. Journal of Strategic
Human Resource Management, 2(1).
FEMIB 2025 - 7th International Conference on Finance, Economics, Management and IT Business
116

Saher, N. (2015). The Impact of Employees Attrition at the
Productivity of a Software. International Journal of
Natural and Engineering Science, 9(3), 23–37.
Rizvi, S. W. A., Singh, V. K., & Khan, R. A. (2017). Early
stage software reliability modeling using requirements
and object-oriented design metrics: fuzzy logic
perspective. International journal of computer
applications, 162(2), 44-59.
Patil, R. S. (2011). Human Resource Challenges &
Practices in IT Industry. In Proceedings of the 5th
National Conference (pp. 10–11).
Prasad, A., & Kamalanabhan, P. (2010). Human Resource
Excellence in Software Industry in India: An
Exploratory Study. International Journal of Logistics
Economics and Globalization, 2(4), 316–330.
Flouris, T., & Yilmaz, A. K. (2010). The Risk Management
Framework to Strategic Human Re-Source
Management. International Research Journal of
Finance and Economics, 36(1), 25–45.
Alqahtani, Haya & Almagrabi, Hana & Alharbi, Amal.
(2024). Employee Attrition Prediction using Machine
Learning Models: A Review Paper. International
Journal of Artificial Intelligence & Applications. 15.
23-49. 10.5121/ijaia.2024.15202.
George, S. (n.d.). Predicting Employee Attrition Using
Machine Learning Algorithms. 2022 4th International
Conference on Advances in Computing,
Communication Control and Networking (ICAC3N).
Almohammadi, K. (2024). Adaptive Type-1 Fuzzy Logic-
Based System for Predicting Em-Ployee Attrition.
International Journal of Intelligent Systems and
Applications in Engi-Neering, 12(21s).
Shete, M. (2021). Prediction of Employee Attrition Using
Machine Learning Approach. Inter-National Journal for
Research in Applied Science and Engineering
Technology, (9).
Bormah, A., Taylan, O. Productivity Forecasting of
Employees Performance Using Machine Learning and
Adaptive Neuro-Fuzzy Inference System. International
Journal of Science, Engineering and Technology. 11.
Arslankaya, Seher. (2023). Comparison of performances of
fuzzy logic and adaptive neuro-fuzzy inference system
(ANFIS) for estimating employee labor loss. Journal of
Engineering Research. 11. 100107.
10.1016/j.jer.2023.100107.
Hasib, N., Rizvi, S. W. A., & Katiyar, V. (2023). Artificial
Immune System: A Systematic Literature Review.
Journal of Theoretical and Applied Information
Technology, 101(4), 1469–1486.
Hasib, Nida, Rizvi, S. W. A., & Katiyar, V. (2024).
Conceptual framework for risk mitigation and
monitoring in software organizations based on artificial
immune system. In Lecture Notes in Networks and
Systems. Lecture Notes in Networks and Systems (pp.
25–37). doi:10.1007/978-981-97-7423-4_3
Hasib, N., Rizvi, S. W. A., & Katiyar, V. (2023). Biological
immune system based risk mitigation monitoring
system: An analogy. International Conference on
Artificial Intelligence, Blockchain, Computing and
Security ICABCS 2023, Volume 1 (pp. 760-767). CRC
Press. DOI.10.1201/9781003393580-113.
Hasib, N., Rizvi, S. W. A., & Katiyar, V. (2023). Risk
Mitigation and Monitoring Challenges in Software
Organizations: A Morphological Analysis.
International Journal on Recent and Innovation Trends
in Computing and Communication, 11(8), 172–185.
https://doi.org/10.17762/ijritcc.v11i8.7943.
Hasib, N., Rizvi, S. W. A., & Katiyar, V. (2025). A Review
of Risk Factors Affecting Employee Attrition in IT
Sector. 5th International Conference on Paradigms of
Communication, Computing and Data Analytics
(PCCDA 2025), 18 Jan – 20 Jan, Pt. Lalit Mohan
Sharma Campus, Rishikesh, Sri Dev Suman
Uttarakhand University, Uttarakhand, India. (Accepted
and preseted)(Unpublished).
APPENDIX
The questionnaires used for conducting the
qualitative exploratory study and quantitative
descriptive study are listed in this section.
Appendix A1 Qualitative Exploratory Study(In-depth
Interviews/Work Document)
Appendix A2
Appendix B1
Appendix B2
Part I
Part II
Quantitative Descriptive Survey -Risk Factor
Ranking
Pre-Intervention Questionnaire for
Validation of Employee Attrition Mitigation
Framework in Software Development
Projects during SDLC
Post Intervention Questionnaire for
Validation of Employee Attrition Mitigation
Framework in Software Development
Projects during SDLC
1) Outcome Assessment of the Framework
in Terms of Predicted Value
2) Qualitative Reviews
Fuzzy Based Model for Mitigating Employee Attrition
117
