
Robust & Reliable Automated Feedback Using Tree Edit Distance for
Solving Open Response Mathematical Questions
Malte Neugebauer
1 a
, Sabrina Falk
1 b
, Ralf Erlebach
2 c
, Saburo Higuchi
3 d
and Yasuyuki Nakamura
4 e
1
Westf
¨
alische Hochschule University of Applied Sciences, 45897 Gelsenkirchen, Germany
2
University of Wuppertal, 42119 Wuppertal, Germany
3
Ryukoku University, 520-2194 Otsu, Japan
4
Nagoya University, 464-8601 Nagoya, Japan
Keywords:
Tree Edit Distance, Feedback, Higher Education, Mathematics, A/B Testing, Self-Regulated Learning.
Abstract:
As the student population becomes increasingly heterogeneous, providing effective feedback is crucial for
personalized education. However, human feedback is resource-intensive, while large language models can be
unreliable. Our method bridges this gap by offering informative, similarity-based feedback on mathematical
inputs. In an experiment with 207 students, we found that this approach encourages engagement, facilitates
the completion of harder exercises, and reduces quitting after incorrect inputs. Compared to traditional feed-
back mechanisms that struggle with unforeseen error patterns, our method increases student perseverance and
confidence. By balancing reliability, resources, and robustness, our solution meets the diverse needs of con-
temporary students. With its potential to enhance self-learning and student outcomes, this research contributes
to the growing conversation on personalized education and adaptive learning systems.
1 INTRODUCTION
Formative feedback plays a crucial role in success-
ful learning processes in general (Hattie and Timper-
ley, 2007; Shute, 2008; Van der Kleij et al., 2015;
Wisniewski et al., 2020) as well as for the subject of
mathematics (S
¨
oderstr
¨
om and Palm, 2024). While the
ongoing research in the field is still working towards
conclusive and coherent findings, there is a widely
shared consensus that well-designed formative feed-
back effectively enhances student performance (Hat-
tie and Timperley, 2007; Mandouit and Hattie, 2023;
Kluger and DeNisi, 1996; Narciss, 2004; Narciss,
2006; Narciss, 2017), and that effective feedback has
to consist of more than just the information of correct-
ness or falsehood (Wisniewski et al., 2020; Bangert-
Drowns et al., 1991; Pridemore and Klein, 1995).
Ideally, formative feedback should address the causes
a
https://orcid.org/0000-0002-1565-8222
b
https://orcid.org/0009-0002-2737-9172
c
https://orcid.org/0000-0002-6601-3184
d
https://orcid.org/0000-0003-3004-711X
e
https://orcid.org/0000-0001-7280-6335
and misconceptions that led to an incorrect solution
attempt and how to overcome these challenges (Wis-
niewski et al., 2020). While trained human mathemat-
ics instructors can provide highly elaborated feedback
that reflects the cognitive processes involved, auto-
mated feedback systems are still lacking a deep un-
derstanding of the underlying cognitive processes.
As a result, systems based on Large Language
Models (LLM) (Tonga et al., 2024; Lan et al., 2015)
tend to provide unreliable or inconsistent feedback
due to their dependence on mathematical training data
(Lai et al., 2024; Liu et al., 2023), while feedback
systems based on Computer Algebra Systems (CAS)
(Sangwin, 2015; Barana et al., 2019; Beevers et al.,
1989) reliably provide effective feedback.
There are two ways for an instructor to achieve
this: Either, the instructor anticipates the possible dif-
ficulties faced by their learners for a given exercise
and develops potential answers based on these diffi-
culties. Or the instructor already has access to actual
learners’ responses from previous attempts, which he
analyzes for typical errors and identifies the underly-
ing misconceptions. In either case, the instructor sub-
618
Neugebauer, M., Falk, S., Erlebach, R., Higuchi, S. and Nakamura, Y.
Robust & Reliable Automated Feedback Using Tree Edit Distance for Solving Open Response Mathematical Questions.
DOI: 10.5220/0013464900003932
In Proceedings of the 17th International Conference on Computer Supported Education (CSEDU 2025) - Volume 2, pages 618-626
ISBN: 978-989-758-746-7; ISSN: 2184-5026
Copyright © 2025 by Paper published under CC license (CC BY-NC-ND 4.0)

sequently formulates elaborate feedback that directly
addresses these misconceptions.
Advanced CAS-based learning and assessment
systems, such as, e. g., STACK
1
, Onyx
2
, Sowiso
3
,
Grasple
4
or Step-Wise
5
, offer the instructor the possi-
bility of storing this feedback in combination with the
incorrect learner responses or error patterns. Learn-
ers’ responses can be automatically evaluated for
equivalence with those error patterns in accordance
with mathematical conventions and rules by using the
CAS. Upon the results of this automatic evaluation
process, learners are provided with the correspond-
ing feedback containing supportive advice from the
instructor.
However, due to the need of anticipated error pat-
terns, CAS-based approaches struggle to handle edge
cases or unforeseen errors like careless slips or mixed-
up numbers. The construction of valid evaluation pro-
cesses is tending to be a time-consuming undertaking,
which is often not worthwhile when the tasks at hand
are comparatively simple.
In situations like these, when a faulty answer does
not perfectly match the sample solution or one of
the states defined in the evaluation process, students
are often left with uninformative messages like “In-
correct”. For such cases, a less strict comparison
would be desirable, capable of recognizing an “al-
most right”. There are algorithms such as the Leven-
shtein distance (Levenshtein, 1966) that calculate the
degree of similarity between two strings, even if they
do not match character-by-character. However, these
algorithms do not consider the semantic structure of
mathematical expressions and therefore yield unreli-
able results when applied to formulae and numbers.
In order to provide students in such cases with
elaborated feedback as well, we employ an approach
that utilizes the Tree Edit Distance (TED) algorithm.
This allows us to make comparisons of slightly differ-
ent mathematical expressions. The following section
describes how this algorithm has been used in educa-
tion so far.
2 RELATED WORK
The idea that a mathematical expression is repre-
sented by a tree is not new. This concept has been
explored in various fields, including abstract algebra
and symbolic computation. It has also been applied
1
https://stack-assessment.org/
2
https://www.bps-system.de/onyx-pruefungsplattform/
3
https://www.sowiso.com/
4
https://www.grasple.com/
5
https://step-wise.com/
for educational purposes. For example, Bevilacqua
et al. (2024) examined students’ understanding of this
correspondence by collecting and analyzing expres-
sion trees hand-drawn by students. They argued that
mistakes in the drawing are a good representation of
the students’ misconceptions about how a computer
works.
Other researchers have also investigated the uti-
lization of tree structures for programming education,
such as the Abstract Syntax Tree (AST) of a program,
which encodes its control structure and can be used to
analyze programs written by students (Freire-Mor
´
an,
2023). Similarity among codes can be measured by
comparing ASTs, discarding details such as variable
names or indentation style.
Additionally, distances between computer pro-
grams have been used for automated grading (Wang
et al., 2007; Rahaman and Hoque, 2022).
Recently, researchers have also applied similar
concepts to mathematical education. For instance,
Takada et al. (2024) collected students’ answers to a
mathematics question and grouped them by their dis-
tance to the sample solution, estimated by human ex-
perts. Higuchi and Nakamura (2024) calculated the
distance between various students’ inputs using sub-
tree kernels and Tree Edit Distance, and visualized the
results on a two-dimensional plane to allow educators
an overview of what mistakes students make and ad-
just their teaching to common misconceptions. These
studies demonstrate the potential of measuring sim-
ilarity and distance in mathematical solutions. How-
ever, they have not yet been exploited for giving direct
feedback to students and often rely on human subjec-
tivity.
Summing up, we have seen that measuring the
similarity or distance between two solutions, which
can be expressed in the form of hierarchical tree struc-
tures, has been successfully established as common
practice in fields other than mathematics. Also, there
have been recent efforts to measure similarity and
distance in mathematical solutions, albeit by human
judgement.
So, how can the similarity of two mathematical
expressions objectively be measured in order to pro-
vide effective feedback? In the following section, we
will present the idea of the TED algorithm and de-
scribe how the degree of distance is operationalized
in relation to feedback.
3 THEORETICAL BACKGROUND
The general idea of measuring the degree of similar-
ity or distance for two given strings of characters is
Robust & Reliable Automated Feedback Using Tree Edit Distance for Solving Open Response Mathematical Questions
619

Figure 1: Representations of the mathematical expressions 1 to 4 as structured trees (Akutsu et al., 2021, p. 3).
by counting the minimal number of single edit oper-
ations – insertion, deletion, and substitution of char-
acters – to transform one string into the other (Lev-
enshtein, 1966). This idea has been generalized for
trees by Tai (1979) and operationalized as an efficient
algorithm (Zhang and Shasha, 1989). This algorithm
is commonly known as Tree Edit Distance (TED).
To our knowledge the TED has not been widely
used in mathematics education yet. However, Akutsu
and collaborators discuss the TED between mathe-
matical formulas up to variable renaming and its com-
putational complexity (Akutsu et al., 2021).
Consider the following four mathematical expres-
sions:
(x + y) × z (1)
(x + z) × y (2)
z × (x + y) (3)
(x + y) × x (4)
Obviously, expressions one and three are identical,
while expressions two and four are not. However,
when represented in an (ordered) tree structure, each
one of the trees T
2
...T
4
needs at least two edit op-
erations to be transformed into tree T
1
, yielding a
T ED(T
1
,T
2...4
) of 2. Therefore, if you want to com-
pare mathematical expressions while preserving the
commutative, associative, and distributive laws, their
expression tree representations must first be canoni-
calized.
Consider a sample solution S and a user’s input
U. Denote the canonicalized expression tree repre-
sentations as T
S
and T
U
, respectively. We define the
absolute tree edit distance T ED
abs
as the number of
steps (edit operations) needed to turn the user’s input
into the sample solution:
T ED
abs
= T ED(T
U
,T
S
) (5)
As a means for formative feedback, a low value of
T ED
abs
informs students that their solution attempt is
already close to the sample solution, while high val-
ues indicate a large distance and therefore being on
the wrong track.
However, the absolute value of the number of edit
operations required does not take into account the
complexity of the mathematical sample solution and
therefore the effort required by the students. To ac-
count for this, we define the relative tree edit distance
T ED
rel
as follows:
T ED
rel
= max
1 −
T ED
abs
|T
S
|
,0
(6)
Here |T
S
| denotes the total amount of nodes of T
S
,
which equals the number of steps needed to entirely
build up the sample solution’s canonicalized expres-
sion tree. It therefore reflects the complexity of the
sample solution. According to this definition, T ED
rel
will yield values between 0 and 1, which may be com-
municated as a percentage of similarity between U
and S.
So, while T ED
abs
tells the student how many steps
have to be done in order to “hit” the sample solution,
the relative similarity T ED
rel
states to what extent
the learner’s input matches the sample solution. As
the interpretations of both measures differ from each
other, each of them is considered as a potential source
of helpful information for students and thus incorpo-
rated into the experiment.
To test the TED as a source of feedback informa-
tion, in case of an unidentified incorrect answer, we
use feedback in one of the following forms:
(a) Based on distance: “Incorrect. {TED
abs
} things
need to be changed.”
(b) Based on similarity: “Incorrect. Your input
matches the solution by {T ED
rel
· 100}%.”
(c) Plain automated standard feedback: “Incorrect”
(without any further information).
In comparison to the automated standard feed-
back (option c), what kind of impact will there be on
the learning process and its outcomes when enriching
feedback like in option a or b? In order to investigate
this impact we pursue the following research ques-
tions (RQ) in the next section:
• RQ1. What different action patterns emerge from
the implemented additional feedback, based on
the TED?
• RQ2. To what degree does additional feedback
based on the TED help in solving exercises, taking
into account different exercise difficulties?
CSEDU 2025 - 17th International Conference on Computer Supported Education
620

4 EXPERIMENT
The following section describes how this type of feed-
back can be integrated into open mathematical ques-
tions using the learning management system (LMS)
Moodle as an example. Followed by that, the specific
learning material and the research context of a first
test run with 207 students is presented.
4.1 Implementation
The plugin STACK
6
(Sangwin, 2013) for Moodle al-
lows teachers to create open response mathematical
questions and enables access to the CAS Maxima
7
(Li and Racine, 2008) to evaluate student inputs to
questions created therein. This evaluation can be de-
scribed by the following process: After a student sub-
mits an input, the STACK system checks with the help
of Maxima for matches with predefined error patterns.
If so, the related feedback is provided.
Besides this error matching, the direct connec-
tion to the CAS Maxima through STACK in Moodle
allows for using Maxima for further purposes, like
calculating the TED. Maxima is capable of convert-
ing the students’ inputs and the sample solutions into
expression trees and canonicalizing these trees, after
which the TED can be obtained. The CAS’ result is
then used as input for the STACK system’s evaluation
process. In our example, the calculated TED is im-
plemented into the evaluation process only when pre-
viously no other feedback was given. This evaluation
process with the implemented additional TED-based
feedback is demonstrated in Algorithm 1.
For the sake of ease of implementation of calculat-
ing the TED from the generated trees, in our example,
the JavaScript library edit-distance.js is used.
The used code and example questions can be found at
the project’s repository: https://git.new/XGTAlWX.
4.2 Learning Material & Survey
Context
The experiment took place in a two-week online prep-
course in the summer of 2024, just before the start
of a new term at Westf
¨
alische Hochschule Univer-
sity of Applied Sciences. Students participating in
these courses are primarily aged 18-21. Most are
computer science, engineering and economics back-
ground. This preparatory course attempts to ensure
that the knowledge of first-year students in mathe-
matics is in line with the mathematical knowledge re-
6
https://stack-assessment.org
7
https://maxima.sourceforge.io
Algorithm 1: Evaluation process with different kinds of
TED-based feedback depending on a student’s assignment
to an experimental group.
if input matches sample solution then
give feedback correct;
else if input matches error pattern then
give specific feedback;
else
give feedback incorrect;
if T ED
abs
> 0 and |T
S
| > 1 then
switch group do
case TED ABS do
give distance-based feedback;
end
case TED REL do
give similarity-based
feedback;
end
case CONTROL do
no additional feedback;
end
end
end
end
quired for their studies. Diagnostics, video lessons
(about four hours per weekday) and the here pre-
sented set of open response questions are used.
At the start of the course, 207 freshmen students
were randomly assigned to one of three groups la-
beled TED ABS, TED REL and CONTROL, deter-
mining the kind of additional feedback they would
receive on incorrect inputs. The pre-existing level of
mathematical skills among the three groups has been
assessed by a standardized test for German School
Mathematics. Pairwise t-tests did not reveal any sig-
nificant differences between these groups.
On incorrect inputs, students in the TED ABS
group received additional information about their in-
put’s absolute distance (Equation 5) to the sample so-
lution as part of the feedback, as shown in Figure 2a.
Students in the TED REL group received additional
information about their input’s similarity (Equation 6)
to the sample solution, as shown in Figure 2b. Finally,
students in the CONTROL group did not receive any
additional feedback on incorrect inputs (Figure 2c).
For the learning parts of the preparatory course,
a learning environment with a pedagogical agent
(Neugebauer et al., 2024) was used. This particular
system extends Moodle’s default presentation of exer-
cises by a depiction of a fictional tutor on the students’
screen. Based on the STACK feedback, this fictional
tutor is giving instant comments on the learners’ in-
Robust & Reliable Automated Feedback Using Tree Edit Distance for Solving Open Response Mathematical Questions
621

Feedback Based on
Absolute Distance
(TED ABS)
Feedback Based on
Similarity
(TED SIM)
No TED-based Feedback
(CONTROL)
(a) Absolute Distance Feedback.
Feedback Based on
Absolute Distance
(TED ABS)
Feedback Based on
Similarity
(TED SIM)
No TED-based Feedback
(CONTROL)
(b) Similarity-based Feedback.
Feedback Based on
Absolute Distance
(TED ABS)
Feedback Based on
Similarity
(TED SIM)
No TED-based Feedback
(CONTROL)
(c) No TED-based Feedback.
Figure 2: Examples of the tested feedback types after incorrect inputs for an exercise with
a(a+2)+(a−2)a
(a−2)(a+2)
+ 5 as one possible
sample solution. In all examples, the student omits +5. This yields (a) a T ED
abs
of 2 (Equation 5) and (b) a T ED
rel
of 90%
(Equation 6, |T
S
| = 20). Students in the control group (c) don’t receive any additional feedback.
puts in a comic-like speech bubble for every interme-
diate step while they answer the given question (rather
than just only after the submission of their solutions).
The topics covered were (i) fractions, (ii) term
transformation, (iii) powers, roots and logarithms,
(iv) linear and quadratic equations, (v) linear sys-
tems of equations, (vi) functions and (vii) derivations.
Overall, the exercise set comprises 146 open response
mathematical questions of the STACK type with three
to four randomized variants for each exercise.
5 RESULTS
The 207 students trained with the exercises, which re-
sulted in 12 025 question attempts with in total 40231
inputs. For further analysis, only those question at-
tempts from this data set are considered, that are re-
lated to TED-based feedback. Therefore, for the ex-
perimental groups TED ABS & TED REL, only those
question attempts are included in which TED-based
feedback was given at least once. The CONTROL
group did not receive any TED-based feedback, but
those question attempts of the CONTROL group are
included, in which at least once a TED-based feed-
back would have been triggered. Thus, the origi-
nal dataset is reduced to 4 656 question attempts with
25047 inputs.
To analyze the results according to different dif-
ficulty levels, the exercises have been classified by
their difficulty into four levels of equal size. As a
measure of difficulty the overall proportion of being
solved correctly has been used.
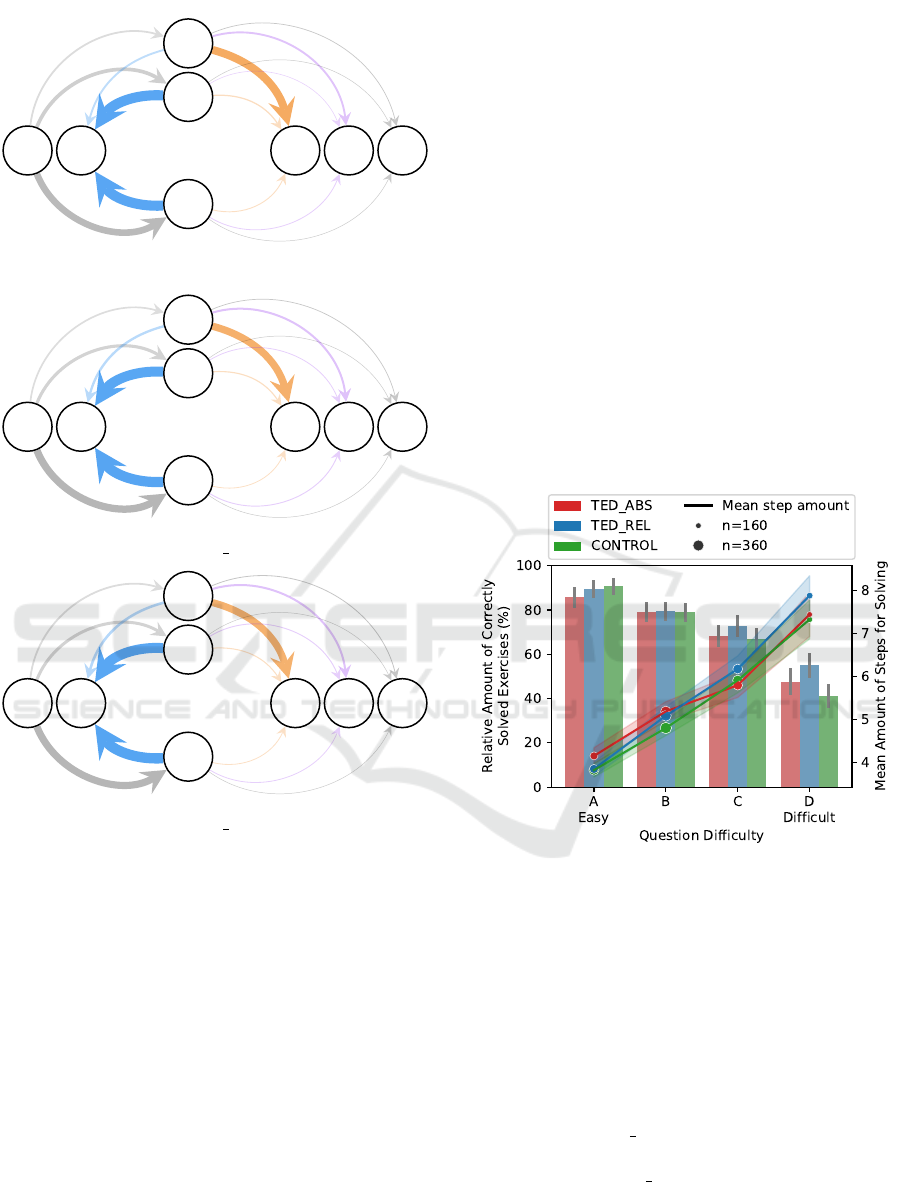
To evaluate RQ1 (What different action patterns
emerge from additional feedback based on TED?)
a Markov chain-based model analysis, proposed by
Neugebauer et al. (2024), is used. This analysis visu-
alizes transitions between states of solving exercises
within the learning environment. It shows the over-
all transition distribution (T) to the states correct (c),
partially correct (p) and wrong (w) as well as the
probabilities that, originating from these states, the
next transition will be of a sequential type (S), a non-
sequential type (N), a repetition (R) or the final finish
move (F). Detailed instructions on how to understand
and implement the model can be found in the orig-
inal reference (Neugebauer et al., 2024). Exercise
attempts of the two easiest quartiles have not been
considered into the probability calculation, to avoid
the large amount of correctly solved easy questions
skewing the results (also known as the ceiling effect
(
ˇ
Simkovic and Tr
¨
auble, 2019)). The resulting graphs
for the control group compared to both experimental
groups are shown in Figure 3.
For each transition type, two-sided t-tests were
calculated to determine significant differences (p <
.05) between users in the control group and users in
the experimental groups. The effect size is explicated
as Cohen’s d according to Cohen (1988).
Although both experimental feedback additions
are based on the TED, different action patterns
emerge from their implementation. Students in the
TED ABS group (Figure 3b) show no significant dif-
ferences except for the fact that they stop less of-
ten after incorrect inputs (transition from (w) to (F),
d = −.459). It is reasonable to assume that the in-
formation about a concrete number of steps that have
to be taken encourages the students to stay on track.
This aligns with a slightly higher repetition rate after
incorrect inputs (transition from (w) to (R)).
In contrast to this, the following significant dif-
ferences could be identified for the TED REL group
(Figure 3c):
CSEDU 2025 - 17th International Conference on Computer Supported Education
622
T R
c
p
w
S N F
.13
.30
.57
.14 .69 .14 .03
.89 .08 .02 .01
.89 .05 .04 .015
(a) CONTROL.
T R
c
p
w
S N F
.12
.25
.63
.18 .63 .15 .03
.88 .07 .04 .01
.90 .04 .05
.008
*
(b) TED ABS.
T R
c
p
w
S N F
.13
.24
.62
.20
*
.61
*
.15 .04
.88 .06 .05 .01
.91
*
.04 .04 .009
(c) TED REL.
Figure 3: Transitions in the learning material visualized as
Markov chains as proposed by Neugebauer et al. (2024).
From T (exercise try, grey left): distribution of correct
(c) / partially correct (p) / wrong (w) answers. To S (sequen-
tial, orange): advancing to the next sequential task. To R
(repeat, blue): repeating an exercise. To N (new, violet):
jumping to a different (out-of-order) exercise. To F (finish,
grey right): ending the session. Asterisks denote significant
deviations from the control group (p < .05). Only question
attempts where at least once a TED-based feedback was
triggered (experimental groups) or would have been trig-
gered (control group) are considered.
• Users in this group repeat their attempts to solve
the exercises after an incorrect input significantly
more frequently (transition probability from (w)
to (R), d = .373).
• Already successfully solved exercises are re-
peated more often (transition probability from (c)
to (R), d = .405) and, as a consequence, users in
this group proceed significantly less often to the
sequentially next exercise (transition probability
from (c) to (S), d = −.428) compared to the con-
trol group.
Obviously, the additional feedback based on
T ED
rel
motivates students not only to correct their
mistake after incorrect inputs, but also to practice al-
ready solved exercises more often, instead of proceed-
ing through the set of exercises by the recommended
order.
For tackling RQ2 (To what degree does additional
feedback based on the TED help in solving exercises,
taking into account different exercise difficulties?) the
average proportion of successfully solved exercises
of each difficulty quartile has been calculated, for
each feedback group. Furthermore, we determined
the mean and the standard deviation of the number
of steps taken for each feedback group and for each
difficulty quartile.
Figure 4: Relative amount of correctly solved exercises by
questions’ difficulty (ranging from A (easy) to D (difficult)).
Black lines denote the standard error. The colored lines de-
note the mean amount of steps students take to solve exer-
cises with given difficulty. The shadows around them indi-
cate the standard error. Circles denote the amount of solv-
ing processes that were included in the calculation of the
mean value. Only question attempts where at least once a
TED-based feedback was triggered (experimental groups)
or would have been triggered (control group) are consid-
ered.
As shown in Figure 4, the solving probabilities
of the groups TED ABS and CONTROL are similar
throughout the difficulty levels. In contrast to this,
students in the TED REL group have significantly
higher solving probabilities for difficulty level D (d =
.424, p = .019). Additionally, for this group the solv-
ing probabilities of C are also slightly higher. How-
Robust & Reliable Automated Feedback Using Tree Edit Distance for Solving Open Response Mathematical Questions
623

ever, this latter difference is not significant (p > .05).
Furthermore, students in the TED REL group tend
to take more steps to solve exercises. However, this
difference is not significant (p > .05).
Overall, the results indicate that learners that re-
ceive feedback in the form of a similarity-based score
with respect to the sample solution have a higher solv-
ing probability when exercises become (more) chal-
lenging and tend to engage more with the learning
material.
6 DISCUSSION & LIMITATIONS
In this contribution we report on the implementa-
tion and the effects of adding the TED algorithm to
automated feedback and found a readily applicable
method for improving learning without individual hu-
man interaction. Results indicate positive effects of
the TED-enhanced feedback for the TED REL group
on students’ behavior as well as on their solution
probabilities.
While the only measured effect in the TED ABS
group is a lower probability of stopping practicing af-
ter an incorrect input, students in the TED REL group
repeat exercises more often and have higher solving
probabilities for difficult exercises compared to their
classmates in the CONTROL group.
It is important to note that the significant effects
measured only take place for more difficult exercises.
This applies to both investigated measures, namely
for the transition effects (RQ1, quartiles C and D) as
well as for the solving probability (RQ2, quartile D
only). Questions of difficulty quartiles A and B are
sufficiently easy for learners that differences in feed-
back are not as important. This finding is also in line
with the feedback literature (Narciss and Zumbach,
2022) and shifts the focus to the interplay between (a)
item difficulty, (b) personal ability and (c) learning
outcome in relation to the type of feedback.
While the more frequent repetition of students in
the group TED REL can be explained by the imple-
mentation of additional feedback, the cause for the
more frequent repetition after correct inputs is an
open question. Obviously, students in the TED REL
group tend to practice exercises more intensely by re-
peating them with different numbers or are testing
different forms of their input for matching with the
sample solution for the sake of curiosity. One could
also hypothesize that students perceive the feedback
as a kind of demotion, that they want to overcome
with another try, which is free of penalties. Although
it is already known that students tend to do familiar
tasks for enhancing their motivation (Macaluso et al.,
2022), this does not explain the differences between
the TED ABS, TED REL and CONTROL groups. Po-
tentially, the similarity-based feedback emphasizes
the desire for gaining a 100% correct answer, which
contributes to higher engagement with familiar exer-
cises, as described by the “misinterpreted-effort hy-
pothesis” (Kirk-Johnson et al., 2019).
Unexpectedly, a higher repetition rate was not
measured for students in the TED ABS group. As
the distance-based feedback is not self-explanatory,
students potentially struggle to understand what a
distance of (for instance) 2 means. In contrast to
this, the similarity-based feedback that students in
the TED REL group received may appear much more
clear to learners with regard to their progress, which
might be the reason for the result found.
Considering these uncertainties, we suggest future
research to enhance the current research setting for
qualitative methods, e.g., student surveys or think-
aloud protocols during using the system. This could
shed more light on the causes for the differences
among the groups. To further address the interplay
between difficulty, ability and learning outcome, in
addition to qualitative methods, diagnostics should be
established that bring these measures into play, e.g.,
by applying pre-, post-, and delayed-post-testing.
A further limitation of the presented project is the
specific context: It was a preparatory course with
mathematical contents that students should have al-
ready been familiar with from school. Therefore, they
did not learn anything fundamentally new, but solely
reactivated their knowledge. Hence, a future inves-
tigation involving the question of what effects the
feedback types have when learning new mathemati-
cal contents, for example in advanced higher educa-
tion mathematics, is suggested.
7 CONCLUSIONS
This work presented a method for giving additional
feedback on students’ incorrect inputs to open re-
sponse mathematical questions when traditional feed-
back systems reach their limits. In an experiment
it was shown that this kind of feedback is capable
of facilitating learners’ engagement with the learn-
ing material by encouraging them to undertake more
steps when solving harder exercises. Although fur-
ther research is necessary to verify the same effects
in other contexts, the present results already allow to
suggest this method for being applied into open re-
sponse mathematical questions.
CSEDU 2025 - 17th International Conference on Computer Supported Education
624

ACKNOWLEDGEMENTS
The authors express their sincere gratitude to Hildo
Bijl, University of Eindhoven, for proofreading,
and critical comments. From the Westf
¨
alische
Hochschule University of Applied Sciences, the au-
thors give thanks to Nadine Schaefer for her didac-
tic expertise and to all tutors for their practical sup-
port during the prep-courses, without which this study
would not have been possible.
REFERENCES
Akutsu, T., Mori, T., Nakamura, N., Kozawa, S., Ueno, Y.,
and Sato, T. N. (2021). Tree edit distance with vari-
ables. measuring the similarity between mathematical
formulas.
Bangert-Drowns, R. L., Kulik, C.-L. C., Kulik, J. A., and
Morgan, M. (1991). The instructional effect of feed-
back in test-like events. Review of Educational Re-
search, 61(2):213–238.
Barana, A., Marchisio, M., and Sacchet, M. (2019). Advan-
tages of Using Automatic Formative Assessment for
Learning Mathematics, pages 180–198. Springer In-
ternational Publishing.
Beevers, C. E., Cherry, B. S. G., Clark, D. E. R., Foster,
M. G., McGuire, G. R., and Renshaw, J. H. (1989).
Software tools for computer-aided learning in mathe-
matics. International Journal of Mathematical Edu-
cation in Science and Technology, 20(4):561–569.
Bevilacqua, J., Chiodini, L., Moreno Santos, I., and
Hauswirth, M. (2024). Assessing the understanding of
expressions: A qualitative study of notional-machine-
based exam questions. In Proceedings of the 24th Koli
Calling International Conference on Computing Ed-
ucation Research, Koli Calling ’24, New York, NY,
USA. Association for Computing Machinery.
Cohen, J. (1988). Statistical Power Analysis for the Behav-
ioral Sciences. Routledge.
Freire-Mor
´
an, M. (2023). Combining similarity metrics
with abstract syntax trees to gain insights into how
students program. LASI-SPAIN.
Hattie, J. and Timperley, H. (2007). The power of feedback.
Review of Educational Research, 77(1):81–112.
Higuchi, S. and Nakamura, Y. (2024). Classification of
answers in math online tests by visualizing graph
similarity. Companion Proceedings 14th Interna-
tional Conference on LearningAnalytics & Knowl-
edge (LAK24), pages 197–199.
Kirk-Johnson, A., Galla, B. M., and Fraundorf, S. H.
(2019). Perceiving effort as poor learning: The
misinterpreted-effort hypothesis of how experienced
effort and perceived learning relate to study strategy
choice. Cognitive Psychology, 115:101237.
Kluger, A. N. and DeNisi, A. (1996). The effects of
feedback interventions on performance: A histori-
cal review, a meta-analysis, and a preliminary feed-
back intervention theory. Psychological Bulletin,
119(2):254–284.
Lai, H., Wang, B., Liu, J., He, F., Zhang, C., Liu, H., and
Chen, H. (2024). Solving mathematical problems us-
ing large language models: A survey. Available at
SSRN.
Lan, A. S., Vats, D., Waters, A. E., and Baraniuk, R. G.
(2015). Mathematical language processing: Auto-
matic grading and feedback for open response math-
ematical questions. In Proceedings of the Second
(2015) ACM Conference on Learning @ Scale, L@S
2015, pages 167–176. ACM.
Levenshtein, V. I. (1966). Binary codes capable of correct-
ing deletions, insertions, and reversals. Soviet Physics
Doklady, 10(8):707–710.
Li, J. and Racine, J. S. (2008). Maxima: An open source
computer algebra system. Journal of Applied Econo-
metrics, 23(4):515–523.
Liu, W., Hu, H., Zhou, J., Ding, Y., Li, J., Zeng, J., He,
M., Chen, Q., Jiang, B., Zhou, A., and He, L. (2023).
Mathematical language models: A survey.
Macaluso, J. A., Beuford, R. R., and Fraundorf, S. H.
(2022). Familiar strategies feel fluent: The role of
study strategy familiarity in the misinterpreted-effort
model of self-regulated learning. Journal of Intelli-
gence, 10(4):83.
Mandouit, L. and Hattie, J. (2023). Revisiting “the power of
feedback” from the perspective of the learner. Learn-
ing and Instruction, 84:101718.
Narciss, S. (2004). The impact of informative tutoring
feedback and self-efficacy on motivation and achieve-
ment in concept learning. Experimental Psychology,
51(3):214–228.
Narciss, S. (2006). Informatives tutorielles Feedback:
Entwicklungs- und Evaluationsprinzipien auf der Ba-
sis instruktionspsychologischer Erkenntnisse. Wax-
mann.
Narciss, S. (2017). Conditions and effects of feedback
viewed through the lens of the interactive tutoring
feedback model. In Carless, D., Bridges, S. M., Chan,
C. K., and Glofcheski, R., editors, Scaling up assess-
ment for learning in higher education, pages 173–189.
Springer.
Narciss, S. and Zumbach, J. (2022). Formative Assessment
and Feedback Strategies, pages 1–28. Springer Inter-
national Publishing.
Neugebauer, M., Erlebach, R., Kaufmann, C., Mohr, J., and
Frochte, J. (2024). Efficient learning processes by
design: Analysis of usage patterns in differently de-
signed digital self-learning environments. In Proceed-
ings of the 16th International Conference on Com-
puter Supported Education. SCITEPRESS - Science
and Technology Publications.
Pridemore, D. R. and Klein, J. D. (1995). Control of
practice and level of feedback in computer-based in-
struction. Contemporary Educational Psychology,
20(4):444–450.
Rahaman, M. A. and Hoque, A. S. M. L. (2022). An effec-
tive evaluation system to grade programming assign-
Robust & Reliable Automated Feedback Using Tree Edit Distance for Solving Open Response Mathematical Questions
625

ments automatically. International Journal of Learn-
ing Technology, 17(3):267–290.
Sangwin, C. (2013). Computer aided assessment of mathe-
matics. OUP Oxford.
Sangwin, C. (2015). Computer Aided Assessment of Math-
ematics Using STACK, pages 695–713. Springer In-
ternational Publishing.
Shute, V. J. (2008). Focus on formative feedback. Review
of Educational Research, 78(1):153–189.
S
¨
oderstr
¨
om, S. and Palm, T. (2024). Feedback in mathemat-
ics education research: a systematic literature review.
Research in Mathematics Education, pages 1–22.
Tai, K.-C. (1979). The tree-to-tree correction problem. J.
ACM, 26(3):422–433.
Takada, T., Kawazoe, M., Higuchi, S., Miyazaki, Y., Yoshit-
omi, K., Nakahara, T., and Nakamura, Y. (2024).
Three-dimensional visualization and analysis of an-
swer transition in mathematics online tests. In Ab-
stract of the 15th International Congress on Mathe-
matical Education.
Tonga, J. C., Clement, B., and Oudeyer, P.-Y. (2024). Au-
tomatic generation of question hints for mathematics
problems using large language models in educational
technology.
Van der Kleij, F. M., Feskens, R. C. W., and Eggen, T. J.
H. M. (2015). Effects of feedback in a computer-based
learning environment on students’ learning outcomes:
A meta-analysis. Review of Educational Research,
85(4):475–511.
Wang, T., Su, X., Wang, Y., and Ma, P. (2007). Seman-
tic similarity-based grading of student programs. Inf.
Softw. Technol., 49(2):99–107.
Wisniewski, B., Zierer, K., and Hattie, J. (2020). The power
of feedback revisited: A meta-analysis of educational
feedback research. Frontiers in Psychology, 10.
Zhang, K. and Shasha, D. (1989). Simple fast algorithms for
the editing distance between trees and related prob-
lems. SIAM journal on computing, 18(6):1245–1262.
ˇ
Simkovic, M. and Tr
¨
auble, B. (2019). Robustness of sta-
tistical methods when measure is affected by ceiling
and/or floor effect. PLOS ONE, 14(8):e0220889.
CSEDU 2025 - 17th International Conference on Computer Supported Education
626
