Cybersecurity Indicators Within a Cybersecurity Testing and
Monitoring Framework
Steve Taylor
1
a
, Norbert Goetze
2
b
,Joerg Abendroth
2
c
, Jens Kuhr
3
d
,
Rosella Omana Mancilla
4
e
, Bernd Ludwig Wenning
5
f
, Pasindu Kuruppuarachchi
5
g
,
Aida Omerovic
6
h
, Ravishankar Borgaonkar
6
i
, Andrea Neverdal Skytterholm
6
j
,
Antonios Mpantis
7
k
, George Triantafyllou
7
l
, Oscar Garcia
8
m
, Oleh Zaritskyi
9
n
1
IT Innovation Centre, University of Southampton, Southampton, U.K.
2
Nokia Bell Labs, Munich Germany
3
Nokia Solutions and Networks, Munich, Germany
4
Ingegneria Informatica Spa, Rome, Italy
5
Munster Technological University, Cork, Ireland
6
SINTEF AS, Trondheim, Norway
7
Athens Technology Center, Athens, Greece
8
Data Analytics for Industries 4 0 SL, Xàtiva, Spain
9
World Research Center of Vortex Energy, Zaporizhzhya, Ukraine
Keywords: Cybersecurity, Cybersecurity Testing, Intrusion and Anomaly Detection, Cybersecurity Indicators, Device
Under Test (DUT), System Under Test (SUT), Decision Support, Risk Assessment.
Abstract: This paper describes the concept and use of Indicators for cybersecurity decision support. We define an
Indicator as observable information about a Device Under Test (DUT) or System Under Test (SUT) that
potentially can underpin insight on its cybersecurity posture. We describe different types of Indicators, how
they are generated by tools and components in a cybersecurity testing and monitoring framework, how they
may be transformed to increase their utility and illustrate their use via an exemplary case in smart
manufacturing. We summarise key observations and properties of Indicators based on collaborative
multidisciplinary work that has brought together developers of tools that generate Indicators, tools that
consume and analyse indicators, and representatives of users who have motivating scenarios where Indicators
may inform about their cybersecurity posture.
1 INTRODUCTION
In the context of cybersecurity and privacy
protection, IoT devices have the potential to expand
the landscape of risks related to both security and data
privacy. As the number of IoT devices grows within
a
https://orcid.org/0000-0002-9937-1762
b
https://orcid.org/0009-0009-6277-6916
c
https://orcid.org/0009-0005-7572-047X
d
https://orcid.org/0009-0003-6818-9380
e
https://orcid.org/0000-0002-6566-9560
f
https://orcid.org/0000-0002-2034-253X
g
https://orcid.org/0000-0003-2343-8227
an ecosystem, with devices communicating and
collaborating not only internally but also externally,
the lack of proper security can expose the entire
ecosystem to significant risks, including privacy
violations due to data leaks. To mitigate these risks,
the infrastructure, including the devices and the
h
https://orcid.org/0000-0001-8868-597X
i
https://orcid.org/0000-0003-2874-3650
j
https://orcid.org/0000-0001-7507-6366
k
https://orcid.org/0009-0001-1304-530X
l
https://orcid.org/0000-0001-5322-206X
m
https://orcid.org/0009-0003-0781-6141
n
https://orcid.org/0000-0002-6116-4426
416
Taylor, S., Goetze, N., Abendroth, J., Kuhr, J., Mancilla, R. O., Wenning, B. L., Kuruppuarachchi, P., Omerovic, A., Borgaonkar, R., Skytterholm, A. N., Mpantis, A., Triantafyllou, G., Garcia, O.
and Zaritskyi, O.
Cybersecurity Indicators Within a Cybersecurity Testing and Monitoring Framework.
DOI: 10.5220/0013465100003944
Paper published under CC license (CC BY-NC-ND 4.0)
In Proceedings of the 10th International Conference on Internet of Things, Big Data and Security (IoTBDS 2025), pages 416-427
ISBN: 978-989-758-750-4; ISSN: 2184-4976
Proceedings Copyright © 2025 by SCITEPRESS – Science and Technology Publications, Lda.

broader IoT ecosystem must be secured against
intrusions and malicious activities.
This paper builds on previous work by the authors
around the topic of whole-lifecycle IoT cybersecurity
testing, anomaly detection and cybersecurity risk
management. Taylor et al (Taylor et al., 2024a)
described the challenges and an initial approach. A
framework architecture and toolset were described in
Taylor et al (Taylor et al., 2024b) that addresses the
challenges from Taylor et al (Taylor et al., 2024a).
This paper develops the architecture further via a
discussion of the notion of Cybersecurity Indicators,
which provide information relevant to the
cybersecurity posture of the device or system under
test. and serve as a means of communication either
between components in the framework or for
communication to the framework’s user, with the
purpose of providing decision support.
The paper is structured as follows. Section 2
defines the concept of “Indicators” and Section 3
provides a specification of Indicators. Section 4
describes how the testing framework presented
previously in Taylor et al (Taylor et al., 2024b) has
evolved to accommodate Indicators by showing how
the notion of Indicators fits within it. Within this
architecture, several tools generate and consume
Indicators, and these are discussed in Section 5 and
Section 6 respectively. Section 0 describes examples
of indicator usage in an illustrative use case in Smart
Manufacturing. Section 8 discusses developments
from previous work and the observations made
regarding the key properties of Indicators. Finally,
there is a brief summary of the work done to date and
next steps in Section 9.
2 INDICATOR CONCEPT
2.1 Indicator Definition
Indicators represent observable information about
the Device Under Test (DUT) or System Under Test
(SUT) that potentially can underpin insight on its
cybersecurity posture. As a working definition of
“cybersecurity posture”, the following from
Crowdstrike is appropriate: “An organization’s
security posture represents the overall security status
of its networks, systems, and procedures. It is a
holistic snapshot of your security strengths and
vulnerabilities across hardware, software, data, and
user behavior.” (Imtiaz, 2023). RFC 4949 defines
“indicator” as “(N) An action -- either specific,
generalized, or theoretical -- that an adversary might
be expected to take in preparation for an attack. […]”
(Shirey, 2007). This definition solely pertains to the
potential for attack or threat, but for the purposes of
testing and monitoring, a wider interpretation
covering the overall status of the DUT / SUT is
needed, so the preference here is for the Crowdstrike
interpretation pertaining to security posture.
Indicators comprise information of relevance for
assessment of cyber security status or risk. A
fundamental purpose of Indicators is to provide
decision support information to help practitioners
reduce security risks. Indicators may provide this
decision support directly by being directly presented
on the framework’s dashboard as signals e.g. of
intrusions, failures, anomalous behaviour but can also
serve as input to security analysis components in the
framework, whose results are also presented as
decision support information for practitioners.
At the current time, we have identified several
subtypes of indicator, described as follows.
• Signals of Threats “Potential cause of an
unwanted incident, which may result in harm to
a system or organisation.” (ISO/IEC
27000:2018) present in the SUT.
• Detected Vulnerabilities “Weakness of an asset
or control that can be exploited by one or more
threats.” (ISO/IEC 27000:2018) in the SUT.
Known vulnerabilities may be represented as
CVEs - Common Vulnerabilities and Exposures
(CVE Program Mission, 2025) but previously
unknown vulnerabilities may be additionally
detected and reported.
• Confirmation of expected state / behaviour. This
is an indication of normal operation, indicating
the absence of anomalies, or incidents or misuse.
• Signals of Incidents “1. A security event that
involves a security violation. […] In other words,
a security event in which the system's security
policy is disobeyed or otherwise breached. 2.
Any adverse event [that] compromises some
aspect of computer or network security.” (RFC
4949 - Shirey, 2007) detected in the SUT.
• Detected Anomalies “[…] activity that is
different from the normal behavior of system
entities and system resources. (See: IDS.
Compare: misuse detection.)” (RFC 4949 -
Shirey, 2007) detected in the SUT. The tools
provide different types of anomaly detection,
including anomalies in component behaviour,
network traffic and user behaviour.
• Effects of Control measures on the SUT:
“Measure that is modifying risk. May include any
process, policy, device, practice or other action”
(ISO/IEC 27000:2018), “The management,
operational, and technical controls (safeguards
Cybersecurity Indicators Within a Cybersecurity Testing and Monitoring Framework
417

or countermeasures) prescribed for an
information system which, taken together, satisfy
the specified security requirements and
adequately protect the confidentiality, integrity,
and availability of the system and its
information.” (RFC 4949 - Shirey, 2007).
3 INDICATOR SPECIFICATION
We have proposed a template to facilitate
communication, storage and retrieval of
cybersecurity Indicators. This template is utilised in
subsequent sections describing tools that generate or
consume Indicators. The indicator specification
template consists of the following fields:
• Unique indicator ID (mandatory): Unique
identifier of the indicator
• Short name (mandatory): A short name of the
indicator.
• Definition (mandatory): Definition of the
indicator - qualitative/quantitative, as well as a
definition of the variables/parameters involved.
• Purpose (mandatory): Defines the purpose that
the indicator serves.
• Data source (mandatory): Specifies where to
retrieve the indicator values from.
• Retrieval procedure (mandatory): Specifies
how to obtain the indicator values.
• Expected change frequency (mandatory):
Specifies how often the indicator values are
expected to change.
• Update/retrieval frequency (mandatory):
Specifies and recommends how often to retrieve
the indicator values.
• Unit of measure (optional): Specifies the unit of
measure of the indicator.
• Interpretation (optional): Specifies the
interpretation of indicator values, e.g. which
values or ranges of values are desirable,
expected, acceptable, unacceptable, etc.
• Scale (optional): Specifies the measurement
scale for the indicator.
• Uncertainty (optional): Specifies the
uncertainty and the sources of uncertainty. Can
e.g. be expressed in the form of intervals,
confidence level, variance etc.
4 INDICATOR ARCHITECTURE
Figure 1 reprises the architecture of our testing and
monitoring framework from Taylor et al (2024b),
here updated to describe how Indicators are utilised
as communication between the components of the
framework.
Testing Tools (blue) are invoked by the user of
the framework to test some characteristic of the DUT
/ SUT and with the expectation of specific outputs.
Monitoring, Analysis and Detection Tools
(green) observe the DUT / SUT as it is operating and
raise events if specified conditions or anomalous
conditions occur
Security Controls (yellow) may be applied to the
DUT / SUT to manage risks identified.
Indicator Analysis & Decision Support (purple)
consume Indicators generated by other tools, analyse
them and provide decision support, either directly to
the dashboard, or via derived Indicators. A common
thread amongst these tools is that they evaluate trust
and risks from different perspectives, for example
evaluation of impact and likelihood of compromises
detected by the testing or monitoring & detection
tools on the DUT or the SUT, along with
recommendations of controls if the resulting risk level
is unacceptably high.
Testing / Evaluation Environments – (light grey)
are dedicated testbeds, cyber ranges, emulation
environments that enable testing under controlled but
conditions representative of real deployment
conditions.
Data Aggregation provides summarisation of
alerts and insights reported by the upstream tools, for
example consuming multiple events within a time
window and issuing digest messages describing
trends or the content of a repeated alert along with
counts of occurrence.
Auditable Data infrastructure (dark grey)
provides means for secure and auditable data
exchange for tools and other components and to
interact with testing users. It is based on Distributed
Ledger Technology (DLT), which offers
immutability of records on the ledger, thereby
facilitating a reliable and auditable record of events.
The immutability feature of DLT facilitates tamper-
proof records of events and actions. Its distributed
nature adds resilience, and it also allows tools in
different locations to contribute to the same records
and share data such as test results or alerts among
themselves.
For interchange and storage, context and meta
data structures are defined to map between indicator
specifications and the data structures that are to be
used in the data infrastructure. Any information that
should be recorded in relation to an indicator should
be reflected in the context. As such, there is a
minimum set of information required:
IoTBDS 2025 - 10th International Conference on Internet of Things, Big Data and Security
418
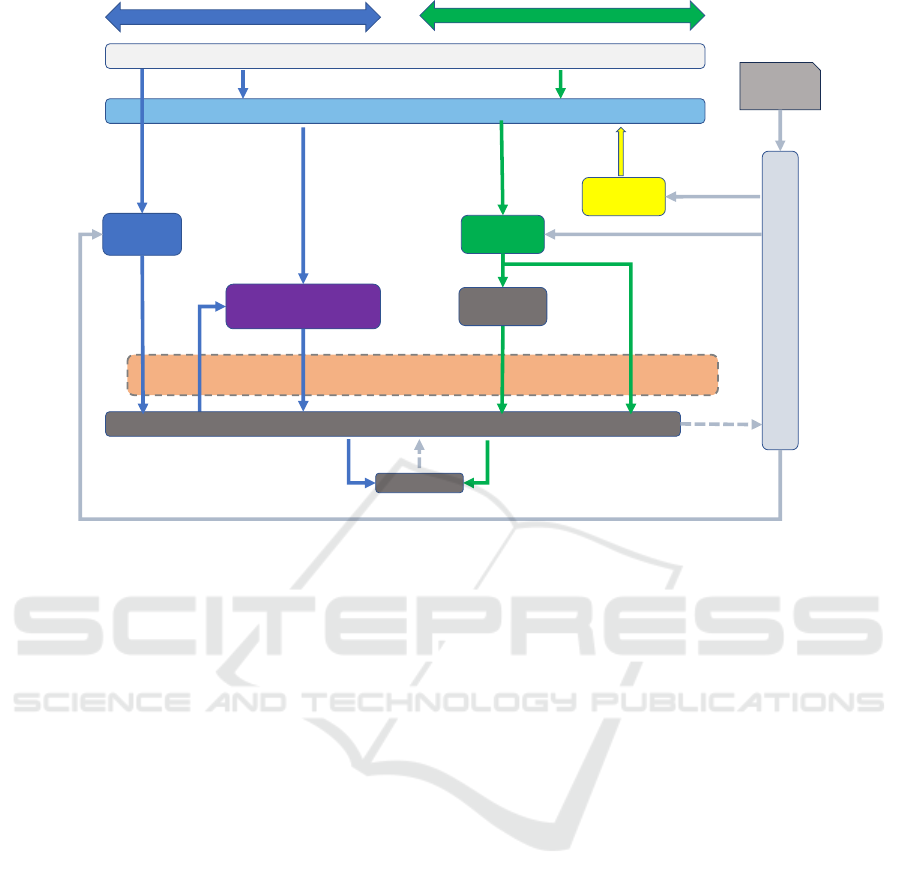
Figure 1: Conceptual Security Testing / Monitoring Architecture Using Indicators as Communication (Reprised and revised
from Taylor, 2024b).
• Type of indicator
• Severity – A string denoting an assessment of the
level of severity or impact
• Source of the indicator – The entity reporting it
• Subject – Item (device) the indicator refers to
• Timestamp – ISO date-time string
• A generic free text field that allows any kind of
supplementary detail as supplied by the tool.
Component Execution Control (light blue grey)
is infrastructure that enables tools and other
components to be configured and executed in
different monitoring and testing sequences depending
on the needs of the situation at hand.
4.1 Indicators Within Security Testing /
Monitoring Architecture
The relationship between the DUT / SUT, tools and
Indicators is shown in Figure 2. This illustrates that
there are tools that monitor (green) or test (blue) the
DUT / SUT and generate Indicators, which are termed
Observed Indicators because they are observations
resulting from testing or monitoring a DUT / SUT.
Other tools filter and aggregate Indicators, leading
to Compound Indicators. This aggregation / filtering
is needed because some Observed Indicators result
from tools that can flood downstream components
with repeated event messages that may describe an
unchanging situation, causing unnecessary demands
on storage and potentially leading to unintended
denial of service on those components.
Further tools consume Indicators, analyse them
and generate output for decision support or Derived
Indicators, which are new Indicators that are the
result of analysis of other Indicators. Tools that
generate Derived Indicators are the Trust and Security
Analyser, the SUT / DUT Risk Assessment and
Access Control Risk Assessment Methodology
(ACRAM).
All Indicators (whether observed, compound or
derived) are stored in the Auditable Data
Infrastructure. This is a shared data infrastructure to
which all components have access.
The tools that generate Observed or Derived
Indicators are described in the following sections,
with specifications of the Indicators they produce. An
example of Compound Indicator aggregation is
provided later in the example in Section 0.
5 OBSERVED INDICATOR
GENERATORS
The tools & components of the framework that
generate Observed Indicators are described in this
section. These are broken into Testing Tools that are
Operation Phase
Tes tin g Ph ase
Tes ti ng
Tools
Indicator Analysis &
Decision Support Tools
Auditable Data Infrastructure
Dashboard
Runtime Status,
Vulnerabilities, Risks, Controls
Monitoring
Too ls
Real-time
Events
Events,
Test Results
Te st
Results
Device / System Under Test (DUT / SUT)
Trust Analysis, Risk
Assessment
Build Risk Model
Aggregated Events
Execute
Te sts
Aggregated /
Filtered Events
Test Results, Vulnerabilites,
Risks, Controls
Workflow Orchestrator
Workflow
Triggers
Config & Execution
Control
Config & Execution Control
Workflow
Te mpl ate s
Testing / Evaluation Environments
Security
Controls
Config & Execution
Control
Observe
DUT / SUT
Indicators
Control
Data
Aggregation
Cybersecurity Indicators Within a Cybersecurity Testing and Monitoring Framework
419
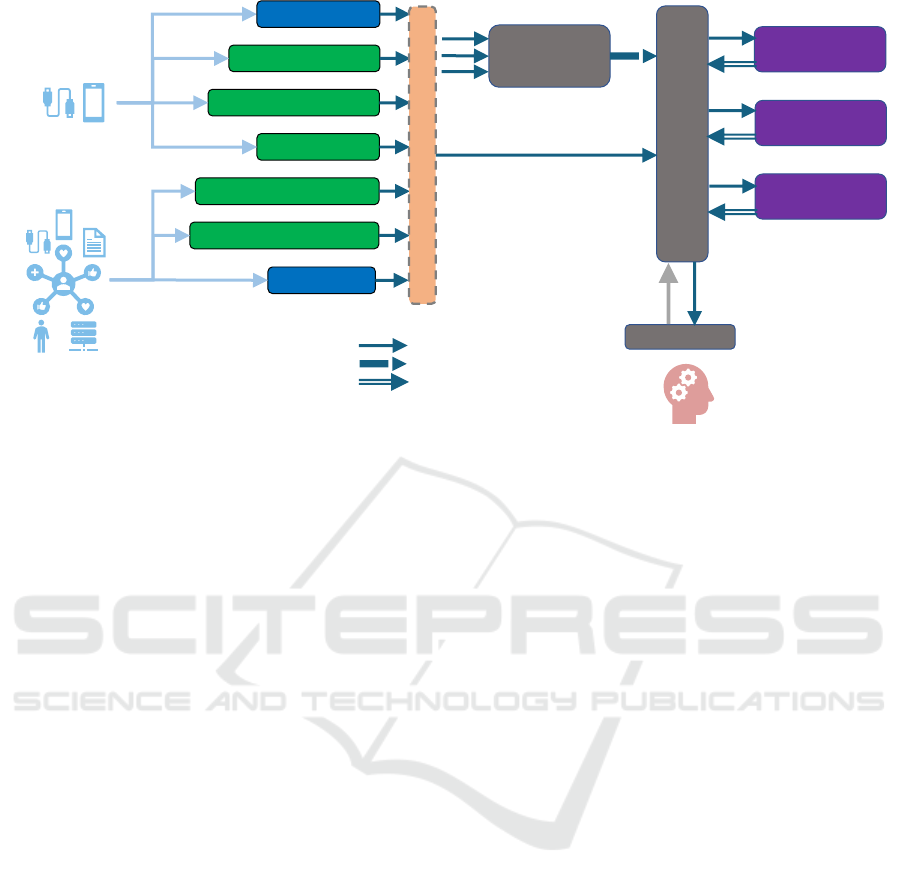
Figure 2: Indicator Generation / Consumption / Filtration / Aggregation / Usage
executed by an operator to evaluate specific
properties of the DUT / SUT and that produce test
results; and Monitoring Tools that operate at runtime
to observe the SUT / DUT and generate Indicators if
the observation meets certain conditions (e.g.
anomalous conditions). Each tool has been described
fully in Taylor et al (Taylor et al., 2024b) but is briefly
introduced here along with its Indicator Output
Specification, a description of the Indicator it
produces
5.1 Tes ting Tools
5.1.1 Network Fuzzer
The Network Fuzzer (following e.g. Miller et al.,
1990) facilitates security testing of network interfaces
by assisting with the detection of unknown
vulnerabilities by sending a large amount of
specifically crafted requests to the interface under test
and observing whether it responds or behaves in an
unexpected way. Such unexpected behaviour can
indicate the presence of a vulnerability, which an
analyst in turn can investigate further.
Indicator output Specification. Definition:
Running a Fuzzer on a network interface. Purpose:
Find anomalous behaviour. Data source: The service
running on the network interface. Retrieval
Procedure: Running the Fuzzer. Expected Change
Frequency: Run when significant updates to the SUT
are undertaken. Measurement frequency: After
every change (update). Unit of Measure: Number of
crashes during a specific interval containing a
description of the observed behaviour and an
associated packet capture file with the packets
required for reproducing the reported behaviour.
Interpretation: All crashes are treated as equally
severe. Scale: Ordinal. Uncertainty: Random and
large amount of input combinations that can lead to
varied and unforeseen outcomes.
5.1.2 SBOM Generator
A Software Bill of Materials (SBOM) is a structured
overview of all external libraries or software
components used in a software program/system. The
SBOM generator provides such a manifest by
applying reverse engineering approach when source
code is not available, which in turn allows the tool to
list known vulnerabilities present in the software
product via queries using libraries and versions to
CVE repositories, e.g. NVD.
Indicator output Specification. Definition:
Generate CVE from SBOM. Purpose: Find software
components and known vulnerabilities in firmware.
Data source: Firmware file of a testing device.
Retrieval Procedure: Running SBOM Generation &
CVE identification tool. Expected Change
Frequency: when the firmware is updated.
Measurement frequency: As often as needed. Unit of
Measure: Two output files: an SBOM file and a list
of identified CVE numbers. Interpretation: The
CVE numbers provide unique identifiers associated
with specific vulnerabilities in software components.
Scale: N/A. Uncertainty: Software components
listed in the SBOM file may not be accurate.
IoT Anomaly Detection
Device Anomaly Detection
Misuse Detection
Network Anomaly Detection
Network Intrusion Detection
SBOM Generation
Network Fuzzer
Device Under
Test
System
Under Test
Data
Aggregation
Auditable Data Infrastructure
Dashboard
Indicators
Operator
SUT / DUT Risk
Assessment
Controls / Workflows / Tests
Indicators
Trust & Security
Analysis
Access Control
Risk Assessment
Derived Indicators
Observed Indicators
Compound / Filtered Indicators
IoTBDS 2025 - 10th International Conference on Internet of Things, Big Data and Security
420

5.2 Monitoring, Analysis & Detection
Tools
5.2.1 Anomaly-Based Intrusion Detection
This tool trains and executes Federated Learning
(Yang, 2019) based models to detect anomalies in
network traffic data, which has emerged as relevant
topic in recent papers on IoT security such as Rey
(Rey, 2022). It is based on behavioural patterns
identified in historic usage scenarios such as normal
activities of devices and infrastructure. It takes as
input a dataset of network traffic (pcap, csv) for
offline analysis and/or real time network traffic; and
generates alerts of anomalous events detected,
including information related to the event and
potentially the high-level type of the event.
Indicator Output Specification: Definition:
Deviation from normal activities in terms of
communication with unrecognized sources /
destinations. Purpose: Find anomalous behaviour
that can indicate potential threats or attacks. Data
source: Network traffic data. Retrieval procedure:
Running the anomaly detection models (inference).
Expected change frequency: Depends on network
traffic behaviour. Measurement frequency:
measurement or analysis is done in real-time or semi-
real time (or offline). Unit of measure: {0,1} for each
element of a given dataset; or alerts for packets.
Interpretation: i) online analysis - an alert for each
irregular pattern packet identified or for X packets; ii)
offline analysis - 0 means normal, 1 means irregular
pattern in the packet. Scale: N/A. Uncertainty: False
positives and false negatives
5.2.2 Anomaly Detection Pipeline
The Anomaly Detection Pipeline generates a
fingerprint of a DUT during normal operation using
machine learning to predict a selected sensor value
based on all other sensor values using the
measurements of one sensor as label. A deviation of
the measured value from the predicted (and expected)
value indicates an anomaly.
Indicator Output Specification: Definition: Near
real time detection of anomalies in measurements
from IoT devices. Purpose: Detection of anomalies in
IoT devices Data source: IoT Sensors; Retrieval
procedure: Comparison with fingerprint recorded
during normal operation. Expected change
frequency: Event-driven – if anomalous behaviour is
detected in DUT, a report is issued. Unit of measure:
3 levels of alarms with increasing severity
represented by green, yellow, orange and red.
Interpretation: off =normal operation to red=serious
alarm. Uncertainty: confidence level of an alarm.
5.2.3 Misuse Detection ML Toolkit
The Misuse Detection ML Toolkit is a set of runtime
libraries offering AI/ML algorithms for training
models to detect the misuse of software systems. It
focuses on intrusion detection (Vinayakumar, 2019),
by identifying deviations from baseline normal usage
patterns derived from historical scenarios, user
activities, and log files via analysis of functional
footprints, temporal behaviours and statistical data
distributions using principles akin to social
engineering. Alerts are raised, published and relayed
downstream when anomalies are detected.
Indicator Output Specification. Definition: Near
real time detection of abnormal behaviour against
normal recorded user activity in measurements from
IoT devices. Purpose: Detection of misuse of
devices. Data source: IoT Sensors. Retrieval
Procedure: Comparison with fingerprint recorded
during normal operation. Expected Change
Frequency: Dependent on user behaviour.
Measurement frequency: Continuous. Unit of
Measure: True / False. Interpretation: Anomalous
behaviour detected / not detected. Scale: Interval.
Uncertainty: Confidence level of alarm.
5.2.4 SNORT Detection and Ruleset
This component builds on SNORT (Caswell 2006)
and utilizes rulesets such as (Wang, 2013) and
(Huang, 2012) to deliver Indicators based on network
traffic. Rulesets can include blacklisted traffic,
forbidden protocols, vulnerabilities or bad actors.
Additional rules can be Indicators for non-malicious
activity but indicate the existence of a specified
software or system state.
Definition: Rules running in the SNORT toolset.
Purpose: Alarm of packets that are suspicious, known
malicious and suspicious based on AI rulings. Data
source: PCAP, mirror port. Retrieval Procedure:
network stream parsed and checked by SNORT.
Expected Change Frequency: Dependent on ruleset
and traffic. Measurement frequency: Continuous.
Unit of measure: Rules can be of different classes,
and each can have severity levels, such as suspicious.
Interpretation: Rules describe circumstances an alert
is generated under, plus rules are classified into types,
e.g. threat, attack or system update. Uncertainty: Rule
matching is a deterministic process with low
uncertainty, but the Indicator statement may include
uncertainty about whether a compromise happened,
which is eliminated in upstream tools.
Cybersecurity Indicators Within a Cybersecurity Testing and Monitoring Framework
421

5.2.5 r-Monitoring - Monitoring & Analysis
of System Processes, Metrics and
Network Traffic
The r-Monitoring tool aims to enhance system
security by comprehensively monitoring and
analysing system processes, metrics, and network
traffic following patterns suggested by Shao et al.
(Shao et al., 2010). It includes dynamic file
monitoring, tracking changes to critical system files
and directories in real-time where unauthorized or
suspicious modifications are flagged and alerted to
the system administrator. It also continuously scans
and evaluates running processes against known
malware signatures and anomalous behaviour
patterns to identify potential threats, ensuring
proactive detection and response.
Indicator output Specification. Definition: Real
time monitoring of IoT and computing devices.
Purpose: Alarm of abnormal resource consumption.
Data source: r-Monitoring Tool agent. Retrieval
Procedure: measurements parsed and checked by the
Tool agent. Expected Change Frequency: depends
on detected abnormalities. Measurement frequency:
constant (real-time). Unit of Measure: each outcome
will contain a description of the observed behaviour
and of the status. Interpretation: binary result
indicating the process causing irregular behaviour of
resource consumption. Scale: Ordinal. Uncertainty:
legitimate user operations generating increased
resource consumption and/or modification of critical
system files for admin functions.
5.2.6 r-Anomaly Detection
This tool is designed to monitor network traffic and
identify unusual patterns that deviate from
established norms. The tool pinpoints specific
features that contribute to each detected anomaly (e.g.
Lundberg & Lee, 2017), using intrusion detection
approaches exemplified by Fuentes-García et al.
(Fuentes-García et al., 2021) against a predefined
baseline of typical activity. It employs machine
learning algorithms (see e.g. Wang et al, 2021) to
identify deviations and the underlying causes of these
irregularities, that may suggest security threats or
system malfunctions. It monitors network traffic,
which consists of data packets, each containing
parameters from various layers, and produces output
indicating whether an anomaly was detected,
describing the severity of the deviation from the
defined baseline and defining the list of parameters
that are considered abnormal.
Indicator Output Specification. Definition:
Identifying traffic that deviates from the established
baseline of normal behaviour. Purpose: Enhance
network security and reliability by promptly flagging
potential attacks or other issues. Data source: PCAP,
mirror port. Retrieval procedure: Network stream
parsed and checked by the service. Expected change
frequency: When the established baseline changes or
additional data are available to finetune model.
Measurement frequency: Each time a network
stream is initiated. Unit of measure: Values
indicating detection, severity, and the abnormal
parameters of each network stream. Interpretation:
All results are binary, accompanied by the feature(s)
causing the anomaly and severity value. Scale:
Ordinal. Uncertainty: false positives, false negatives.
6 INDICATOR CONSUMERS,
ANALYSIS & DECISION
SUPPORT
This section describes tools that consume Observed
Indicators, undertake analysis of their parameters and
values, and provide decision support or generate
Derived Indicators.
6.1 Trust Analyser
Trust is shaped by the trustor’s experiences and
perceptions, making it vital to develop systems that
support informed trust-based decisions (Özer et al.,
2011). The Trust Analyzer (TA) assesses confidence
in the integrity, reliability, and performance of
entities, identifying risks from misplaced or excessive
trust via seven Trust Evaluation Categories (TECs):
Security, Reliability, Resilience, Uncertainty and
Dependability, Goal Analysis, Safety (passive
monitoring), and Privacy (passive monitoring). Five
TECs actively monitor system behaviour, while two
passively provide updates. These TECs are based on
the IIC trust framework (Buchheit et al., 2021) with
additional system considerations and requirements
(Kuruppuarachchi, 2024).
The TA collects data from indicators grouped into
TECs and aggregates this information to calculate a
trust score using a weighted average method. System
owners can assign weights to TECs based on their
relevance to the application, enabling the trust score
to guide informed operational decisions. For ML
tasks, the trust score can also function as a data
quality metric.
IoTBDS 2025 - 10th International Conference on Internet of Things, Big Data and Security
422

Definition: Trustworthiness value for a
component of the SUT; Purpose: Indicate whether a
component is trustworthy; Data Source: All the
available indicators in the SUT; Retrieval Procedure:
Retrieving reports from indicators and applying trust
model; Expected Change/Measurement Frequency:
Based on the use case such as when there is new
information available from indicators or considering
a specific time frame (daily, weekly, etc.); Unit of
Measure: Unitless numeric value or percentage;
Interpretation: High values indicate trustworthiness,
low values indicate lack of trust; Scale: 0 to 1.
Uncertainty: Depends on input indicator accuracy.
6.2 ACRAM (Access Control Risk
Assessment Methodology)
Complex IT infrastructures obviously require a
comprehensive access control solution. A
methodology is proposed, according to which
Subjects (users) and Objects (services) are evaluated
according to significant factors and with the help of a
mathematical model based on fuzzy logic, the risk of
providing access is assessed. ACRAM uses
Indicators (input signals) that characterize the state of
the information system during initiation and
operational phases. The two main groups of input
Indicators (dynamic and static) used as facts in the
fuzzy rules as follows:
1. Object anomaly behaviour via network
traffic, process & misuse detection. Subject
anomaly behaviour and Object access
frequency for User Access Management
(UAM) Systems. Vulnerabilities (CVE Lists)
of subjects is derived from SBOM scanning.
2. Password management policy from an access
control list. Information sensitivity level, for
example, different data bases with personal
data etc. Level of object dependency is
calculated based on the system architecture
using graph theory.
ACRAM estimates a baseline risk level and
during the operation phase ACRAM recalculates the
initial risk levels considering the system anomaly
level correlated with active policies. The risk levels
are transmitted to the Risk Assessment as Indicators
to determine overall risk levels of the SUT.
Indicator Specification Template. Definition:
Measures the risk level of the access control system.
Purpose: identify weaknesses in the access control
system. Data source: ACRAM. Retrieval procedure:
Running the ACRAM. Expected change frequency:
discrete or event-based. Measurement frequency:
deployment of IT infrastructures, changes in the IT
architecture, receiving signals about anomalies from
the partners' real-time tools. Unit of measure: %.
Interpretation: based on fuzzy rules. Scale: 0-1.
Uncertainty: 0.0 -1.0.
6.3 DUT / SUT Risk Assessment
The risk assessment is performed by a comprehensive
automated risk management toolkit (Phillips et al,
2024) designed to enhance a system's security via the
assessment of risks and recommendations of controls
to lower the likelihood of risks with an unacceptably
high level. Dynamic context and threat propagation
via interdependencies of assets and consequences
offers a continuous monitoring and updating of risk
assessments as new threats emerge or as changes
occur in the system.
This toolkit has been extended by investigating
how to use Indicators to inform changes in risk. In
order for the Indicators to be meaningful to the risk
assessment, they need to be mapped to elements
inside a risk model. The representation scheme
follows CVSS to represent vulnerabilities in the risk
model, which facilitates this mapping, but the
mapping is highly domain and application specific.
Utilisation of Observed / Compound Indicators in risk
assessment follows.
The SBOM generation tool can analyse the DUT
and provide an SBOM, which provides information
of software libraries that represent the functional
blocks of the DUT, which can then be linked to
vulnerabilities via queries to CVEs databases with the
software libraries and versions as parameters. The
results of these queries are CVEs with associated
CVSS scores, which can then be mapped into the
models via support of CVSS.
Risk models including access control components
can be constructed. When ACRAM predicts a high
risk of access control failure, vulnerabilities
associated with the access control system can be
adjusted accordingly and the overall risks in the
system recomputed.
A model of the SUT including the files being
monitored can be constructed. Files are data objects
and have vulnerabilities associated with their
Confidentiality, Availability and Integrity. Should the
r-Monitoring detect e.g. tampering or unauthorised
access, the associated vulnerability in the file in
question can be adjusted in the model, and the system
risks recomputed.
Indicator Output Specification. Definition:
Qualitative risk levels expressed as: Type of risk;
Impact of risk; Likelihood of risk. Purpose: Describe
different types of risks in the SUT along with their
Cybersecurity Indicators Within a Cybersecurity Testing and Monitoring Framework
423
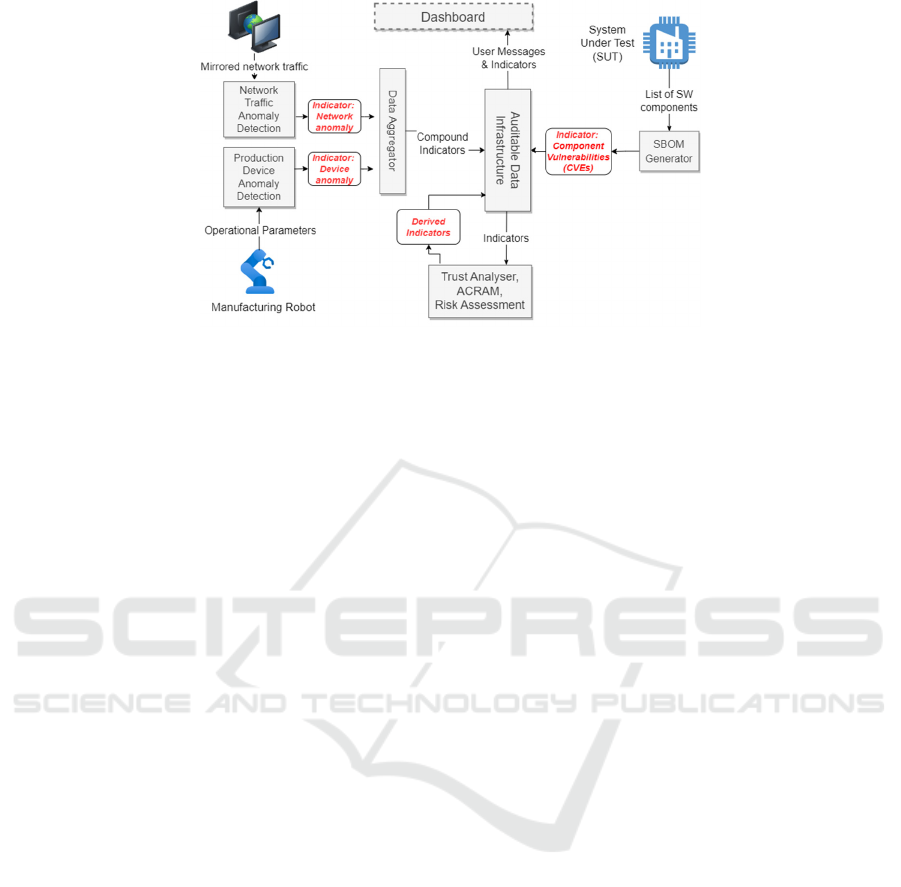
Figure 3: Smart Manufacturing Scenario.
assessed level. Data Source: Risk Management Tool.
Retrieval Procedure: Running the risk calculation.
May be triggered by an incoming event that adjusts
vulnerability levels in risk model, which will mean
that the risk levels need to be re- calculated as a result
of the change. Expected Change Frequency:
Depends on frequency of notification reports.
Measurement Frequency: Upon receipt of
notification of change of a specified vulnerability
relevant in the risk model. Unit of Measure: Discrete
values: “Safe”, “Low”, “Medium”, “High”, “Very
High”. Interpretation: The output represents the
current status of the risk model in terms of different
risk present in the SUT / DUT and their risk levels,
plus recommendations of possible controls and
residual risk resulting from their implementation.
7 INDICATOR USAGE EXAMPLE
– SMART MANUFACTURING
We illustrate the use of Indicators in a Smart
Manufacturing scenario where production machines
can become targets of attacks, which if successful can
result in degraded product quality or interruptions in
operation of the machine, leading to increased failure
rates and loss of trust and reputation for the factory.
The indicators generated by the anomaly
detection identify deviations in the operational
parameters of machines, e.g. in the way a production
robot moves its arms: a change in these patterns that
deviate from normal and expected operation can
signal potentially malicious alterations to production
parameters. Another issue is the manipulation of
production machines to leak sensitive production
information to third parties. Further, the Smart
Factory is in itself a heterogeneous software and
hardware landscape, which often consists of a mix of
custom-built programs, purchased standard software,
robots, sensors and actuators, all interacting. These
components can have vulnerabilities, which serves as
attack points for adversaries. It is therefore important
to identify newly discovered critical vulnerabilities in
software as soon as possible. This task is handled by
the SBOM module, which compares the current
Software Bill of Materials (SBOM) of the Smart
Factory against a CVE database and reports newly
identified vulnerabilities in the form of indicators.
An exemplar architecture of the Indicator usage in
Smart Manufacturing is illustrated by the architecture
in Figure 3. This shows its schematic structure, where
anomaly detection tools for network traffic as well as
for operational data of a production machine, are
employed. The Indicators are delivered to the Data
Aggregator, combined as necessary, and forwarded to
the Auditable Data Infrastructure. The SBOM tool
works offline and delivers its indicators directly to the
Auditable Data Infrastructure. All Indicators are
forwarded to the Trust Analyser, ACRAM and Risk
Assessment tools, where they are processed to
determine Derived Indicators for risks in the smart
factory and suggestions for mitigating these risks.
Observed Indicators
Device Anomaly. Detected abnormal operational
behaviour of a production robot, e.g., moves too fast,
moves too slow, moves differently than initially
programmed.
Network Anomaly. Detected abnormal behaviour of
a network component e.g., a device starts transmitting
more data than usual.
Software Component Vulnerability. A set of
vulnerabilities in the CVE format derived from
analysis of the software components in the DUT.
IoTBDS 2025 - 10th International Conference on Internet of Things, Big Data and Security
424
Compound Indicators
The two Observed Indicators described above are
aggregated because they are the result of monitoring
components that frequently generate output and so for
reasons described above regarding data volumes and
network congestion, are aggregated into Compound
Observed Indicators, where summary information is
created based on a time window and a set of source
Observed Indicators.
Derived Indicators
Trust Analyser. Indicators of the trustworthiness of
the SUT can assist decision-making when it comes to
assigning workloads to the SUT. If a SUT
experiences vulnerabilities or attacks during data
collection, this will be reflected in the trust score
during trust analysis. Therefore, the trust score serves
as a valuable data quality feature when training ML
models. The frequency of trust score calculation
depends on use case requirements, often involving
long-term evaluation of the SUT. This helps build the
SUT's reputation by analysing trust score
fluctuations.
ACRAM. Determines Derived Indicators based on
assessment of access control systems in the DUT /
SUT. Risk Indicators of access control policies and
enforcement to the critical components in the smart
manufacturing environment of the SUT. An example
concerns risks in terms of the access control system
on the example of a production line consisting of a 3D
printer and industrial robot associated with access
control of three users. Observed Indicators describing
anomalous behaviour in the operation of an industrial
robot using Device Anomaly Detection. These are
processed by the ACRAM tool, which determines the
resulting access control risk.
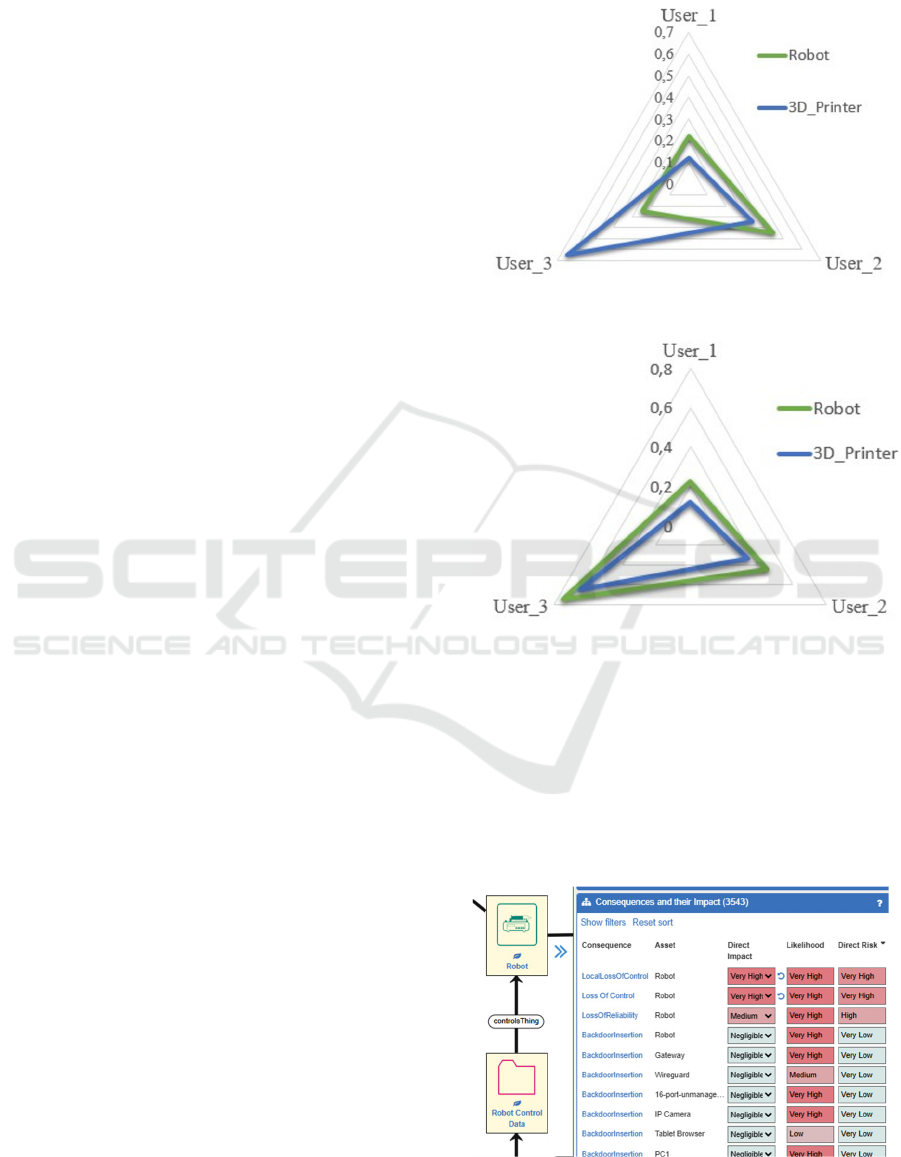
Figure 4 and Figure 5 demonstrate the risk levels
of two Compound Indicators, Robot-User_3 and
3D_Printer-User_3, respectively, before and after
detection of anomalous behaviour.
In both Figure 4 and Figure 5 we can see a high
level of risk in the pair 3D_Printer-User_3, which is
due to the detection of a specific vulnerability during
the system initialization phase by SBOM tools. The
implementation of the identified vulnerability of
3D_Printer assumed full access rights for a user who
had full rights to administer printer services, so the
methodology recalculated and significantly increased
the threat level even during the system initiation
phase. Figure 5 shows an increase in risk of Robot-
User_3 over Figure 4 due to the anomaly detection
where the risk is greater due to anomalous behaviour
of User 3.
Figure 4: Access Control Risk Before Anomaly Detection.
Figure 5: Access Control Risk After Anomaly Detection.
Risk Assessment. Provides evaluation of the risk
level of the smart factory based on the Observed
Indicators and suggestions for mitigation. An
example is illustrated in Figure 6, where the Indicator
from Device Anomaly Detection leads to a
Consequence (risk) of “Loss of Control” of the Robot
at a very high level. Other Indicators can be consulted
to investigate for the cause of the anomaly, e.g. via
file scanning of the Robot Control Data.
Figure 6: Loss of Control of Robot.
Cybersecurity Indicators Within a Cybersecurity Testing and Monitoring Framework
425

Indicator Storage & Presentation
For storage in the Auditable Data Infrastructure, the
following contexts are defined:
1. Device anomalies (Compound Observed);
2. Network anomalies (Compound Observed);
3. SBOM output (Observed);
4. ACRAM (Derived);
5. Trust assessments (Derived);
6. Risk assessments (Derived).
The first two reach the Data Infrastructure via the
Aggregator because they may repeat at high
frequency, so are aggregated into Compound
Observed Indicators. SBOM output is less frequent,
as it is the result of a manual scan, so aggregation is
not required, and it is recorded as an Observed
Indicator. Derived Indicators are the outputs of the
three tools as described above, and their results may
be subsequently used in further analysis. All
Indicators stored within the Data Infrastructure may
be presented to the user on demand or by navigation.
8 DISCUSSION
The work reported here builds on previous work
(Omerovic et al. 2017) in that here we have
determined a testing framework, determined types of
Indicators (i.e. observed, compound and derived) and
characterised indicators in terms of properties (next
section).
Previous work focused on a top-down approach
where the decision support has driven and identified
the need for Indicators which align the decision
models (risk, prediction, compliance analysis) with
the actual context. This presupposed that the need for
an Indicator type was known a priori. Here, we have
followed a bottom-up approach, where Indicators
measurable by the tools have been gathered and
specified and their (example) measurements were
documented using templates. A key goal was to
evaluate whether the Indicators were applicable in the
context of the test cases. Initial results from the trials
have shown that the capabilities of the tools have
provided the demonstration case owners with insight
on what types of Indicators can be measured, much of
which was previously unknown to them, and the
demonstration case owners have suggested
requirements for enhancements of the tools and
associated additional Indicators to the tool developers.
This collaborative approach has proven useful for both
types of party.
Both top down and bottom up approaches have
advantages and disadvantages, in that top down
requires knowledge of the Indicator required and
bottom up describes what can be measured but not
whether it is useful. It is expected that future work
will utilise a mix of both approaches as appropriate.
9 CONCLUSIONS
This paper has described the concept of Indicators in
cybersecurity testing & monitoring and described
how they may be used to provide decision support,
both individually and together. This work has brought
to light a set of observations that either characterise
Indicators or describe how they may be beneficially
used in the cybersecurity testing and monitoring of
devices and systems.
• Indicators are types of signals that may be used
as evidence in a decision-making process that
may result in corrective action being taken.
• Indicators may be derived from other Indicators.
Tools may consume one or more Indicators and
produce Derived Indicators based upon them.
• Some Indicators require aggregation because
they are frequently occurring, resource expensive
and individually are of marginal value.
• Indicators may be aggregated to provide
empirical evidence, which is a composition of
several pre-defined Indicators. For example, one
event may not generate an important alarm, but
the conjunction and correlation of different
events may cause an alarm.
• Indicators may be used in multiple ways: as
direct evidence to the operator of the framework;
as input to tools, where they may be processed
and generate output as e.g. reports or derived
Indicators. The operator of the framework is free
to use Indicators as they see fit.
• Indicators either pertain to an individual device
(i.e. Device Under Test – DUT) or a larger
system into which the device is deployed (i.e.
System Under Test – SUT).
• Indicators are likely subject to change over time,
due to a change in the SUT / DUT, security
events such as attacks occurring or new
vulnerabilities being detected. The changed
values need to be captured in a timely way, in
order to provide up to date information, and the
trend over time may in itself be an indicator.
Overall, the Indicator concept has proven useful
in our specification and construction of the testing
and monitoring framework, as both a decision support
mechanism for practitioners but also as a
communication means between components.
IoTBDS 2025 - 10th International Conference on Internet of Things, Big Data and Security
426

ACKNOWLEDGEMENTS
This work is undertaken by the Horizon Europe
TELEMETRY (Trustworthy mEthodologies, open
knowLedgE & automated tools for sEcurity Testing
of IoT software, haRdware & ecosYstems) project,
supported by EC funding under grant number
101119747, and UKRI under grant number
10087006.
REFERENCES
Buchheit, M., Hirsch, F., Martin, R. A., Bemmel, V.,
Espinosa, A. J., Zarkout, B., Hart, C. F., & Tseng, M.
(2021). The Industrial Internet of Things
Trustworthiness Framework Foundations [Review of
The Industrial Internet of Things Trustworthiness
Framework Foundations]. An Industrial Internet
Consortium Foundational Document, Version V1.00.
https://www.iiconsortium.org/pdf/Trustworthiness_Fra
mework_Foundations.pdf
Brian Caswell, Jay Beale, Andrew Baker: Snort Intrusion
Detection and Prevention Toolkit. Elsevier Science &
Technology; 17. Dezember 2006, ISBN 978-1-59749-
099-3.
CVE Program Mission, https://www.cve.org/. Retrieved
2025-01-13.
M. Fuentes-García, J. Camacho and G. Maciá-Fernández,
"Present and Future of Network Security Monitoring,"
in IEEE Access, vol. 9, pp. 112744-112760, 2021, doi:
10.1109/ACCESS.2021.3067106
Huang, C., Xiong, J., and Peng, Z. (2012). “Applied research
on snort intrusion detection model in the campus
network,” in IEEE Symposium on Robotics and
Applications (ISRA).
Kamil Imtiaz, What is Security Posture? August 06, 2023.
https://www.crowdstrike.com/en-us/cybersecurity-
101/exposure-management/security-posture/
ISO/IEC 27000:2018. Information technology — Security
techniques — Information security management
systems — Overview and vocabulary.
https://www.iso.org/standard/ 73906.html
Pasindu Kuruppuarachchi, Rea, S., & McGibney, A. (2024).
Trust and Security Analyzer for Digital Twins.
Communications in Computer and Information Science,
278–290. https://doi.org/10.1007/978-3-031-51643-
6_20
Scott M. Lundberg and Su-In Lee. 2017. A unified approach
to interpreting model predictions. In Proceedings of the
31st International Conference on Neural Information
Processing Systems (NIPS'17). Curran Associates Inc.,
Red Hook, NY, USA, 4768–4777.
https://dl.acm.org/doi/10.5555/3295222.3295230
Miller, Barton P., Lars Fredriksen, and Bryan So. "An
empirical study of the reliability of UNIX utilities."
Communications of the ACM 33.12 (1990): 32-44.
Omerovic, A. Natvig, M., Tardy, I. C. R., "Privacy
Scorecard – Refined Design and Results of a Trial on a
Mobility as a Service Example". In proceedings of 27th
European Safety and Reliability Conference (ESREL'
2017) June 18-22; Portoroz, Slovenia
TA Özer, Ö., Zheng, Y., & Ren, Y. (2011). A Tale of Two
Countries: Trust and Trustworthiness in China and the
U.S. SSRN Electronic Journal. https://doi.org/10.2139/
ssrn.1961774
S. C. Phillips, S. Taylor, M. Boniface, S. Modafferi and M.
Surridge. (2024). "Automated Knowledge-Based
Cybersecurity Risk Assessment of Cyber-Physical
Systems," in IEEE Access, vol. 12, pp. 82482-82505,
2024, doi: 10.1109/ACCESS.2024.3404264.
Rey, V., Sánchez, P. M. S., Celdrán, A. H., & Bovet, G.
Federated learning for malware detection in IoT devices.
Computer Networks, 2022
J. Shao, H. Wei, Q. Wang and H. Mei, "A Runtime Model
Based Monitoring Approach for Cloud," 2010 IEEE 3rd
International Conference on Cloud Computing, Miami,
FL, USA, 2010, pp. 313-320, doi: 10.1109/
CLOUD.2010.31.
R. Shirey, Internet Security Glossary, Version 2. Network
Working Group Request for Comments: 4949, August
2007. https://datatracker.ietf.org/doc/html/rfc4949
Taylor, S.; Jaatun, M.; Mc Gibney, A.; Seidl, R.;
Hrynchenko, P.; Prosvirin, D. and Mancilla, R. (2024a).
A Framework Addressing Challenges in Cybersecurity
Testing of IoT Ecosystems and Components. In
Proceedings of the 9th International Conference on
Internet of Things, Big Data and Security, ISBN 978-
989-758-699-6, ISSN 2184-4976, pages 226-234.
S. Taylor; P. Melas; M. Jaatun; A. Omerovic; R. Seidl N.
Goetze; J. Kuhr; D. Prosvirin; M. Leone; P. De Lutiis;
A. Kuznetsov; A. Gritskevich; G. Triantafyllou; A.
Mpantis; O. Garcia Perales; B. Wenning; S. Duttagupta
(2024b). Toward Cybersecurity Testing and Monitoring
of IoT Ecosystems. (Preprint). https://arxiv.org/abs/
2502.12837
Vinayakumar, R., Soman, K. P., & Prabaharan
Poornachandran, N. (2019). Evaluating shallow and
deep networks for network intrusion detection systems
in cybersecurity. Future Generation Computer Systems,
107, 13-26.
Wang, Ruowen & Ning, Peng & Xie, Tao & Chen, Quan.
(2013). MetaSymploit: day-one defense against script-
based attacks with security-enhanced symbolic analysis.
65-80.
S. Wang, J. F. Balarezo, S. Kandeepan, A. Al-Hourani, K.
G. Chavez and B. Rubinstein, "Machine Learning in
Network Anomaly Detection: A Survey," in IEEE
Access, vol. 9, pp. 152379-152396, 2021, doi:
10.1109/ACCESS.2021.3126834.
Qiang Yang, Yang Liu, Tianjian Chen, and Yongxin Tong.
Federated machine learning: Concept and applications.
ACM Transactions on Intelligent Systems and
Technologies (TIST), Feb. 2019.
Cybersecurity Indicators Within a Cybersecurity Testing and Monitoring Framework
427
