
Surface Current Visualization in Waterway Based on Mike 21 Model
and S-100 Standards
Zixuan Wang, Mingyang Pan
*
, Shaoxi Li, Chao Li and Zongying Liu
Navigation College, Dalian Maritime University, Dalian, Liaoning, 116026, China
Keywords: S-100, Mike 21, Surface Current, Marine Data Standards.
Abstract: The S-100 standard, proposed by the International Hydrographic Organization (IHO), aims to address the
limitations of the S-57 standard in terms of data application and interoperability. This study focuses on the
Fujiangsha water area, using the Mike 21 hydrodynamic model to simulate the flow dynamics in the region.
The standardized processing of this data generates S-111 surface current data that complies with the S-100
specifications. The visualization of surface current data is realized using Cesium, which displays the flow
field characteristics of the Fujiangsha water area. By integrating the standardization of S-111 data with
visualization technology, this paper seeks to provide new technical support and application demonstrations
for maritime management and navigation safety, while exploring the potential for further development of the
S-100 standard in practical applications.
1 INTRODUCTION
The S-100 Universal Hydrographic Data Model is a
new generation of marine geographic information
standard officially established by the International
Hydrographic Organization (IHO) in 2010. It aims to
address the limitations of the S-57 standard in terms
of data application and interoperability, facilitating
data fusion and sharing (Luo, J. N. et al., 2019). S-
100 covers electronic charts and various marine
environmental information data products, enhancing
the visualization and application of dynamic
hydrological data. Its product specifications (such as
S-101 electronic charts, S-102 bathymetric surfaces,
S-111 surface currents, etc.) provide technical
support for navigation safety and efficiency,
becoming a crucial foundation for modern marine
surveying and mapping(Wu, L. L. et al., 2019).
However, current research on S-100 remains
largely theoretical (Peng, W. et al.,2017; Dou, H. X.,
2013; Liu, Q. C.,2012), with limited studies focused
on its practical applications, particularly in the area of
channel information visualization. To address this
gap, this paper takes the Fujiangsha water area as the
study subject, generating surface current data that
complies with the S-111 standard through
*
Corresponding author
standardized processing. These data are derived from
simulations of the channel flow field using the Mike
21 hydrodynamic model, which provides
hydrodynamic characteristic data of the region,
including high-resolution data on water flow speed,
direction, and other parameters. To further
demonstrate and apply these data, a front-end
platform based on Cesium was developed, and the
surface current data were visualized, providing an
intuitive representation of the flow field
characteristics in the Fujiangsha water area.
2 METHODOLOGY
2.1 S-111 Data Structure
Surface current data in the S-111 standard can be
represented in two formats: point data contained
within a regular grid and point sets described by an
irregular grid. Based on the source of surface current
data, it can be categorized into four basic types:
observed or predicted values at multiple fixed
locations, predicted values arranged in a regular grid,
values at multiple locations but not within a regular
grid, and values observed at mobile stations. In this
Wang, Z., Pan, M., Li, S., Li, C. and Liu, Z.
Surface Current Visualization in Waterway Based on Mike 21 Model and S-100 Standards.
DOI: 10.5220/0013466000003935
Paper published under CC license (CC BY-NC-ND 4.0)
In Proceedings of the 11th International Conference on Geographical Information Systems Theory, Applications and Management (GISTAM 2025), pages 231-235
ISBN: 978-989-758-741-2; ISSN: 2184-500X
Proceedings Copyright © 2025 by SCITEPRESS – Science and Technology Publications, Lda.
231
study, the surface current data type is predicted values
arranged in a regular grid.
The S-111 regular grid is an implementation of
S100_GridCoverage. A regular grid is a two-
dimensional orthogonal spatial grid defined by
several attributes, including the grid origin, spacing,
and grid indices. The velocity and direction of surface
currents correspond to the nodes within the regular
grid. The grid values are stored sequentially along the
X-axis at the lowest position of the Y-axis, starting
from the leftmost value and proceeding to the next X-
axis values for each subsequent Y-axis position until
the top of the Y-axis is reached. A typical regular grid
and its parameters are illustrated in the figure 1.
Figure 1: Typical structured grid and its parameters.
According to the S-111 Surface Current Product
Specification of the IHO-released S-100 series
product standards, surface current data products must
be encoded using the Hierarchical Data Format
version 5 (HDF5). The HDF5 data format is capable
of efficiently organizing massive amounts of data
through its inherent structural features. Typically,
files adopt a hierarchical tree structure, where the
nodes of the tree are Groups, representing collections
of objects. Each group contains one or more Datasets,
which are multidimensional data arrays that include
attributes and other metadata. The structure of an
HDF5 file is shown in the figure 2.
Figure 2: HDF5 file structure.
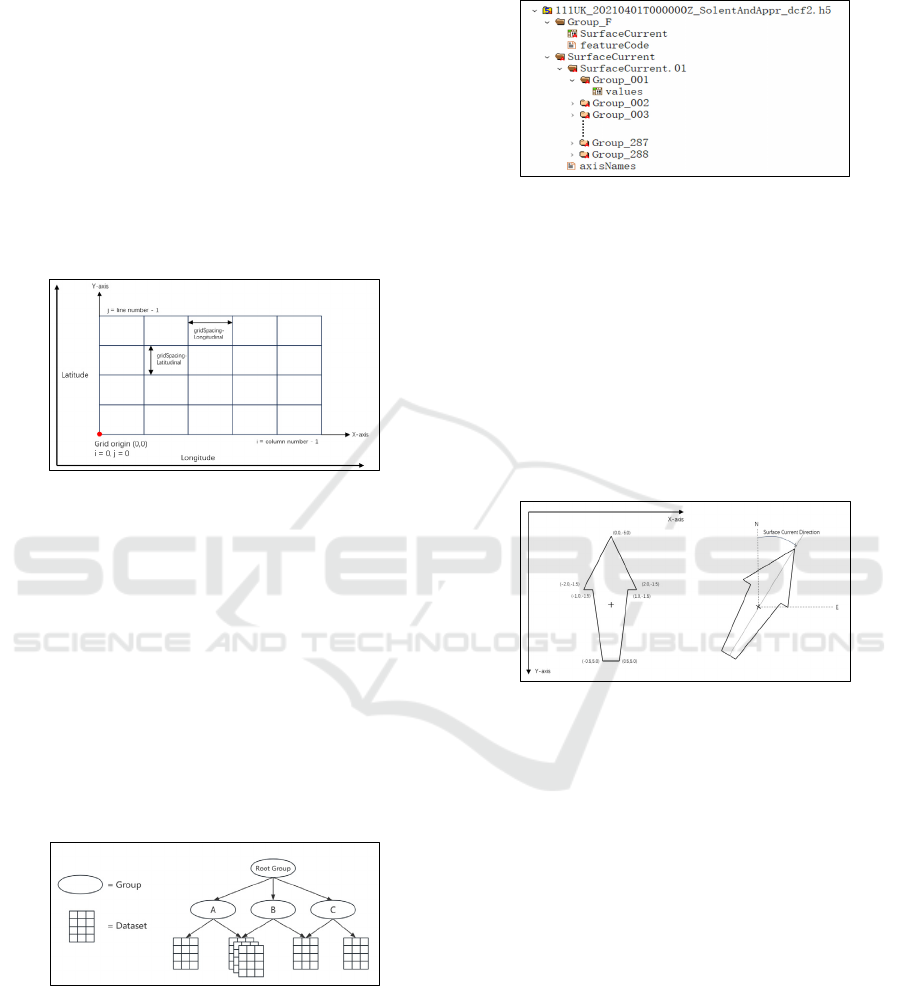
According to the mandatory naming conventions
outlined in the S-100 standard, the following groups
and data names are required in the S-111 data
product: Group_F, featureCode, SurfaceCurrent,
axisNames, Positioning, SurfaceCurrent.nn, and
Group_nnn (n is an integer from 0 to 9). The figure 3
illustrates the structure of example S-111 data
provided by the UK Hydrographic Office.
Figure 3: Structure of the UK Hydrographic Office's S-111
example data
2.2 S-111 Visualization Representation
The S-111 Surface Current Product Specification
provides detailed guidelines for the display of surface
current data. The grid data of the surface current field
is depicted using multiple arrows. These arrow
symbols are created using Scalable Vector Graphics
(SVG) instructions, following the input specifications
shown in the figure 4, and are scaled according to the
surface current speed and the display area.
Figure 4: Input specifications for S-111 arrow symbols.
The direction of the arrow symbols must represent
the direction of the surface current flow (referencing
true north). The color of the arrows must be based on
the speed values of the data, with the opacity adjusted
according to the background chart. The size of the
arrows must be a function of the surface current
speed, where
ref
H
and
ref
S
are used as reference
values for scaling the arrows. The minimum and
maximum speed values,
low
S
and
high
S
, are used to
calculate the length of the arrows. The surface current
with a speed of
S
is represented by an arrow with a
height of
H
. The calculation method is as follows:
()
{
}
,, /
ref low high ref
H
HminmaxSSS S=⋅
(1)
The arrow symbols are placed over a
geographically referenced background, and when the
GISTAM 2025 - 11th International Conference on Geographical Information Systems Theory, Applications and Management
232

cursor hovers over the vector arrows, the
corresponding speed and direction values for each
arrow are displayed. The figure 5 shows an example
of S-111 data from the UK Hydrographic Office,
visualized using the KHOA S-100 Viewer.
Figure 5: Visualization of the UK Hydrographic Office's S-
111 example data.
2.3 Mike 21 Hydrodynamic Model
Mike 21 is a two-dimensional numerical model
developed by the Denmark Hydraulic Institute,
providing a comprehensive and efficient design
environment for engineering applications, coastal
management, and planning. Mike 21 is not only
beneficial for simulating complex river channels but
also supports a variety of control structures. Its
relatively short computation time significantly
improves computational efficiency(Li, X. B., 2024).
Thus, this study uses the Mike 21 to simulate the
channel flow field and further construct the
hydrological characteristic dataset for the channel
flow field.
Mike 21 neglects vertical flow acceleration and
focuses on vertically averaged flow factors. It can use
either Cartesian or spherical coordinates, and in the
plane, it employs unstructured grids to simulate water
level and flow variations caused by various forces, or
to model two-dimensional free-surface flows that
disregard stratification. The numerical method used
in Mike 21 is the finite volume method, which
computes the normal fluxes by establishing a unit
hydraulic model along the outer normal and solving
the one-dimensional Riemann problem(Lü, Z. Y.,
2024). The specific equations of the two-dimensional
shallow water equations in the Mike 21 are as follows:
hhuhv
hS
tx x
∂∂ ∂
++=
∂∂ ∂
(2)
Momentum Equation in the X Direction:
()
()
2
2
00000
1
2
asxbx
xy
xx
x
xxys
hu hu huv
fvh gh
txy x
hp gh
xx
S
S
hT hT hu S
xy x y
η
ρτ τ
ρρρρρ
∂∂ ∂ ∂
++=− −
∂∂ ∂ ∂
∂∂
−+−−
∂∂
∂
∂∂∂
++ + +
∂∂ ∂ ∂
(3)
Momentum Equation in the Y Direction:
() ()
2
2
00000
1
2
sy by
a
yx yy
x
yyys
hv hv huv
fuh gh
ty x y
hp gh
yy
SS
hT hT hv
S
xy x y
η
ττ
ρ
ρρρρρ
∂∂ ∂ ∂
++ =− −
∂∂ ∂ ∂
∂∂
−+−−
∂∂
∂∂
∂∂
++ + +
∂∂ ∂ ∂
(4)
The average flow velocity along the water depth
direction is defined by the following equation:
,
dd
hu udz hv vdz
ηη
−−
==
(5)
Where
η
is Riverbed elevation;
,uv
is velocity
component in the direction
,
x
y
;
,
s
s
uv
is average
water flow velocity in the direction
,
x
y
;
f
is
coriolis force coefficient;
ω
is Earth's rotational
angular velocity;
ϕ
is local latitude;
g
is
gravitational acceleration;
S
is flow generated by
source and sink terms;
,,,
s
xbxsyby
ττττ
is
components of the surface wind stress and riverbed
bottom friction stress along the direction
,
x
y
;
ij
T
is
lateral stress terms.
The boundary condition treatment in the MIKE 21
includes open boundaries, closed boundaries, and
dry-wet boundaries. Under open boundary
conditions, water flow is allowed to enter and exit the
boundary region. For closed boundaries, all velocity
components perpendicular to the boundary are set to
zero, defining a no-slip boundary. In dry-wet
boundary conditions, the cells are classified as dry,
semi-dry, or wet, with the conditions being satisfied
as:
dry flood wet
hh h<<
( Hu, X. W., 2024).
Surface Current Visualization in Waterway Based on Mike 21 Model and S-100 Standards
233
3 EXPERIMENTS
3.1 Two-Dimensional Flow Field
Calculation
The Fujiangsha Waterway is located opposite the
Zhangjiagang Port area.In this study, MIKE 21 is
used to construct a two-dimensional hydrodynamic
numerical model for the river section where the
Fujiangsha Waterway is located. The river section is
approximately 43 km long. The computational range
of the model is shown in the figure 6.
Figure 6: Model computation range.
In constructing the model computational grid, it is
necessary to extract the riverbank and water depth
data. In this study, ArcGIS Pro was used to extract
riverbank and water depth data from the S-57 charts.
Given the characteristics of the river channel, an
unstructured triangular mesh grid was employed. The
grid near the riverbanks and islands was refined,
while the grid in the center of the river was coarser,
ensuring the model’s stability and improving
computational efficiency. The computational grid
consists of 1,277 nodes, which is shown in the figure
7.
Figure 7: Model grid division.
The MIKE 21 model adopts a cold start for its
initial conditions. The upper and lower boundary
conditions are defined as water level boundaries, with
the boundary format varying over time and along the
boundary. In this study, the default value of 0.28 is
used for the eddy viscosity coefficient. The Manning
coefficient is selected to control the bed roughness,
set to 32 in this study. The time step is set to 300
seconds, with results output every 30 minutes. The
model's computational results are shown in the figure
8.
Figure 8: Model computation results (time interval of 4).
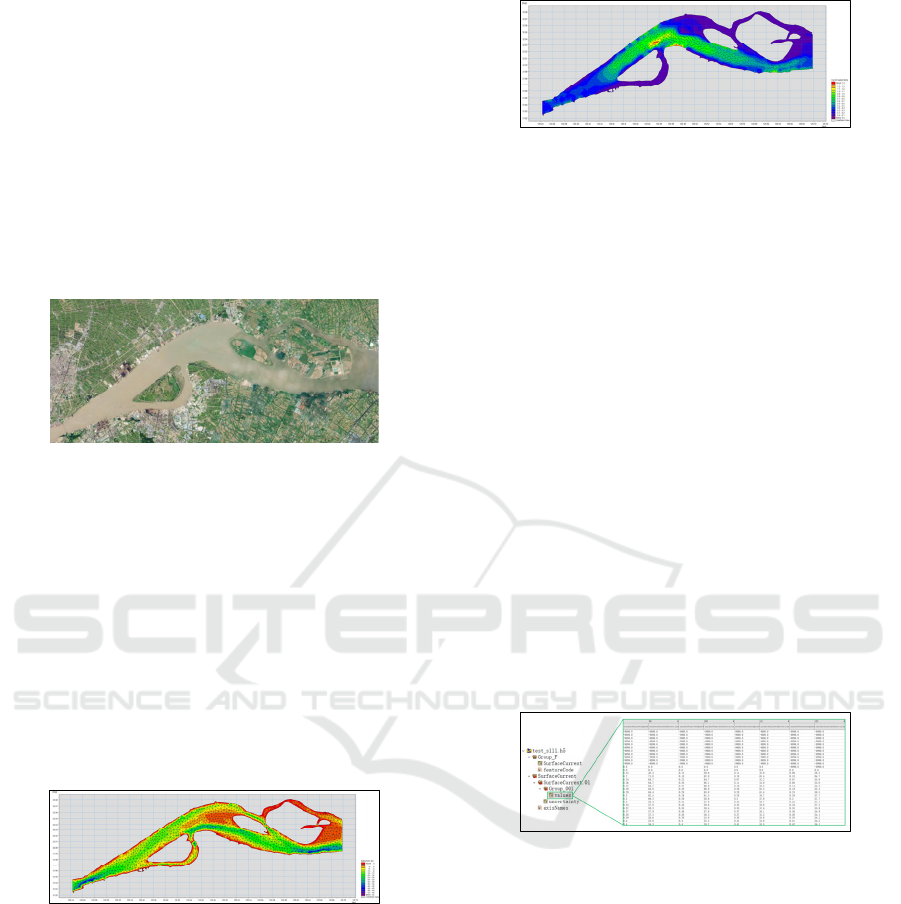
3.2 S-111 Data Generation and
Visualization
Based on the results from MIKE 21, this study uses a
script to perform interpolation and gridding of flow
velocity and direction data, generating surface current
data files compliant with the S-111 standard. The
domain of the regular grid is defined by the latitude
range from about 31.93 N to 32.08 N and the
longitude range from about 120.24 E to 120.70 E,
with a grid resolution of 0.001. The interpolation
method is used to map irregularly distributed data
points onto a regular latitude-longitude grid.
Subsequently, the gridded data is further processed to
generate a surface current data file in HDF5 format.
The interpolated data file is loaded, and the flow
velocity and direction data are reconstructed into two-
dimensional arrays. Geographic boundaries,
resolution, and grid dimensions are then defined,
ensuring consistency with the settings in the
interpolation step. The resulting S-111 surface current
is shown in the figure 9.
Figure 9: Generated S-111 surface current data.
Based on the Cesium platform, this study
develops a frontend platform for data reading and
visualization, allowing complex current velocity and
direction data to be presented in an intuitive manner.
The platform reads the HDF5 files, parses the current
velocity and direction data into two-dimensional
arrays, and converts them into vector format. The
display of arrows is defined according to the S-111
surface flow product specifications, including
parameters such as color, size, and direction. The
visualization of the S-111 surface current is shown in
the figure 10.
GISTAM 2025 - 11th International Conference on Geographical Information Systems Theory, Applications and Management
234

(a) (b)
Figure 10: Visualization of S-111 surface current data (a)
and its zoom-in (b).
4 CONCLUSIONS
This study focuses on the Fujiangsha and successfully
generates surface current data compliant with the S-
111 standard, based on the S-100 framework and the
Mike 21 hydrodynamic model. The data is visualized
using Cesium for intuitive display. The research
results demonstrate that the integration of
standardization and visualization techniques provides
a clearer representation of the hydrological
characteristics in complex water areas, offering
support for improving channel management and
navigation safety. However, it should be noted that
the S-100 standard has not yet been officially
implemented, and the current study area lacks
validated observational data. Future research could
refine the MIKE 21 model parameters using actual
hydrological measurements when available, thereby
enhancing the accuracy of simulation results. The
standardized data processing framework and
visualization scheme proposed in this study have
demonstrated applicability to compliant hydrological
data, which may serve as a reference for establishing
operational systems in standardized maritime
environments.
ACKNOWLEDGEMENTS
We would like to thank the National Natural Science
Foundation of China (NSFC) [grant number
52371363] for their funding.
REFERENCES
Luo, J. N., Wan, X. X., Sun, D. L., Wu, J., Xu, W. G., Liu,
L. W., & Duan, J. (2019). S-100 hydrographic
geospatial data model review. Bulletin of Surveying and
Mapping, (3), 91-97+112. DOI: 10.13474/j.cnki.11-
2246.2019.0085
Wu, L. L., Li, Q. W., Jiang, L. J., & Wang, X. Z. (2019).
IHO S-102 bathymetric surface data model and its
application analysis. Hydrographic Surveying and
Charting, (2), 62-66.
Peng, W., Sang, B. C., Shen, J. Q., Chen, J. Q., Zhou, G. N.,
& Wu, X. (2017). Cartographic representation of the
IHO S-100 universal hydrographic data model.
Hydrographic Surveying and Charting, (1), 55-59.
Dou, H. X. (2013). Research on the application model of
chart feature modeling based on S-100 standard
(Master's thesis, Dalian Maritime University).
Liu, Q. C. (2012). Research on Chart Data Based on S-100
Modeling Mechanism (Master's thesis, Dalian Maritime
University).
Li, X. B. (2024). River water surface profile calculation
based on Mike 21 and HEC-RAS. Water Sciences and
Engineering Technology, (5), 29-31. DOI:10.19733/
j.cnki.1672-9900.2024.05.08
Lü, Z. Y. (2024). Two-dimensional numerical simulation
study on the impact of long-distance along-river
bridges on flood water levels (Master's thesis, Xi'an
University of Technology). DOI:10.27398/
d.cnki.gxalu.2024.000298
Hu, X. W. (2024). Development of rapid response software
for offshore search and rescue in Dalian sea area based
on numerical simulation (Master's thesis, Dalian Ocean
University). DOI:10.27821/d.cnki.gdlhy.2024.000514
Surface Current Visualization in Waterway Based on Mike 21 Model and S-100 Standards
235
