
A Framework for Real-Time Monitoring of Power Consumption of
Distributed Calculation on Computational Cluster
Adam Krechowicz
a
Faculty of Electrical Engineering, Automatic Control and Computer Science, Kielce University of Technology,
al. 1000-lecia PP 7, Kielce, Poland
Keywords:
Cluster Management, Power Consumption, Distributed System, Machine Learning, NoSQL.
Abstract:
This paper proposes a framework for real-time monitoring of the power consumption of distributed calculation
on the nodes of the cluster. The framework allows to visualize and analyze the provider results based on the
context information about the performed calculation. The first part of the framework is devoted to monitoring
the power consumption during the execution of machine learning algorithms and the performance of NoSQL
storage. The second part is dedicated to the testing of distributed data storage, called Scalable Distributed
Two–Layered Data Structure (SD2DS). The results show that the framework can be used in the development
of a management system that could schedule computations to take full advantage of renewable energy.
1 INTRODUCTION
Management of power consumption is crucial for sus-
tainable development in many areas. Planning and
monitoring these consumptions may be beneficial not
only in reducing costs but also in reducing carbon
emissions. The case also applies to the management
of computer clusters.
Concerns about the power consumption of large
language models have been in active debate in recent
years (Zhu et al., 2024). There is also a active de-
velopment of methods that could be more efficient in
the case of power consumption (Iftikhar and Davy,
2024). In general, the power consumption of the clus-
ter nodes is strictly related to the computational load
of the machines (Ros et al., 2014).
Another striking example is the proof-of-work
model in blockchain-based cryptocurrencies (Zhou
et al., 2020) which is well known for power consump-
tion problems (Voloshyn et al., 2023). Power con-
sumption was the main motivation for introducing al-
ternative ways of confirming the transaction, such as
the proof-of-stake (Gundaboina et al., 2022).
To address these problems, this paper proposes
a framework for real-time monitoring of the power
consumption of distributed calculation on the nodes
of the cluster. The framework consists of two main
parts. The first part consists of the process that al-
lows to periodically check the cluster consumption
and stores those information durable memory. The
a
https://orcid.org/0000-0002-6177-9869
second part of the framework allows to visualize and
analyze the provider results based on the context in-
formation about the performed calculation. The main
contribution of the paper focuses on taking into con-
sideration different kinds of computations (Machine
Learning as well as NoSQL data store). Additionally,
the proposed approach allows us to monitor power
consumption during nodes failures.
Using this framework will contribute to the devel-
opment of energy-consumption-sensitive algorithms.
It can also be used in the development of a manage-
ment system that could schedule computations to take
full advantage of renewable energy.
The paper is organized as follows. Chapter 2 cov-
ers the related works. In the next chapter, the pro-
posed methodology and the architecture of the frame-
work is presented. The chapter 4 shows the results of
the work of the framework on two illustrative exam-
ples of analyzing power consumption during the ex-
ecution of machine learning algorithms and the per-
formance of NoSQL storage. The paper ends with
conclusions.
2 RELATED WORKS
In (Valentini et al., 2013) the authors reviewed the
most popular power management approaches, namely
static power management (SPM) systems using low
power components to save energy, and dynamic
power management (DPM) systems using software
and power-scalable components to manage energy
264
Krechowicz, A.
A Framework for Real-Time Monitoring of Power Consumption of Distributed Calculation on Computational Cluster.
DOI: 10.5220/0013471500003950
In Proceedings of the 15th International Conference on Cloud Computing and Services Science (CLOSER 2025), pages 264-271
ISBN: 978-989-758-747-4; ISSN: 2184-5042
Copyright © 2025 by Paper published under CC license (CC BY-NC-ND 4.0)

consumption.
The authors of (Alfianto et al., 2020) designed
a system to monitor electricity consumption in a
computer cluster with WCS1800 to a current sensor
and the Atmega32 microcontroller. They monitored
power consumption at the start and end of the com-
puter cluster program.
The work (Ye et al., 2005) focuses on carrying out
the survey on the techniques applied to the modeling
of energy consumption for data centers. The study
finds that not many models that allowed the modeling
of power consumption of the entire data center were
found. Moreover, a lot of power models were estab-
lished on a few CPU or server metrics. In addition to
this, the performance of the analyzed power models
requires further investigation.
In (Elnozahy et al., 2002) the authors evalu-
ated several dynamic voltage scaling and node vary-
on/vary-off policies aimed at cluster-wide power
management in server farms. The best results in re-
ducing the aggregated power consumption during the
time of reduced workload were obtained for a coordi-
nated voltage scaling policy in connection with node
vary-on/vary-off .
The authors (Bhuiyan et al., 2020) proposed a con-
cept of a speed profile designed to reduce long-term
energy usage due to modeling the variation of energy
consumption per task and cluster. They analyzed a
cluster of multicore nodes. During simulation, they
received a maximum CPU energy savings 67% com-
pared to other methods.
The work (Pan et al., 2005) explores the use of
high-performance cluster nodes that allow frequency
scaling to save energy by reducing CPU power. The
results suggest that the proposed approach can save
energy and also reduce execution time by increas-
ing the number of nodes and lowering the frequency-
voltage settings.
In the paper (Chen et al., 2005) the authors investi-
gate different schemes for saving power in sparse ma-
trix computations by using voltage/frequency scaling,
particularly in non-critical path processors. Experi-
ments with real and model matrices demonstrate that
the proposed strategies are highly effective.
The summary of state-of-the-art works is pre-
sented in the tab 1.
Analyzing state-of-the-art work it can be seen that
most of the papers focus on a specific type of calcula-
tions and are not necessarily suitable for a broad range
of possible computation. In addition, they usually do
not take into account power consumption during sys-
tem failures.
3 METHODOLOGY
The implementation of the framework proposed in
this work was developed in a cluster consisting of
16 blade servers each consisting of twin nodes with
Intel
®
Xeon
®
E5620 2.4GHz and 16GiB of RAM
memory. The blades were organized into two chassis.
Each chassis consists of four 2.5 kW power supplies
running at 230V. Measurement of power consumption
was possible with the Intelligent Platform Manage-
ment Interface (IPMI) module.
The general architecture of the framework is
shown in Fig. 1. The Power Monitoring Process
(PMP) consists of the Python script that scrapes the
information from the IPMI Web interface of both
chassis. The work of this script is presented in Fig. 2.
The PMP was working on the separate server which
ensures that it properly gathers the power consump-
tion data regardless of the condition of the cluster.
It also ensures that power consumption was not af-
fected by this process. The process was responsible
for monitoring the power consumption of both chas-
sis, so it actively monitors 8 power supplies. From a
software perspective, the PMP process used the Beau-
tifoulSOAP (Richardson, 2007) and Request library.
The blades on two chassis were responsible for
performing different application logic on different
subsets of the cluster nodes. In the paper, two appli-
cations are considered. Machine learning application
and NoSQL data store-based application. In those ap-
plications, it was vital to log any information regard-
ing the actual operations that were performed so that
they could later be assigned with the power consump-
tion profile.
The data collected by PMP were preprocessed, vi-
sualized, and analyzed by Power Analyzer Process
(PAP). It was performed offline after gathering and
joining the data with the application logs. From a soft-
ware perspective, PAP consists of the Python process
that used Pandas (pandas development team, 2020)
and Matplotlib (Hunter, 2007) libraries.
4 RESULTS
4.1 Ensemble Machine Learning
Experiment
The first experiment consists of the machine learning
(ML) application that performs learning and predicts
task time series forecasting. Three different ensemble
ML methods were used, Random Forest Regression
(RFR)(Parmar et al., 2019), Gradient Boosted Re-
gression (GBR) (Bent
´
ejac et al., 2021), and Adaptive
A Framework for Real-Time Monitoring of Power Consumption of Distributed Calculation on Computational Cluster
265
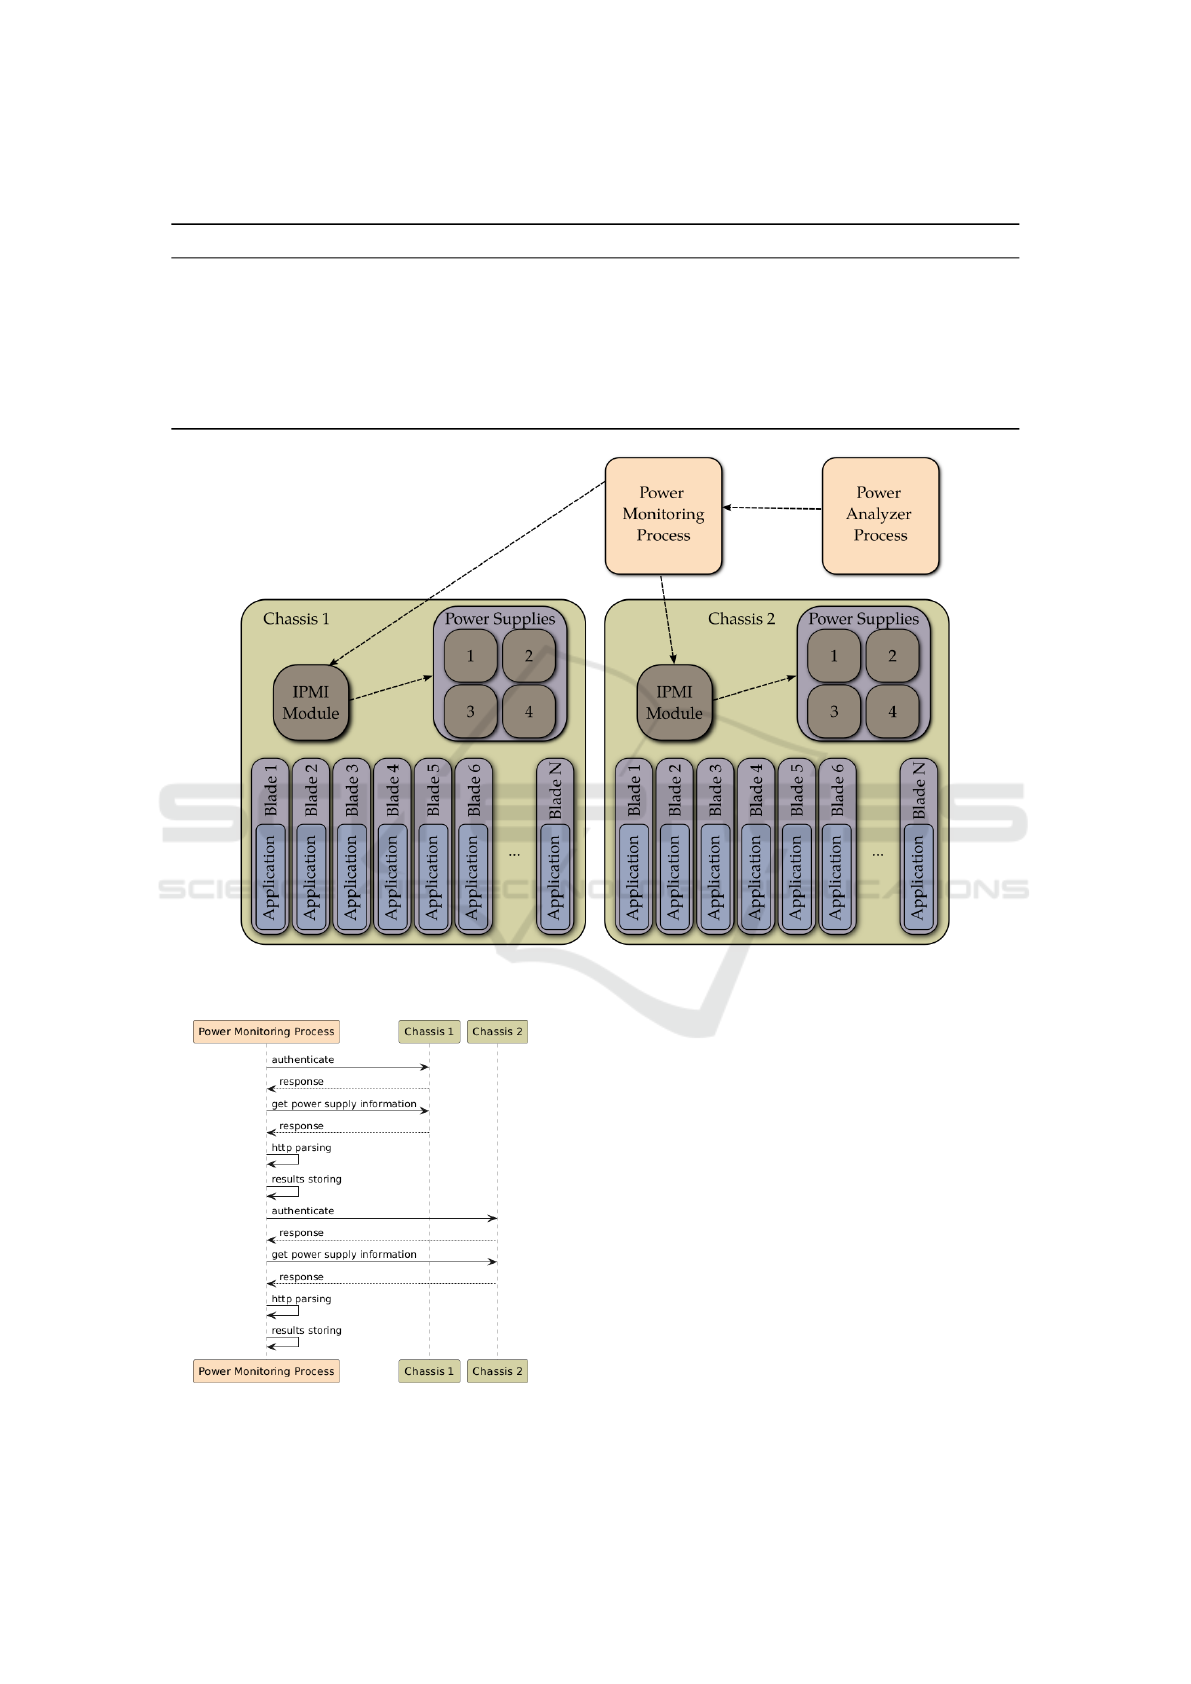
Table 1: Summary of selected studies on power management approaches and energy consumption techniques.
Reference Summary
(Valentini et al., 2013) Review of SPM and DPM systems for power management.
(Alfianto et al., 2020) System designed to monitor electricity consumption in a computer cluster.
(Ye et al., 2005) Survey of techniques and models for data center energy consumption.
(Elnozahy et al., 2002) Evaluation of dynamic voltage scaling in server farms.
(Bhuiyan et al., 2020) Speed profile concept for reducing energy in multicore clusters.
(Pan et al., 2005) Energy savings using high-performance cluster nodes with frequency scaling.
(Chen et al., 2005) Power saving in sparse matrix computations using voltage/frequency scaling.
Figure 1: The proposed framework architecture.
Figure 2: The sequence diagram of Power Monitoring Pro-
cess.
Boost Regression (ABR) (Solomatine and Shrestha,
2004), which were run parallel on different nodes of
the cluster. On each node, the grid search strategy
(Adnan et al., 2022) was used, so different values of
the hyperparameters were tested during sequential ex-
periments.
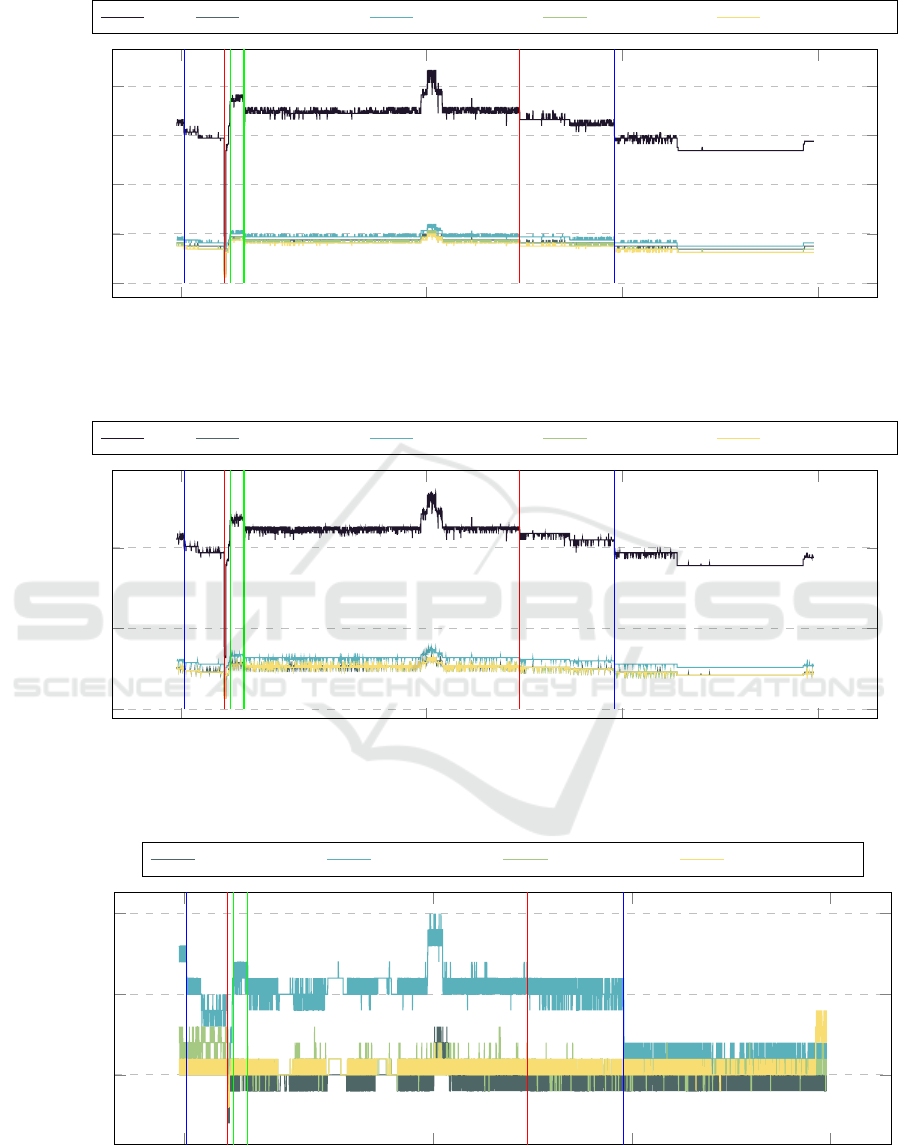
Fig. 3 presents the use of the alternate current
(AC) during ML experiments. Since the ML experi-
ment used only nodes on chassis 1 the figure presents
only values for four power supplies in this chassis.
The blue lines indicate the times the RFR models
were tested. The red and green lines mark the times of
execution of the GBR and ABR models, respectively.
It is worth noticing that the times of execution of
different models differ significantly. It was caused
by the fact that in the grid search strategy each com-
bination of hyperparameters needs to be tested. So,
the total execution time is strictly correlated with the
number of combinations of those hyperparameters. In
CLOSER 2025 - 15th International Conference on Cloud Computing and Services Science
266

case of the RFR models, each combination of 7 hy-
perparameters was used. In case of the GBR models,
combinations of six hyperparameters were used and
in case of ABR only two hyperparameters were ana-
lyzed.
The actual value of the AC consumption is strictly
correlated with the actual number of execution tests.
This can be seen after the start of the ABR models
when the AC current increases significantly. Then af-
ter the end of ABR, GBR, and RFR the decrease of
AC is also visible.
It is also worth noting the sudden increase in the
AC near the 15th April while no new processes were
executed. This indicates that the specific combina-
tion of the hyperparameters during the ML tests might
require more computational power and therefore re-
quires more electrical power to execute them.
Fig. 4 presents the consumption of direct current
(DC) during ML tests. It is worth noticing that both
the AC and DC values have the same trends in the
changes in the values. Since the voltage of the DC
is significantly lower, the output values of the DC are
higher than those of the AC. Because of that, only
analyzing one of those figures will be enough.
In both figures 3 and 4 an interesting trend can be
seen about the difference in the current provided by
different power supplies. Three of them (Power Sup-
ply 1, Power Supply 3, Power Supply 4) are loaded
very similar, while Power Supply 2 is more loaded.
This was mainly due to the redundancy policy used in
the case (Smith et al., 2008).
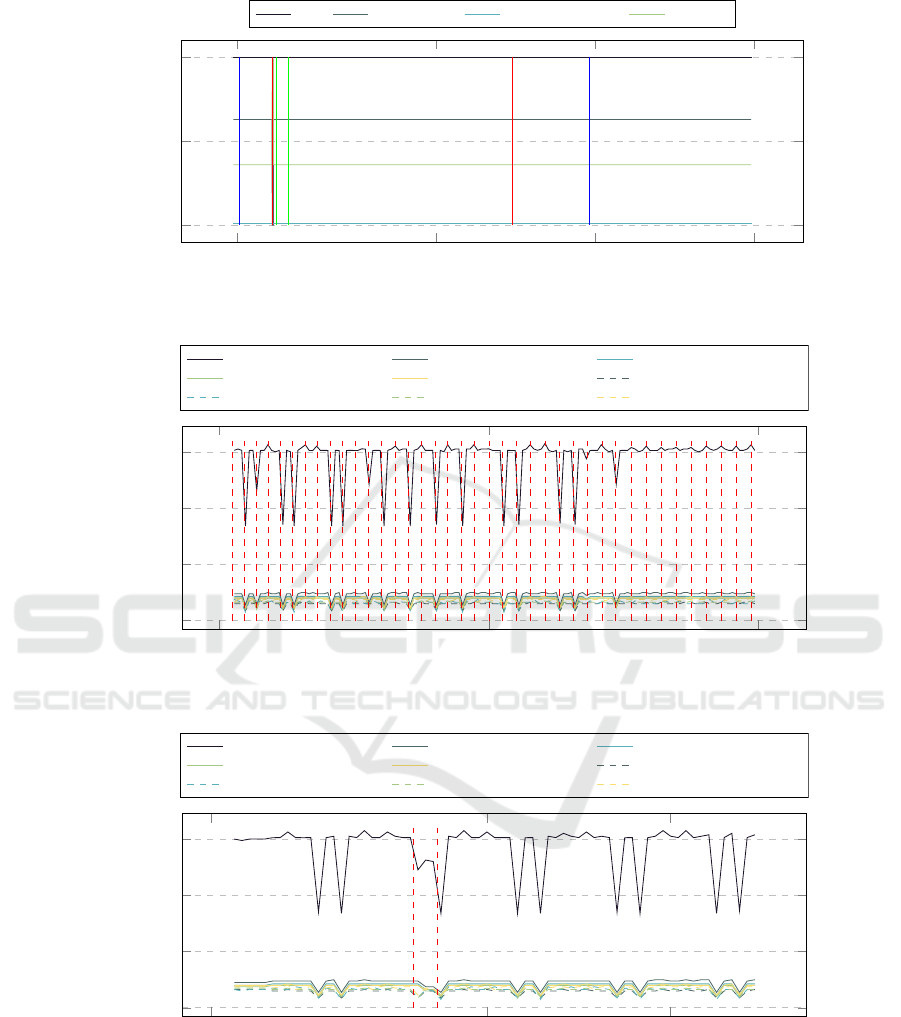
The measured temperatures of the power supplies
during ML experiments are depicted in Fig. 5. In
most cases, the temperature of the power supply is
strongly correlated with the power generated by a par-
ticular unit. The temperatures range from 22°C to
35°C, which can be considered natural values (Ko-
lari
´
c et al., 2011). The interesting fact is that the tem-
perature values oscillate in time. The source of those
oscillations requires further investigation.
Information about available power, peripheral
power, reserve power, and total power is presented in
Figure 6. As can be seen, those values are not depen-
dent on the actual experiment running. Because of
that, they are not used for further examination.
4.2 NoSQL Datastore Experiment
The second experiment aimed to test distributed
NoSQL data storage, called Scalable Distributed
Two–Layered Data Structure (SD2DS) (Krechowicz
et al., 2016; Krechowicz et al., 2017). The main
feature of this data storage is the distribution of the
stored data and its metadata into two separate loca-
tions (buckets). This separation proves to increase
efficiency and allows the introduction of many addi-
tional features (Krechowicz, 2016). The tests consists
of 17 nodes that run storage buckets. 10 additional
nodes were used to run storage client processes. Dur-
ing the tests different data item sizes and different
numbers of clients were analyzed.
In figure 7 the values of the AC are presented
while performing the NoSQL experiments. The red
dashed lines indicate the division into separate tests
that use different configurations. The blue values in-
dicate the sizes of the data items currently examined,
while the red values indicate the number of clients in-
stances that simultaneously send requests to the dis-
tributed data storage. Due to the similarities between
AC and DC presented in the previous experiment, the
DC values were omitted. Since nodes on two chassis
were used to run SD2DS buckets as well as clients,
the 8 power supplies on both chassis were analyzed.
In this figure, many regular drops in the AC val-
ues are visible. They were caused by the nature
of the tests. Each separate test consists of insert-
ing new items, retrieving inserted items, and wait-
ing phase. The wait phases were required to ensure
that all socket connections are properly closed before
running the next experiment. In that scenario, the
next test is not affected by the previous test. This is
extremely important in an environment where many
connections are made simultaneously. As the number
of clients and sizes of the data items increases those
drops are less and less visible. Additionally slight in-
crease in the total value of the power is also visible as
the number of clients operates on the store (velocity
of the data) and data items sizes (volume of the data)
increases.
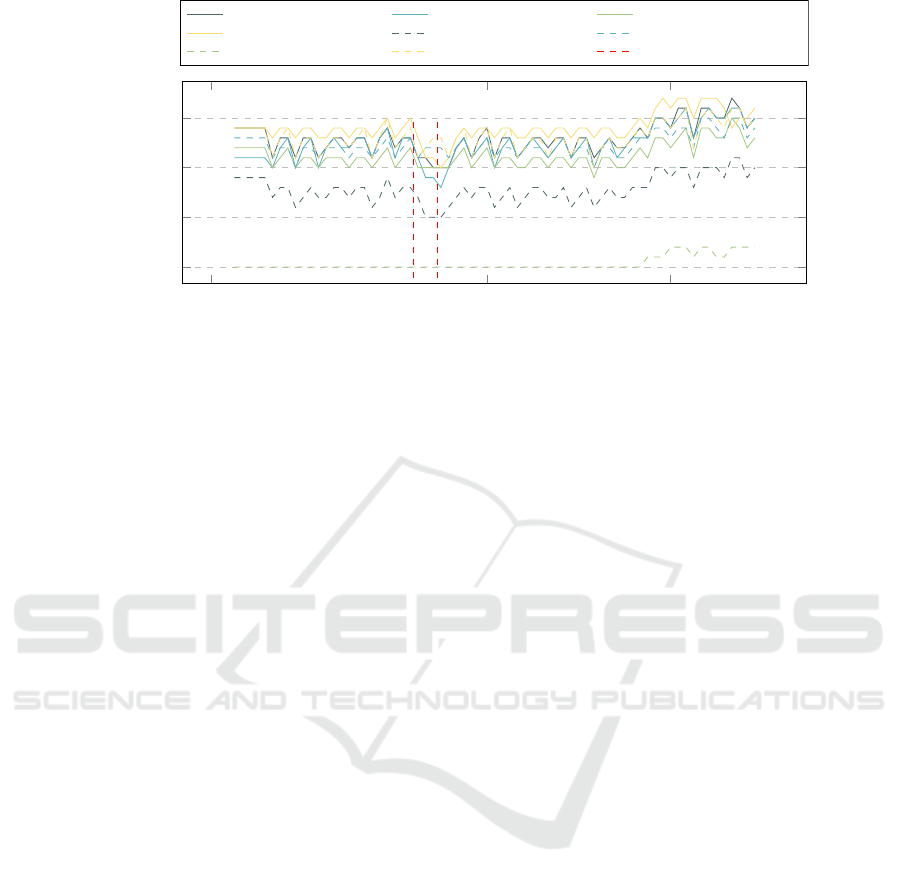
In the fig 8 the value of the AC is presented dur-
ing the failed experiment. In this case some random
exception happens that cause to crush 10 buckets so
clients could not be properly handled. The failed test
arises between the two dashed red lines in the area be-
tween the two dashed red lines. It can be clearly seen
that the failed test produces a different power con-
sumption profile than the correct experiments before
and after. The similar distortion in the temperature
profile during failed experiments can be seen in Fig.
9.
5 CONCLUSIONS
The purpose of the paper was to develop a framework
that can monitor the power consumption of the com-
pute cluster during the execution of distributed appli-
cations. The goal was achieved by web scraping of the
A Framework for Real-Time Monitoring of Power Consumption of Distributed Calculation on Computational Cluster
267
10.04.2024 15.04.2024 19.04.2024 23.04.2024
0
2
4
6
8
GBR experiments started
RFR experiments started
ABR experiments started
ABR experiments ended
GBR experiments ended
RFR experiments ended
Date
Alternate Current [A]
Total
Power Supply 1 Power Supply 2 Power Supply 3 Power Supply 4
Figure 3: Alternate Current consumption during Ensemble Machine Learning experiment.
10.04.2024 15.04.2024 19.04.2024 23.04.2024
0
50
100
GBR experiments started
RFR experiments started
ABR experiments started
ABR experiments ended
GBR experiments ended
RFR experiments ended
Date
Direct Current [A]
Total
Power Supply 1 Power Supply 2 Power Supply 3 Power Supply 4
Figure 4: Direct Current consumption during Ensemble Machine Learning experiment.
10.04.2024 15.04.2024 19.04.2024 23.04.2024
25
30
35
GBR experiments started
RFR experiments started
ABR experiments started
ABR experiments ended
GBR experiments ended
RFR experiments ended
Date
Temperature [°C]
Power Supply 1 Power Supply 2 Power Supply 3 Power Supply 4
Figure 5: Temperature of the Power Supplies during Ensemble Machine Learning experiment.
CLOSER 2025 - 15th International Conference on Cloud Computing and Services Science
268
10.04.2024 15.04.2024 19.04.2024 23.04.2024
0
0.5
1
·10
4
GBR experiments started
RFR experiments started
ABR experiments started
ABR experiments ended
GBR experiments ended
RFR experiments ended
Date
Power [W]
Total Blade Reserve Peripherial Reserve
Available
Figure 6: Power Reserve during Ensemble Machine Learning experiment.
12:00 18:00 00:00
0
5
10
15
10
10M
20
30
40
50
60
70
80
90
100
10
20M
20
30
40
50
60
70
80
90
100
10
30M
20
30
40
50
60
70
80
90
100
10
40M
20
30
40
50
60
70
80
90
Time
Alternate Current [A]
Total
Chassis 1 Power Supply 1 Chassis 1 Power Supply 2
Chassis 1 Power Supply 3 Chassis 1 Power Supply 4 Chassis 2 Power Supply 1
Chassis 2 Power Supply 2 Chassis 2 Power Supply 3 Chassis 2 Power Supply 4
Figure 7: Alternate Current consumption during NoSQL experiment.
11:00
14:00
16:00
0
5
10
15
Time
Alternate Current [A]
Total
Chassis 1 Power Supply 1 Chassis 1 Power Supply 2
Chassis 1 Power Supply 3 Chassis 1 Power Supply 4 Chassis 2 Power Supply 1
Chassis 2 Power Supply 2 Chassis 2 Power Supply 3 Chassis 2 Power Supply 4
Figure 8: Alternate Current consumption during failed NoSQL experiment.
Intelligent Platform Management Interface web inter-
face. The framework allows to monitor the values
of Alternate Current, Direct Current, Power Supply
Temperature, and Power Reserve. It is worth men-
tioning that the proposed solution can be used with-
out utilizing additional resources (such as additional
power sensors).
A characteristic feature of the solution proposed
in this paper, which is also a contribution to the body
of knowledge, is its universality, i.e. a suitability to
A Framework for Real-Time Monitoring of Power Consumption of Distributed Calculation on Computational Cluster
269
11:00
14:00
16:00
25
30
35
40
Time
Temperature [°C]
Total
Chassis 1 Power Supply 1 Chassis 1 Power Supply 2
Chassis 1 Power Supply 3 Chassis 1 Power Supply 4 Chassis 2 Power Supply 1
Chassis 2 Power Supply 2 Chassis 2 Power Supply 3 Chassis 2 Power Supply 4
Figure 9: Temperature of the Power Supplies during failed NoSQL experiment.
apply it for diverse types of computation, including
those for Machine Learning and NoSQL data storage.
Moreover, the proposed approach enables us to track
power usage during node failures.
In the paper, two power consumption profiles were
analyzed. The first profile was gathered during En-
semble machine learning experiments, while the sec-
ond concerned receiving data items from distributed
NoSQL data storage. Analyzing the results allows
us to find dependencies between the experiments exe-
cuted and the actual value of the current consumption
and the temperature of the power supplies.
In the future, the proposed framework could be
used to assess distributed algorithms in terms of
power consumption. In addition, it could be used
to properly schedule the computation to minimize
the cost of electrical power. This approach could
contribute to the efficient use of renewable energy
sources. For example, by adjusting the calculation
time to the time period of the high energy yield from
photovoltaic panels. Future plans also include mod-
ifying the framework in such a case that power con-
sumption could be monitored for separate nodes.
REFERENCES
Adnan, M., Alarood, A. A. S., Uddin, M. I., and ur Rehman,
I. (2022). Utilizing grid search cross-validation with
adaptive boosting for augmenting performance of ma-
chine learning models. PeerJ Computer Science,
8:e803.
Alfianto, E., Agustini, S., Muharom, S., Rusydi, F., and
Puspitasari, I. (2020). Design monitoring electrical
power consumtion at computer cluster. In Journal
of Physics: Conference Series, volume 1445, page
012027. IOP Publishing.
Bent
´
ejac, C., Cs
¨
org
˝
o, A., and Mart
´
ınez-Mu
˜
noz, G. (2021).
A comparative analysis of gradient boosting algo-
rithms. Artificial Intelligence Review, 54:1937–1967.
Bhuiyan, A., Liu, D., Khan, A., Saifullah, A., Guan,
N., and Guo, Z. (2020). Energy-efficient parallel
real-time scheduling on clustered multi-core. IEEE
Transactions on Parallel and Distributed Systems,
31(9):2097–2111.
Chen, G., Malkowski, K., Kandemir, M., and Raghavan, P.
(2005). Reducing power with performance constraints
for parallel sparse applications. In 19th IEEE Inter-
national Parallel and Distributed Processing Sympo-
sium, pages 8–pp. IEEE.
Elnozahy, E. N., Kistler, M., and Rajamony, R. (2002).
Energy-efficient server clusters. In International
workshop on power-aware computer systems, pages
179–197. Springer.
Gundaboina, L., Badotra, S., Tanwar, S., and Manik (2022).
Reducing resource and energy consumption in cryp-
tocurrency mining by using both proof-of-stake al-
gorithm and renewable energy. In 2022 Interna-
tional Mobile and Embedded Technology Conference
(MECON), pages 605–610.
Hunter, J. D. (2007). Matplotlib: A 2d graphics environ-
ment. Computing in Science & Engineering, 9(3):90–
95.
Iftikhar, S. and Davy, S. (2024). Reducing carbon footprint
in ai: A framework for sustainable training of large
language models. In Arai, K., editor, Proceedings
of the Future Technologies Conference (FTC) 2024,
Volume 1, pages 325–336, Cham. Springer Nature
Switzerland.
Kolari
´
c, D., Lipi
´
c, T., Grubi
ˇ
si
´
c, I., Gjenero, L., and Skala,
K. (2011). Application of infrared thermal imaging in
blade system temperature monitoring. In Proceedings
ELMAR-2011, pages 309–312. IEEE.
Krechowicz, A. (2016). Scalable distributed two-layer data-
store providing data anonymity. In Beyond Databases,
Architectures and Structures. Advanced Technologies
for Data Mining and Knowledge Discovery: 12th In-
ternational Conference, BDAS 2016, Ustro
´
n, Poland,
May 31-June 3, 2016, Proceedings 11, pages 262–
271. Springer.
CLOSER 2025 - 15th International Conference on Cloud Computing and Services Science
270

Krechowicz, A., Chrobot, A., Deniziak, S., and Łukawski,
G. (2017). Sd2ds-based datastore for large files.
In Proceedings of the 2015 Federated Conference
on Software Development and Object Technologies,
pages 150–168. Springer.
Krechowicz, A., Deniziak, S., Bedla, M., Chrobot, A., and
Łukawski, G. (2016). Scalable distributed two-layer
block based datastore. In Parallel Processing and
Applied Mathematics: 11th International Conference,
PPAM 2015, Krakow, Poland, September 6-9, 2015.
Revised Selected Papers, Part I 11, pages 302–311.
Springer.
Pan, F., Freeh, V. W., and Smith, D. M. (2005). Exploring
the energy-time tradeoff in high-performance comput-
ing. In 19th IEEE International Parallel and Dis-
tributed Processing Symposium, pages 9–pp. IEEE.
pandas development team, T. (2020). pandas-dev/pandas:
Pandas.
Parmar, A., Katariya, R., and Patel, V. (2019). A review
on random forest: An ensemble classifier. In Inter-
national conference on intelligent data communica-
tion technologies and internet of things (ICICI) 2018,
pages 758–763. Springer.
Richardson, L. (2007). Beautiful soup documentation.
April.
Ros, S., Caminero, A. C., Hern
´
andez, R., Robles-G
´
omez,
A., and Tobarra, L. (2014). Cloud-based architec-
ture for web applications with load forecasting mecha-
nism: a use case on the e-learning services of a distant
university. The Journal of Supercomputing, 68:1556–
1578.
Smith, W. E., Trivedi, K. S., Tomek, L. A., and Ackaret, J.
(2008). Availability analysis of blade server systems.
IBM Systems Journal, 47(4):621–640.
Solomatine, D. P. and Shrestha, D. L. (2004). Adaboost. rt:
a boosting algorithm for regression problems. In 2004
IEEE international joint conference on neural net-
works (IEEE Cat. No. 04CH37541), volume 2, pages
1163–1168. IEEE.
Valentini, G. L., Lassonde, W., Khan, S. U., Min-Allah, N.,
Madani, S. A., Li, J., Zhang, L., Wang, L., Ghani,
N., Kolodziej, J., et al. (2013). An overview of en-
ergy efficiency techniques in cluster computing sys-
tems. Cluster Computing, 16:3–15.
Voloshyn, V., Gonchar, V., Gorokhova, T., Korostova, I.,
and Mironenko, D. (2023). Research on the problem
of the efficiency of bitcoins: The energy costs for the
generation of this cryptocurrency on a global scale. In
Information Modelling and Knowledge Bases XXXIV,
pages 195–203. IOS Press.
Ye, M., Li, C., Chen, G., and Wu, J. (2005). Eecs: an
energy efficient clustering scheme in wireless sensor
networks. In PCCC 2005. 24th IEEE International
Performance, Computing, and Communications Con-
ference, 2005., pages 535–540. IEEE.
Zhou, Q., Huang, H., Zheng, Z., and Bian, J. (2020). So-
lutions to scalability of blockchain: A survey. Ieee
Access, 8:16440–16455.
Zhu, H., Liu, J., Li, X., Huang, Z., and Zhang, Y. (2024). A
power consumption measurement method for large ai-
based intelligent computing servers. In Proceedings
of the 2023 5th International Conference on Internet
of Things, Automation and Artificial Intelligence, Io-
TAAI ’23, page 150–155, New York, NY, USA. As-
sociation for Computing Machinery.
A Framework for Real-Time Monitoring of Power Consumption of Distributed Calculation on Computational Cluster
271
